Notebookcheck Logo

Telechips TCC8803 1GHz vs Qualcomm Snapdragon 400 MSM8226 vs HiSilicon Kirin 9000W

Telechips TCC8803 1GHz

► remove from comparison  TCC8803 1GHz

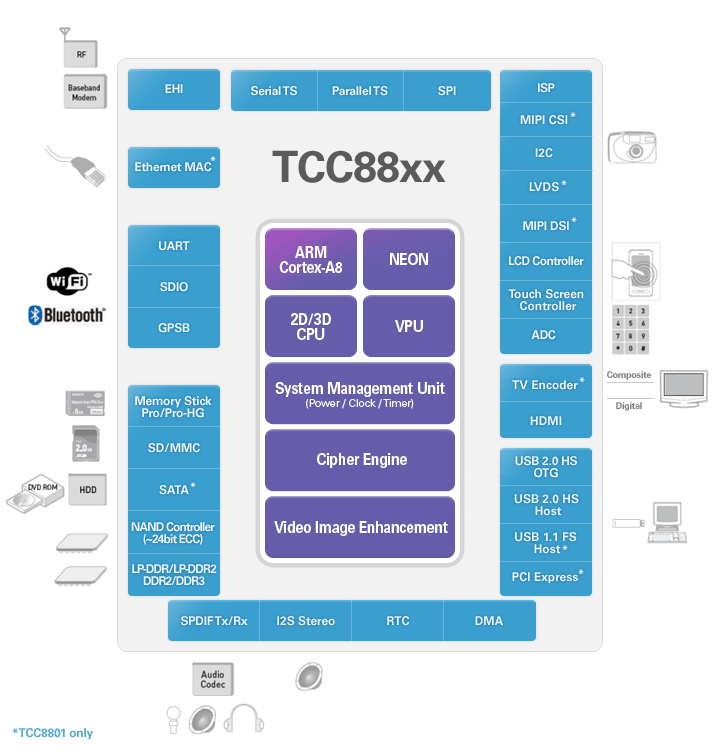
ARM Mali 2D/3D graphics accelerator, DDR / DDR2 / LP-DDR2 / LP-DDR2 memory interface, LVDS Transmitter, HDMI 1.4, Composite TV-Out (NTSC / PAL), USB 2.0 HS OTG, USB 2.0 host, USB 1.1 HOST, EHI (External Host Interface), UART, NAND Flash Interface

Telechips' TCC88xx application processor will redefine the mobile device of tomorrow with new' innovative user experience by PC-like web browsing, 1080p full HD video record & playback, intuitive user interfaces, location based services and next generation social networking applications. TCC88xx supports development of planned features for the Tablet PC and HMP of tomorrow with tremendous performance and programmability to support new applications yet to be imagined. TCC88xx is equipped with hardwired VPU/GPU/ISP to maximize multimedia experience at its peak level.


Qualcomm Snapdragon 400 MSM8226

► remove from comparison Qualcomm 400 MSM8226

The Qualcomm Snapdragon 400 MSM8226 is an entry-level ARM-SoC for Android smartphones. It integrates four Cortex-A7 cores at up to 1.2 GHz (Quad-Core) and a Adreno 305 graphics card at 450 MHz. Furthermore, a HSPA+ radio, WLAN (b,g,n) and Bluetooth 4.0 are integrated in the SoC.

HiSilicon Kirin 9000W

► remove from comparison  Kirin 9000W

The HiSilicon Kirin 9000W is an SoC that can be used in smartphones and tablets based on Android and was first installed in the Huawei MatePad Pro 13.2.

Huawei does not reveal any information about the SoC. The little information that is available comes from benchmarks and system analysis tools. The CPU consists of three clusters with a total of 12 cores. The power-saving cluster has four ARM Cortex-A510 cores, each operating at up to 1,530 MHz, while six other cores use unspecified cores from HiSilicon (0x0D42) and clock at up to 2,150 MHz. The third cluster contains two HiSilicon cores (0x0D02), each with a maximum clock speed of 2,487 MHz. The performance cores could possibly be based on the TaiShan V120 architecture (as in the Kirin 9000S).

The single-core performance is correspondingly mixed, but the multi-core performance is at the level of a high-end SoC from 2022 due to the numerous cores.

A Maleoon 910 by HiSilicon is integrated as the graphics unit, similar to the 9000S (where it was clocked with up to 750MHz).

Nothing concrete is known about the manufacturing process or the architecture. The SoC will probably be manufactured in 7 nm at SMIC.

ModelTelechips TCC8803 1GHzQualcomm Snapdragon 400 MSM8226HiSilicon Kirin 9000W
Series Qualcomm Snapdragon
Series:
newitem cores
HiSilicon Kirin 9000W1.53 - 2.49 GHz12 / 12 cores
UNISOC Tiger T3101.8 - 2 GHz4 / 4 cores
Rockchip RK32881.8 GHz4 / 4 cores
Apple A6x1.4 GHzcores
Apple A61 GHzcores
Apple S52 / 2 cores
HiSilicon k3v2 Hi36201.2 GHz4 / 4 cores
Rockchip RK3066 1.5 GHz1.5 GHz2 / 2 cores
Amlogic AML8726-MX1.5 GHz2 / 2 cores
Rockchip RK31681.2 GHz2 / 2 cores
Rockchip RK2918 1.2 GHz1.2 GHz1 / 1 cores
ARM Cortex A8 1.2 GHz1.2 GHz1 / 1 cores
Telechips TCC8803 1GHz « 1 GHz1 / 1 cores
Loongson 2F 900MHz0.9 GHz1 / 1 cores
CSR86700.08 GHzcores
ARM Cortex-M4 cores
HiSilicon Hi6262 cores
DK3.5+STcores
unknown cores
Qualcomm Snapdragon S4 Pro APQ8064A1.5 GHz4 / 4 cores ARMv7
Qualcomm Snapdragon 400 MSM89281.6 GHz4 / 4 cores ARMv7
Qualcomm Snapdragon 400 APQ80281.6 GHz4 / 4 cores ARMv7
Qualcomm Snapdragon S4 Pro MSM8960T1.7 GHz2 / 2 cores ARMv7
Qualcomm Snapdragon 400 8930AB1.7 GHz2 / 2 cores ARMv7
Qualcomm Snapdragon S4 Plus APQ8060A1.5 GHz2 / 2 cores ARMv7
Qualcomm Snapdragon S4 Plus MSM89601.5 GHz2 / 2 cores ARMv7
Qualcomm Snapdragon S4 Plus MSM8260A1.7 GHz2 / 2 cores ARMv7
Qualcomm Snapdragon 400 MSM89261.2 GHz4 / 4 cores ARMv7
Qualcomm Snapdragon 400 MSM8226 « 1.2 GHz4 / 4 cores ARMv7
Qualcomm Snapdragon 400 APQ80261.2 GHz4 / 4 cores ARMv7
Qualcomm Snapdragon S4 Plus MSM89301.2 GHz2 / 2 cores ARMv7
Qualcomm Snapdragon S4 Plus MSM82301.2 GHz2 / 2 cores ARMv7
Qualcomm Snapdragon S4 Plus MSM82271 GHz2 / 2 cores ARMv7
Qualcomm Snapdragon S3 MSM86601.7 GHz2 / 2 cores ARMv7
Qualcomm Snapdragon S3 MSM82601.5 GHz2 / 2 cores ARMv7
Qualcomm Snapdragon S1 QSD82501 GHz1 / 1 cores ARMv7
newitem cores
HiSilicon Kirin 9000W « 1.53 - 2.49 GHz12 / 12 cores
UNISOC Tiger T3101.8 - 2 GHz4 / 4 cores
Rockchip RK32881.8 GHz4 / 4 cores
Apple A6x1.4 GHzcores
Apple A61 GHzcores
Apple S52 / 2 cores
HiSilicon k3v2 Hi36201.2 GHz4 / 4 cores
Rockchip RK3066 1.5 GHz1.5 GHz2 / 2 cores
Amlogic AML8726-MX1.5 GHz2 / 2 cores
Rockchip RK31681.2 GHz2 / 2 cores
Rockchip RK2918 1.2 GHz1.2 GHz1 / 1 cores
ARM Cortex A8 1.2 GHz1.2 GHz1 / 1 cores
Telechips TCC8803 1GHz1 GHz1 / 1 cores
Loongson 2F 900MHz0.9 GHz1 / 1 cores
CSR86700.08 GHzcores
ARM Cortex-M4 cores
HiSilicon Hi6262 cores
DK3.5+STcores
unknown cores
Clock1000 MHz1200 MHz1530 - 2490 MHz
Cores / Threads1 / 14 / 412 / 12
2 x 2.5 GHz
6 x 2.2 GHz
4 x 1.5 GHz ARM Cortex-A510
Technology65 nm28 nm7 nm
ArchitectureARMARMARM
Announced
CodenameARMv7
FeaturesHSPA+, EDGE, GSM, GPRS, WiFi 802.11b/g/n, Bluetooth 4.0
iGPUQualcomm Adreno 305 (450 MHz)HiSilicon Maleoon 910
Manufacturerwww.qualcomm.com

Benchmarks

3DMark - 3DMark Ice Storm Physics
min: 6279     avg: 7206     median: 7273 (6%)     max: 7619 Points
3DMark - 3DMark Ice Storm Extreme Physics
min: 6229     avg: 7302     median: 7454.5 (6%)     max: 7768 Points
3DMark - 3DMark Ice Storm Unlimited Physics
min: 6150     avg: 7381     median: 7724 (7%)     max: 7983 Points
3DMark - 3DMark Sling Shot Extreme (ES 3.1) Unlimited Physics
5690 Points (67%)
3DMark - 3DMark Sling Shot (ES 3.0) Unlimited Physics
5614 Points (64%)
Geekbench 6.2 - Geekbench 6.2 Single-Core
1174 Points (32%)
Geekbench 6.2 - Geekbench 6.2 Multi-Core
4088 Points (16%)
Geekbench 5.5 - Geekbench 5.1 - 5.4 64 Bit Single-Core
867 Points (37%)
Geekbench 5.5 - Geekbench 5.1 - 5.4 64 Bit Multi-Core
3878 Points (7%)
Geekbench 4.4 - Geekbench 4.1 - 4.4 64 Bit Single-Core
4712 Points (47%)
Geekbench 4.4 - Geekbench 4.1 - 4.4 64 Bit Multi-Core
13978 Points (15%)
Geekbench 4.0 - Geekbench 4.0 64 Bit Single-Core
435 Points (6%)
Geekbench 4.0 - Geekbench 4.0 64 Bit Multi-Core
1109 Points (3%)
Geekbench 3 - Geekbench 3 32 Bit Multi-Core
min: 1027     avg: 1123     median: 1147 (2%)     max: 1169 Points
Geekbench 3 - Geekbench 3 32 Bit Single-Core
min: 326     avg: 338.3     median: 341 (7%)     max: 347 Points
Geekbench 2 - 32 Bit - Geekbench Stream
min: 268     avg: 283.8     median: 286 (2%)     max: 295 Points
Geekbench 2 - 32 Bit - Geekbench Memory
min: 1078     avg: 1205     median: 1225 (11%)     max: 1290 Points
Geekbench 2 - 32 Bit - Geekbench Floating Point
min: 1782     avg: 1807     median: 1788 (4%)     max: 1870 Points
Geekbench 2 - 32 Bit - Geekbench Integer
min: 1019     avg: 1057     median: 1065.5 (2%)     max: 1077 Points
Geekbench 2 - 32 Bit - Geekbench Total Score
min: 1244     avg: 1271     median: 1279 (3%)     max: 1282 Points
Linpack Android / IOS - Linpack Single Thread
13.4 MFLOPS (1%)
Linpack Android / IOS - Linpack Multi Thread
min: 190     avg: 223.4     median: 225.4 (8%)     max: 248.8 MFLOPS
Mozilla Kraken 1.1 - Kraken 1.1 Total Score *
min: 14907     avg: 19470     median: 17405 (20%)     max: 26891 ms
1202 ms (1%)
Sunspider - Sunspider 1.0 Total Score *
min: 983     avg: 1374     median: 1243 (14%)     max: 2244 ms
203.8 ms (2%)
Sunspider - Sunspider 0.9.1 Total Score *
min: 1067     avg: 1204     median: 1133 (11%)     max: 1413 ms
Octane V2 - Octane V2 Total Score
min: 1085     avg: 1594     median: 1449 (1%)     max: 2217 Points
33982 Points (31%)
WebXPRT 4 - WebXPRT 4 Score
99 Points (28%)
Vellamo 3.x - Vellamo 3.x Metal
min: 623     avg: 760     median: 800 (21%)     max: 858 Points
Vellamo 3.x - Vellamo 3.x Multicore Beta
min: 1222     avg: 1331     median: 1376 (31%)     max: 1394 Points
Vellamo 3.x - Vellamo 3.x Browser
min: 1644     avg: 1670     median: 1672 (22%)     max: 1693 Points
Quadrant Standard Edition 2.0 - Quadrant Standard 2.0 Total Score
min: 8832     avg: 9189     median: 9018 (21%)     max: 9886 points
AnTuTu v4 - AnTuTu v4 Total Score
min: 15351     avg: 16709     median: 16962.5 (39%)     max: 17360 Points
AnTuTu v5 - AnTuTu v5 Total Score
min: 17280     avg: 17980     median: 17949 (18%)     max: 18711 Points
AnTuTu v6 - AnTuTu v6 Total Score
23500 Points (8%)
Antutu v9 - AnTuTu v9 Total Score
655341 Points (40%)
Antutu v9 - AnTuTu v9 CPU
182634 Points (50%)
AndEBench - AndEBench Java
min: 291     avg: 330.6     median: 337 (10%)     max: 343 Iter./s
AndEBench - AndEBench Native
min: 6050     avg: 6377     median: 6412 (21%)     max: 6487 Iter./s
PassMark PerformanceTest Mobile V1 - PerformanceTest Mobile V1 CPU Tests
min: 6912     avg: 7247     median: 7300.5 (1%)     max: 7468 Points
PCMark for Android - PCM f. Android Storage 2.0 random write internal
110.5 MB/s (81%)
PCMark for Android - PCM f. Android Storage 2.0 seq write internal
1435 MB/s (44%)
PCMark for Android - PCM f. Android Storage 2.0 random read internal
63.2 MB/s (78%)
PCMark for Android - PCM f. Android Storage 2.0 seq read internal
1522 MB/s (42%)
PCMark for Android - PCM f. Android Storage 2.0 score
45015 Points (71%)
PCMark for Android - PCM f. Android Work Score 3.0
10620 Points (49%)
CrossMark - CrossMark Overall
834 Points (32%)
Power Consumption - Geekbench 5.5 Power Consumption 150cd *
8.2 Watt (4%)
Power Consumption - Idle Power Consumption 150cd 1min *
4.2 Watt (5%)

Average Benchmarks Telechips TCC8803 1GHz → 0% n=

Average Benchmarks Qualcomm Snapdragon 400 MSM8226 → 0% n=

Average Benchmarks HiSilicon Kirin 9000W → 0% n=

- Range of benchmark values for this graphics card
- Average benchmark values for this graphics card
* Smaller numbers mean a higher performance
1 This benchmark is not used for the average calculation

v1.26
log 02. 05:03:05

#0 checking url part for id 3327 +0s ... 0s

#1 checking url part for id 4978 +0s ... 0s

#2 checking url part for id 17388 +0s ... 0s

#3 not redirecting to Ajax server +0s ... 0s

#4 did not recreate cache, as it is less than 5 days old! Created at Sat, 01 Jun 2024 05:37:57 +0200 +0.001s ... 0.001s

#5 composed specs +0.122s ... 0.123s

#6 did output specs +0s ... 0.123s

#7 getting avg benchmarks for device 3327 +0.003s ... 0.126s

#8 got single benchmarks 3327 +0.01s ... 0.136s

#9 getting avg benchmarks for device 4978 +0.004s ... 0.139s

#10 got single benchmarks 4978 +0.031s ... 0.17s

#11 getting avg benchmarks for device 17388 +0.003s ... 0.173s

#12 got single benchmarks 17388 +0.012s ... 0.185s

#13 got avg benchmarks for devices +0s ... 0.185s

#14 min, max, avg, median took s +0.168s ... 0.353s

#15 return log +0s ... 0.353s

Please share our article, every link counts!
> Expert Reviews and News on Laptops, Smartphones and Tech Innovations > Benchmarks / Tech > Processor Comparison - Head 2 Head
Redaktion, 2017-09- 8 (Update: 2023-07- 1)