Notebookcheck Logo

UNISOC Tiger T310 vs Intel Core i7-10700 vs Apple S5

UNISOC Tiger T310

► remove from comparison UNISOC T310

The Unisoc Tiger T310 is a SoC for smartphones and tablets of the entry level. It was first announced in mid 2019 and integrates four CPU cores (quad core). One big Cortex-A75 core clocked at up to 2 GHz and three small A55 cores with up to 1.8 GHz.

Furthermore, the chip integrates an LTE modem (Cat 7, TDD-LTE, FDD-LTE, TDSCDMA, WCDMA, CDMA, GSM), Bluetooth 5.0 and WiFi b/g/n/ac. The integrated ISP supports up to two cameras (16 MPixel and 8 Mpixel, maximum 30 fps video capture) and the GNSS can use all current standards (GPS, Glonass, Beidou, Galileo).

The memory controller is able to drive LPDDR3 at 933 MHz and faster LPDDR4x at 1333 MHz.

The PowerVR GE8300 iGPU is from Imagination and clocked at up to 800 MHz.

The chip is produced in 12nm at TSMC and should offer a rather good power efficiency (for 2019).

Intel Core i7-10700

► remove from comparison

The Intel Core i7-10700 is a high-end desktop CPU based on the Comet Lake architecture. The CPU offers 8 cores and 16 threads clocked at 2.9 - 4.8 GHz. All cores can run at up to 4.6 GHz.

Compared to the older Core i7-9700, the 10700 now enables HyperThreading and therefore in some applications a nice performance boost. The single core performance is quite similar.

The chip is manufactured on 14nm++ process at Intel. The TDP is rated at 65 Watt (PL1) but the PL2 is set to 224 Watt for short term boosts (up to 28 seconds).

Apple S5

► remove from comparison Apple S5

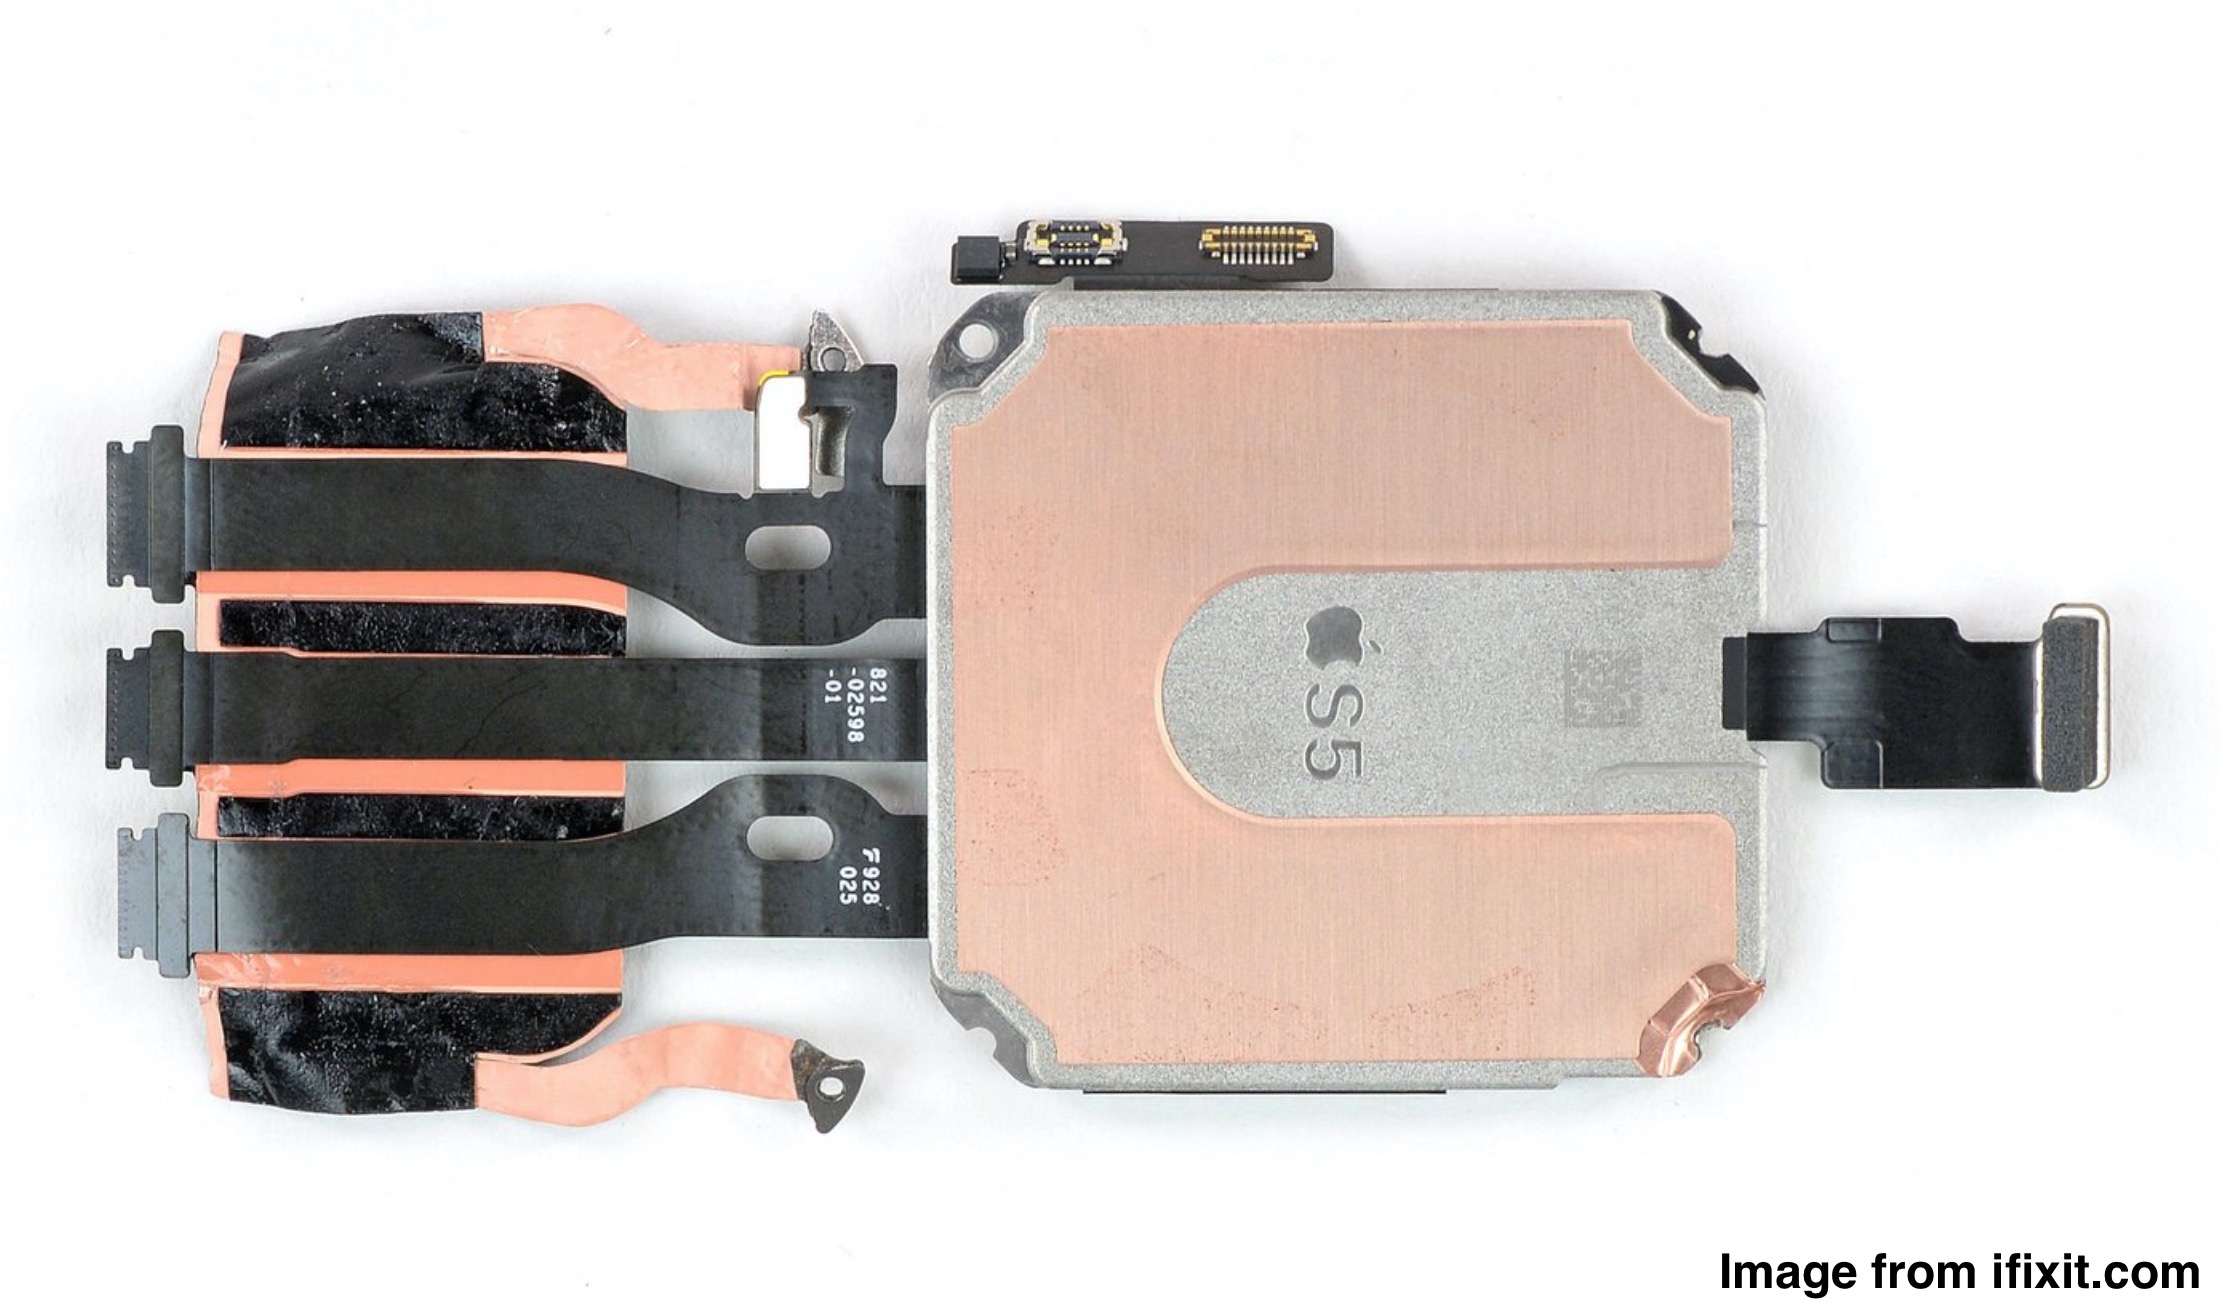
The Apple S5 is a 64-Bit dual core processor for the Apple Watch Series 5 (40 and 44mm). It integrates a GPU, 32 GB flash memory, Bluetooth 5.0, 1 GB RAM, 802.11 b/g/n 2.4 GHz WiFi and satellite positioning (GPS, GLONASS, Galileo, QZSS).

ModelUNISOC Tiger T310Intel Core i7-10700Apple S5
Clock1800 - 2000 MHz2900 - 4800 MHz
Cores / Threads4 / 48 / 162 / 2
Technology12 nm14 nm
FeaturesLTE Cat.7, BT 5.0, WiFi ac, GNSS, eMMC 5.1, LPDDR3 933, LPDDR4x 1333 MHzDDR4-2933 RAM, PCIe 3, 8 GT/s bus, vPro, MMX, SSE, SSE2, SSE3, SSSE3, SSE4.1, SSE4.2, AES, AVX, AVX2, FMA3
iGPUPowerVR GE8300 ( - 800 MHz)Intel UHD Graphics 630 (350 - 1200 MHz)
ArchitectureARMx86
Announced
Manufacturerwww.unisoc.comark.intel.com
CodenameComet Lake
SeriesIntel Comet Lake
Series: Comet Lake Comet Lake
Intel Core i9-10900K3.7 - 5.3 GHz10 / 20 cores20 MB L3
Intel Core i7-10700K3.8 - 5.1 GHz8 / 16 cores16 MB L3
Intel Core i7-10700 « 2.9 - 4.8 GHz8 / 16 cores16 MB L3
Intel Core i5-10600K4.1 - 4.8 GHz6 / 12 cores12 MB L3
Intel Core i5-10400F2.9 - 4.3 GHz6 / 12 cores12 MB L3
Intel Core i3-10100F3.6 - 4.3 GHz4 / 8 cores6 MB L3
L1 Cache512 KB
L2 Cache2 MB
L3 Cache16 MB
TDP65 Watt
max. Temp.100 °C
SocketLGA1200
$340 U.S.

Benchmarks

Cinebench R23 - Cinebench R23 Multi Core
8532 Points (8%)
Cinebench R23 - Cinebench R23 Single Core
1234 Points (52%)
Cinebench R15 - Cinebench R15 CPU Multi 64 Bit
1455 Points (9%)
Cinebench R15 - Cinebench R15 CPU Single 64 Bit
196 Points (54%)
Cinebench R11.5 - Cinebench R11.5 CPU Multi 64 Bit
16.7 Points (22%)
Cinebench R11.5 - Cinebench R11.5 CPU Single 64 Bit
2.3 Points (54%)
Cinebench R10 - Cinebench R10 Rend. Single (32bit)
7611 Points (46%)
Cinebench R10 - Cinebench R10 Rend. Multi (32bit)
41156 Points (30%)
Cinebench R10 - Cinebench R10 Rend. Multi (64bit)
52577 Points (34%)
Cinebench R10 - Cinebench R10 Rend. Single (64bit)
9898 Points (12%)
wPrime 2.10 - wPrime 2.0 1024m *
119.5 s (1%)
wPrime 2.10 - wPrime 2.0 32m *
3.3 s (1%)
WinRAR - WinRAR 4.0
6555 Points (10%)
7-Zip 18.03 - 7-Zip 18.03 Multi Thread 4 runs
43007 MIPS (25%)
7-Zip 18.03 - 7-Zip 18.03 Single Thread 4 runs
5293 MIPS (62%)
X264 HD Benchmark 4.0 - x264 Pass 2
84.8 fps (2%)
X264 HD Benchmark 4.0 - x264 Pass 1
236 fps (6%)
HWBOT x265 Benchmark v2.2 - HWBOT x265 4k Preset
11.6 fps (20%)
TrueCrypt - TrueCrypt Serpent
1.1 GB/s (32%)
TrueCrypt - TrueCrypt Twofish
1.8 GB/s (31%)
TrueCrypt - TrueCrypt AES
10.3 GB/s (27%)
Blender - Blender 2.79 BMW27 CPU *
315.4 Seconds (2%)
R Benchmark 2.5 - R Benchmark 2.5 *
0.6 sec (13%)
Super Pi mod 1.5 XS 1M - Super Pi mod 1.5 XS 1M *
8.1 s (2%)
Super Pi mod 1.5 XS 2M - Super Pi mod 1.5 XS 2M *
17.2 s (1%)
Super Pi Mod 1.5 XS 32M - Super Pi mod 1.5 XS 32M *
439.6 s (2%)
3DMark 11 - 3DM11 Performance Physics
15497 Points (38%)
3DMark - 3DMark Ice Storm Physics
62614 Points (51%)
3DMark - 3DMark Ice Storm Extreme Physics
62334 Points (51%)
3DMark - 3DMark Cloud Gate Physics
13579 Points (34%)
3DMark - 3DMark Fire Strike Standard Physics
20080 Points (36%)
3DMark - 3DMark Time Spy CPU
8580 Points (36%)
3DMark - 3DMark Sling Shot Extreme (ES 3.1) Unlimited Physics
100%
1 T310 +
1588 Points (15%)
3DMark - 3DMark Sling Shot (ES 3.0) Unlimited Physics
100%
1 T310 +
1590 Points (18%)
Geekbench 5.5 - Geekbench 5.1 - 5.5 64 Bit Single-Core
100%
1 T310 +
376 Points (15%)
1299 Points (51%)
Geekbench 5.5 - Geekbench 5.1 - 5.5 64 Bit Multi-Core
100%
1 T310 +
756 Points (1%)
1081%
1 i7-10700 +
8173 Points (15%)
Geekbench 5.0 - Geekbench 5.0 64 Bit Single-Core
1304 Points (6%)
Geekbench 5.0 - Geekbench 5.0 64 Bit Multi-Core
8196 Points (26%)
Geekbench 4.4 - Geekbench 4.1 - 4.4 64 Bit Single-Core
100%
1 T310 +
1687 Points (17%)
5726 Points (57%)
Geekbench 4.4 - Geekbench 4.1 - 4.4 64 Bit Multi-Core
100%
1 T310 +
2969 Points (3%)
1084%
1 i7-10700 +
32174 Points (32%)
Geekbench 3 - Geekbench 3 64 Bit Multi-Core
100%
1 T310 +
2987 Points (5%)
Geekbench 3 - Geekbench 3 64 Bit Single-Core
100%
1 T310 +
1656 Points (25%)
Mozilla Kraken 1.1 - Kraken 1.1 Total Score *
100%
1 T310 +
3239 ms (4%)
752 ms (1%)
Sunspider - Sunspider 1.0 Total Score *
100%
1 S5 +
min: 2014     avg: 2022     median: 2022 (22%)     max: 2030 ms
Octane V2 - Octane V2 Total Score
100%
1 T310 +
11986 Points (9%)
WebXPRT 4 - WebXPRT 4 Score
100%
1 T310 +
45 Points (12%)
WebXPRT 3 - WebXPRT 3 Score
100%
1 T310 +
63 Points (11%)
244 Points (44%)
Antutu v9 - AnTuTu v9 Total Score
100%
1 T310 +
162595 Points (8%)
Antutu v9 - AnTuTu v9 CPU
100%
1 T310 +
57138 Points (14%)
PassMark PerformanceTest Mobile V1 - PerformanceTest Mobile V1 CPU Tests
100%
1 T310 +
1653 Points (0%)
PCMark for Android - PCM f. Android Storage 2.0 score
100%
1 T310 +
9900 Points (4%)
PCMark for Android - PCM f. Android Work Score 3.0
100%
1 T310 +
6866 Points (25%)
Power Consumption - Prime95 Power Consumption - external Monitor *
116.3 Watt (20%)
Power Consumption - Cinebench R15 Multi Power Consumption - external Monitor *
148 Watt (27%)
Power Consumption - Geekbench 5.5 Power Consumption 150cd *
100%
1 T310 +
3.7 Watt (2%)
Power Consumption - Idle Power Consumption 150cd 1min *
100%
1 T310 +
1.6 Watt (2%)
Power Consumption - Power Efficiency - Cinebench R15 Multi external Monitor
9.8 Points per Watt (7%)

Average Benchmarks UNISOC Tiger T310 → 0% n=0

Average Benchmarks Intel Core i7-10700 → 0% n=0

Average Benchmarks Apple S5 → 0% n=0

- Range of benchmark values for this graphics card
red legend - Average benchmark values for this graphics card
* Smaller numbers mean a higher performance
1 This benchmark is not used for the average calculation

v1.33
log 13. 14:31:41

#0 ran 0s before starting gpusingle class +0s ... 0s

#1 checking url part for id 14530 +0s ... 0s

#2 checking url part for id 13214 +0s ... 0s

#3 checking url part for id 11530 +0s ... 0s

#4 redirected to Ajax server, took 1757766701s time from redirect:0 +0s ... 0s

#5 did not recreate cache, as it is less than 5 days old! Created at Sat, 13 Sep 2025 14:08:46 +0200 +0s ... 0s

#6 composed specs +0.004s ... 0.004s

#7 did output specs +0s ... 0.004s

#8 getting avg benchmarks for device 14530 +0.001s ... 0.005s

#9 got single benchmarks 14530 +0.005s ... 0.01s

#10 getting avg benchmarks for device 13214 +0.001s ... 0.01s

#11 got single benchmarks 13214 +0.005s ... 0.015s

#12 getting avg benchmarks for device 11530 +0.001s ... 0.016s

#13 got single benchmarks 11530 +0.004s ... 0.019s

#14 got avg benchmarks for devices +0s ... 0.019s

#15 min, max, avg, median took s +0.024s ... 0.044s

#16 return log +0s ... 0.044s

Please share our article, every link counts!
Mail Logo
> Expert Reviews and News on Laptops, Smartphones and Tech Innovations > Benchmarks / Tech > Processor Comparison - Head 2 Head
Redaktion, 2017-09- 8 (Update: 2023-07- 1)