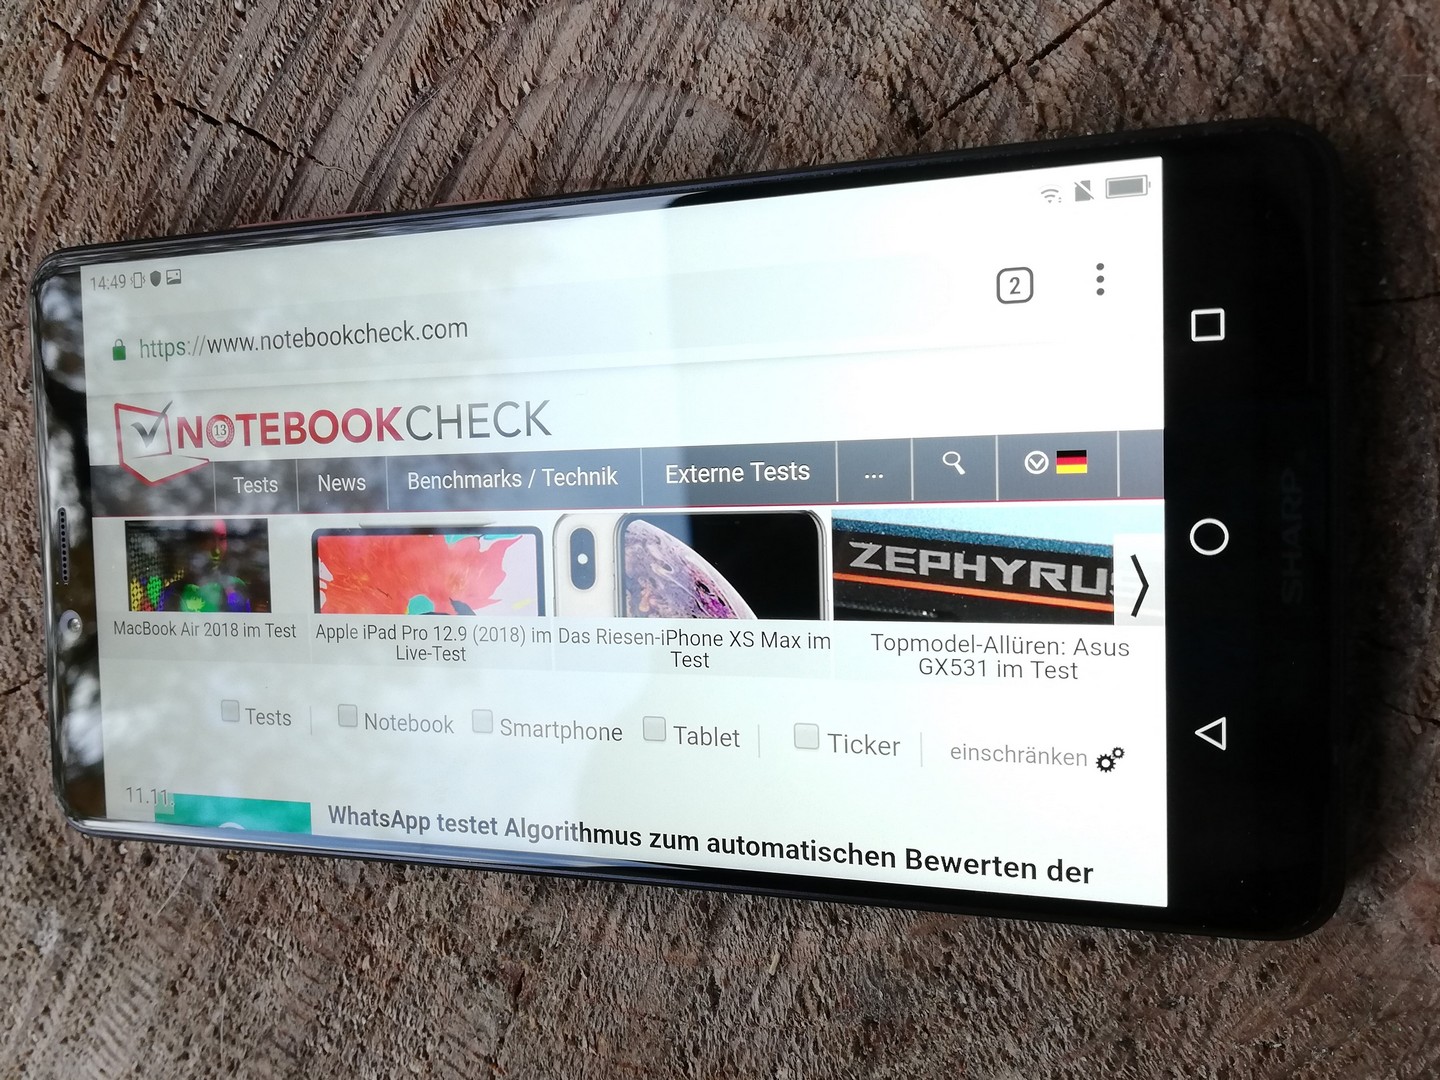
Sharp Aquos D10 Smartphone Review

Sharp has secured a solid place in the mid-range smartphone market having returned to the West with the B10 and the Aquos C10. Its new device, the Aquos D10, subtly improves upon its predecessors while still being a solid mid-range smartphone.
The company has equipped the D10 with a Qualcomm Snapdragon 630 SoC, just like it did with the C10. The Snapdragon 630 integrates a Qualcomm Adreno 508 GPU and is complemented by 4 GB RAM and 64 GB of eMMC flash storage. The practically bezel-free design is one of the D10’s highlights just like with the C10. Sharp has designed the D10 with a wider notch than its predecessor though while reducing the size of the bottom bezel.
We have chosen to compare the D10 against its predecessor and also with other mid-range Android smartphones, including the ASUS ZenFone 5, the LG Q7 Plus and the Sony Xperia XA2 Plus.
Case
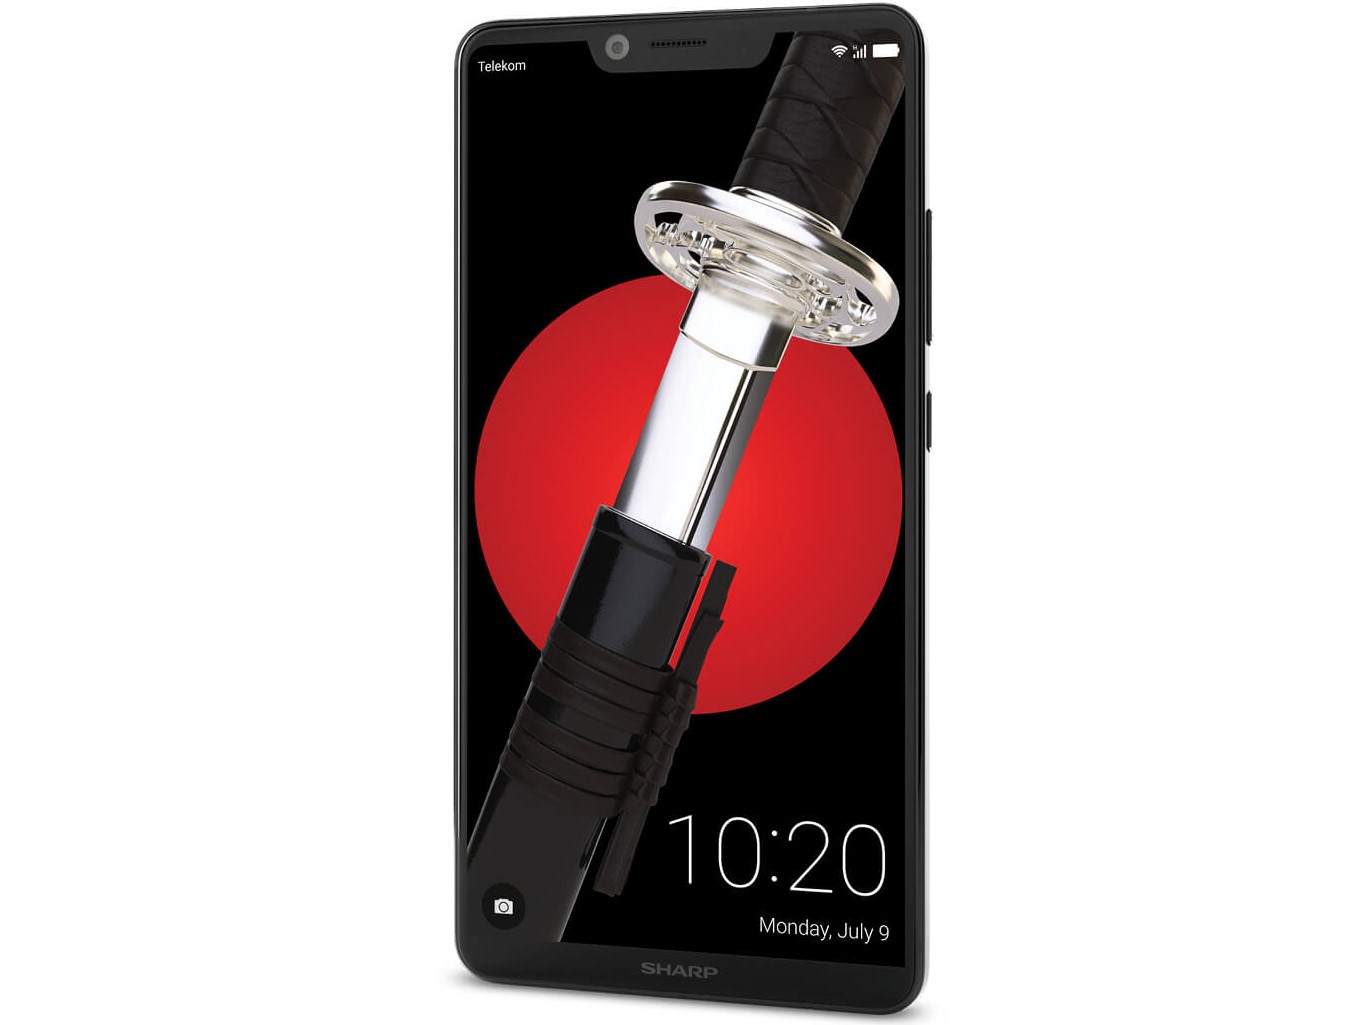
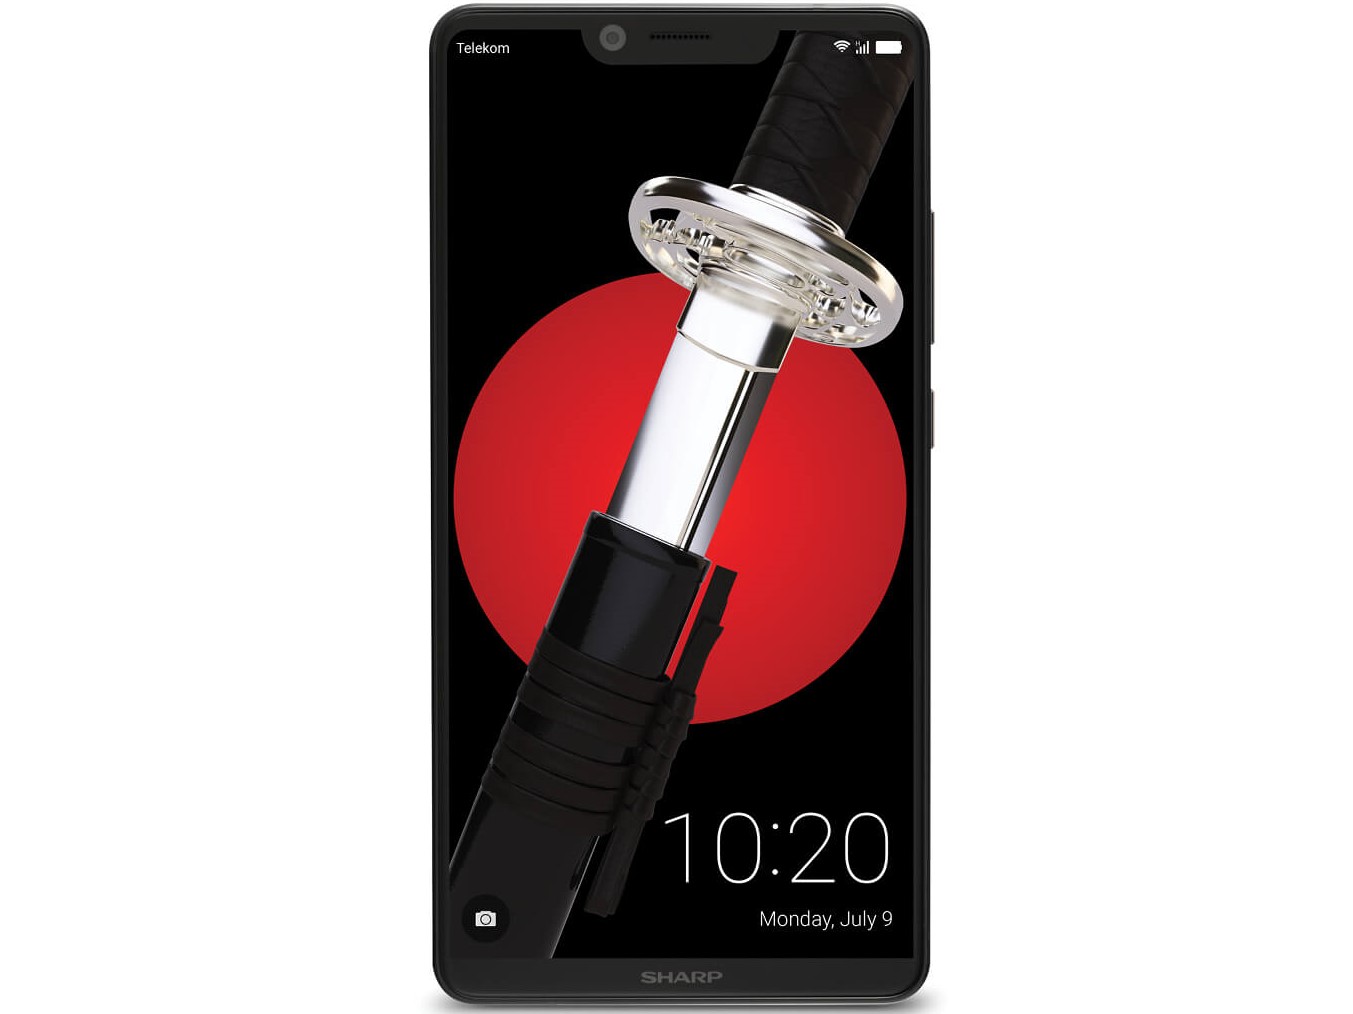
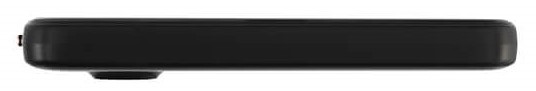
The D10 has a solid metal frame and a glass back. The front is covered in Corning Gorilla Glass 3, behind which sits a 5.99-inch display that has a 91% screen-to-body ratio. The D10 is practically bezel-free besides its noticeable notch, while its chamfered edges provide a smooth transition between the display and the frame. The device has defined edges too, but this is not a drawback in our opinion.
The D10 has a noticeably smaller bottom bezel than its predecessor but Sharp has equipped the device with a wider notch. The D10 also has a 0.4-inch larger display, but it has a larger footprint too. Our test device weighs 165 g, which is heavier than all but the Xperia XA2 Plus of our comparison devices.
Connectivity
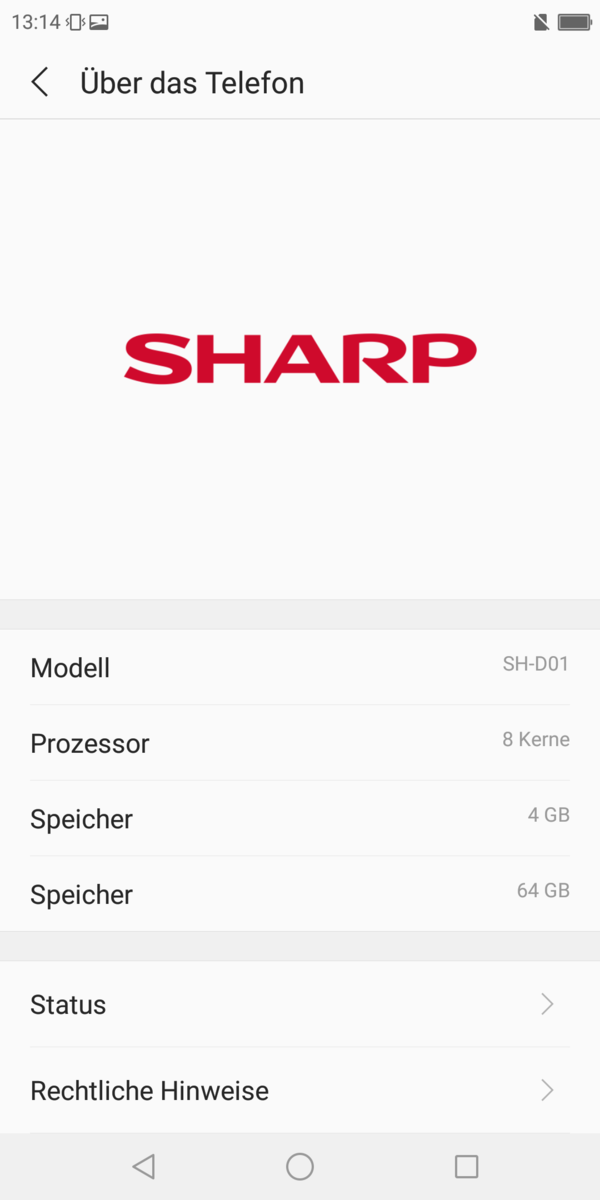
Sharp has equipped the D10 with a Qualcomm Snapdragon 630, a mid-range SoC that integrates an Adreno 508 GPU. These components are complemented by 4 GB RAM and 64 GB of eMMC flash storage. There is a USB 2.0 Type-C port on the bottom of the device for charging and wired data transfer, which also supports USB On-The-Go (OTG) functions.
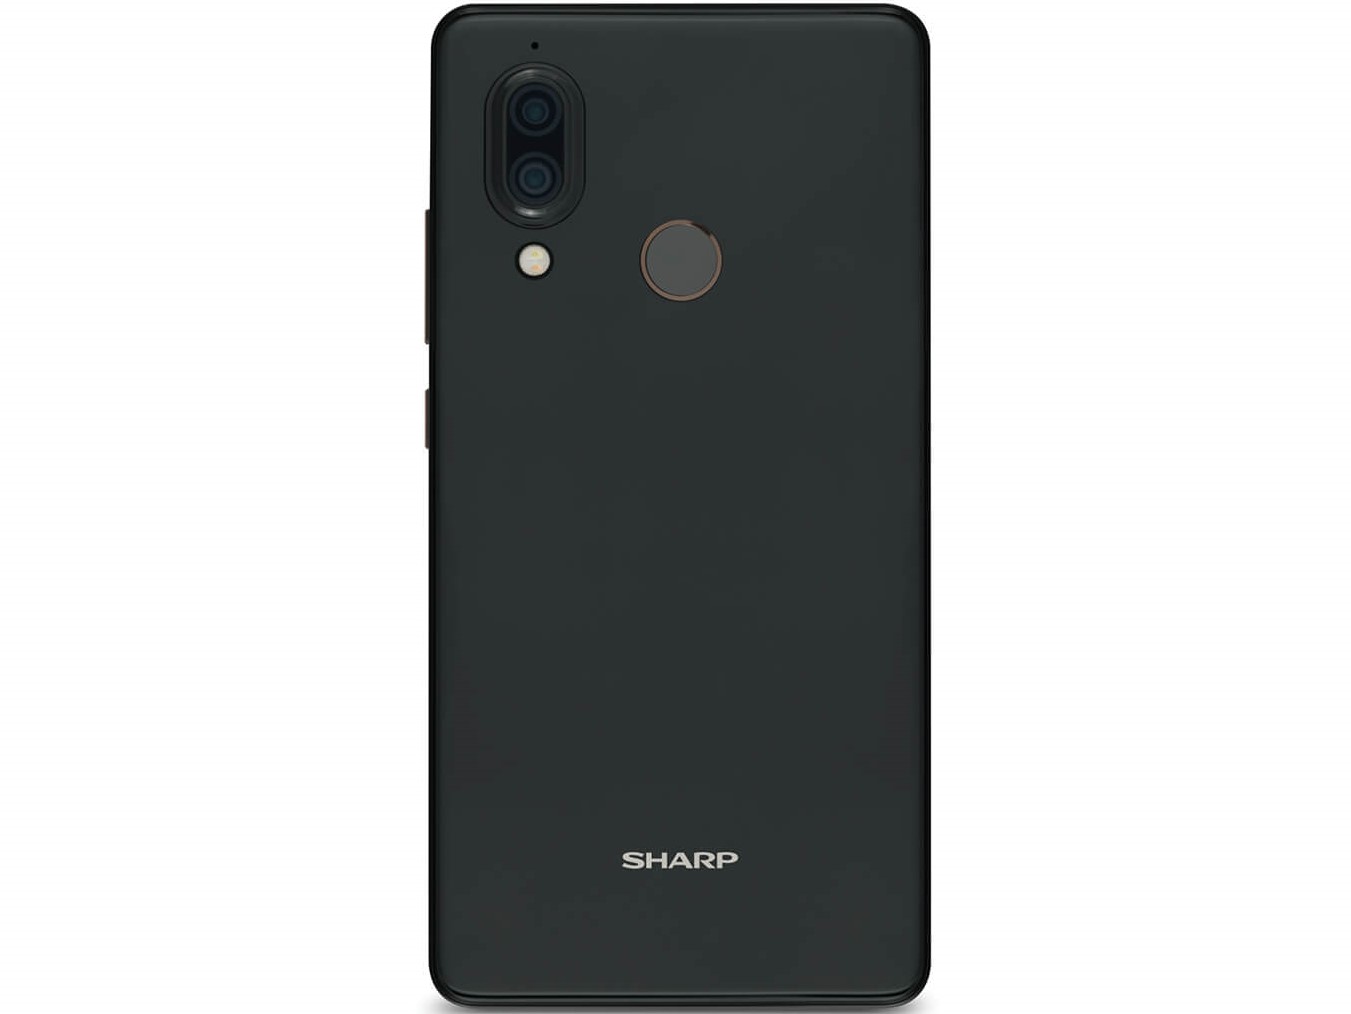
The D10 has a fingerprint sensor, an NFC chip and dual SIM support too. The card tray has two slots, one of which supports either a microSD card or a second nano-SIM. The D10 can format up to 128 GB microSD cards but adding a card limits users to only single SIM functionality. The device can only format microSD cards as external storage too, so apps and data can only be stored on the 64 GB of internal storage.
Software
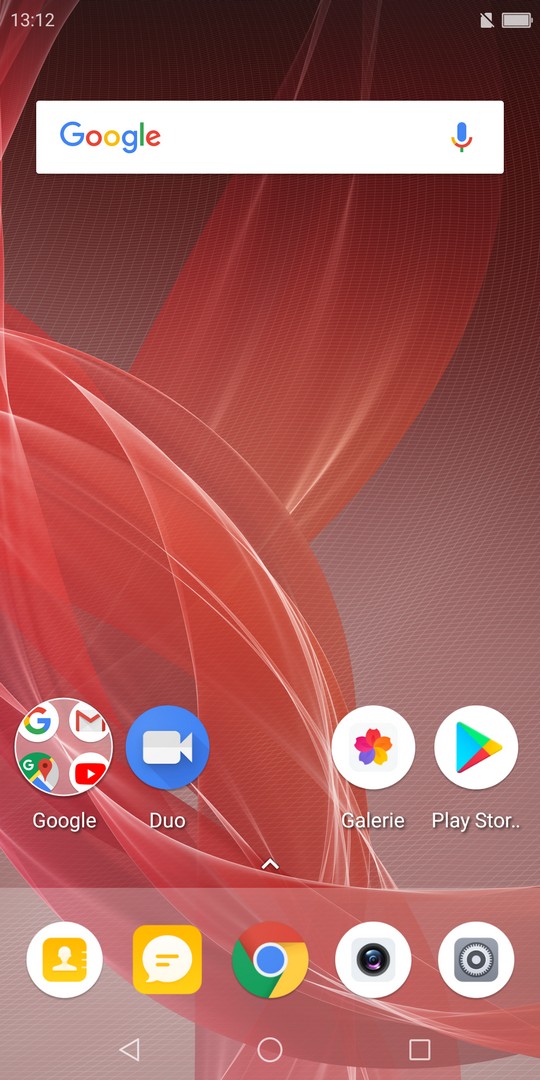
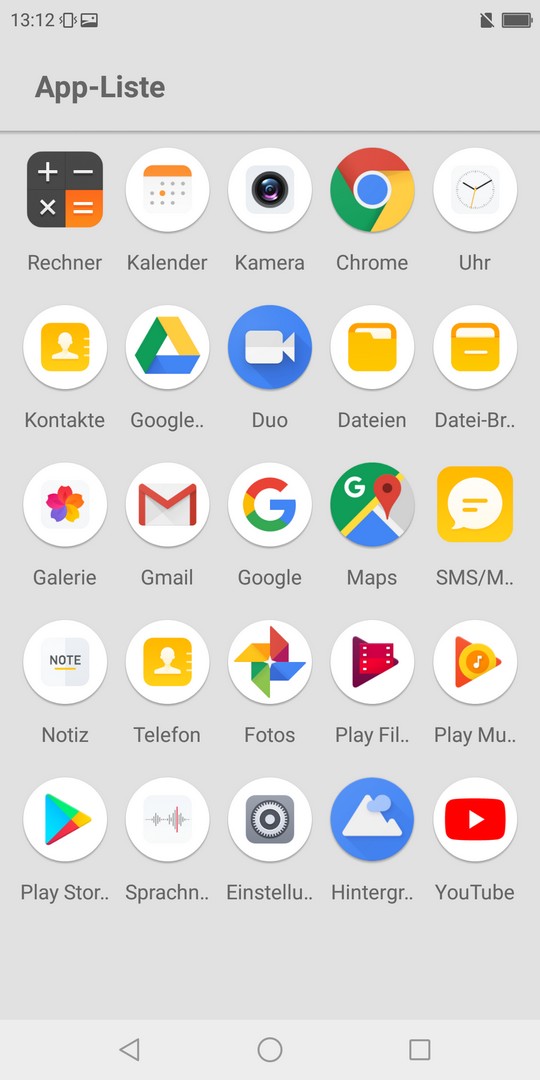
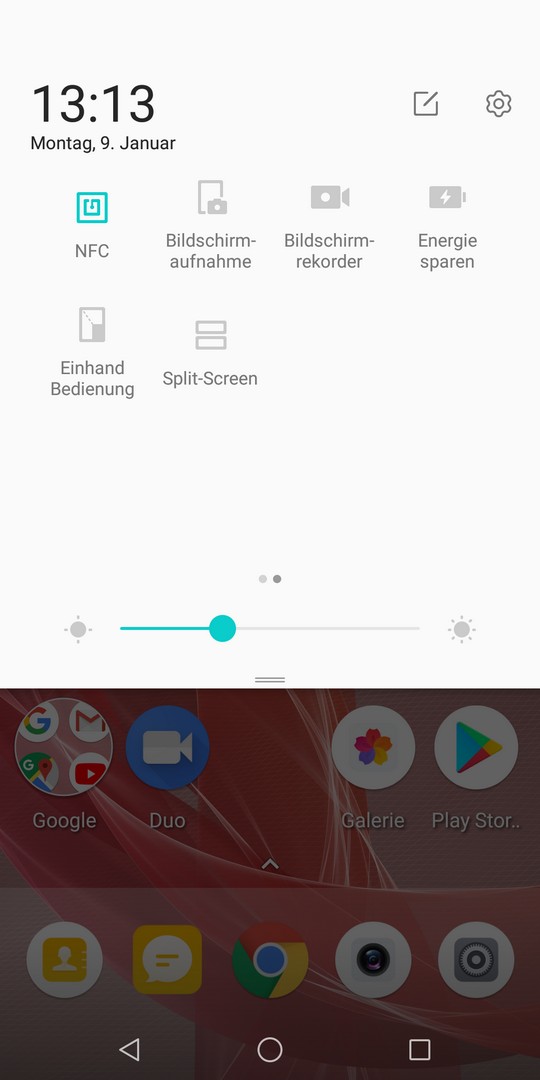
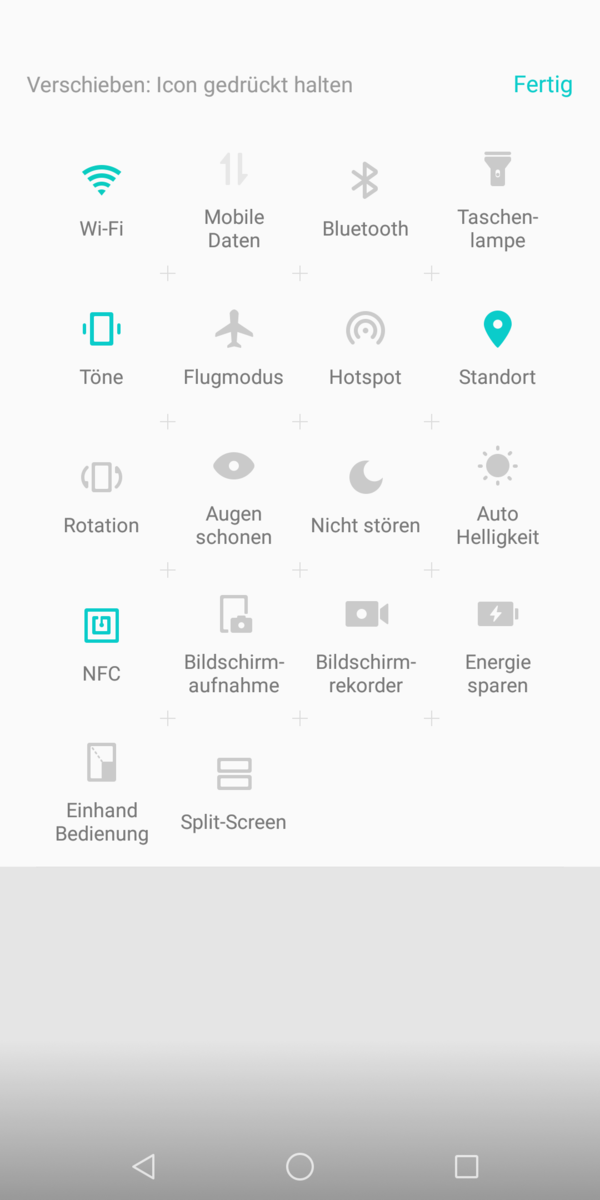
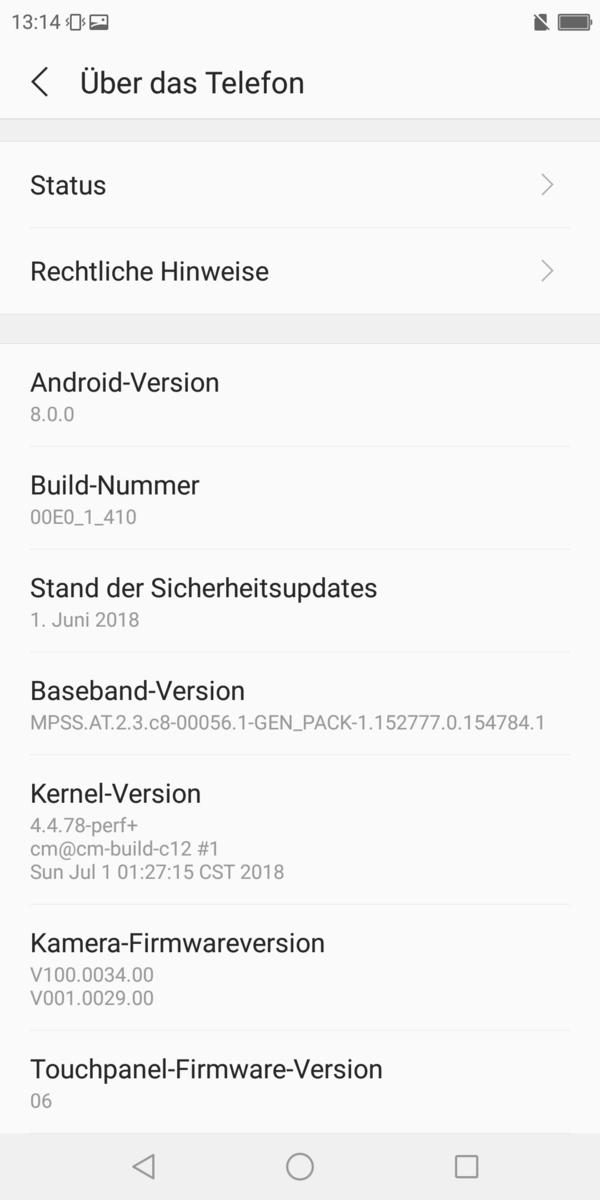
The D10 ships with Android 8.0 Oreo at the time of writing, while our test device arrived with June 1, 2018, Android Security patches installed. Sharp has overlaid its SharpUI atop of Android Oreo, which mainly makes cosmetic changes from stock Android. The only preinstalled applications are Google ones, besides the calculator, calendar, camera and phone apps among other essential apps. The default launcher sorts apps by name in a grid, which should be easy to use even for newcomers to Android.
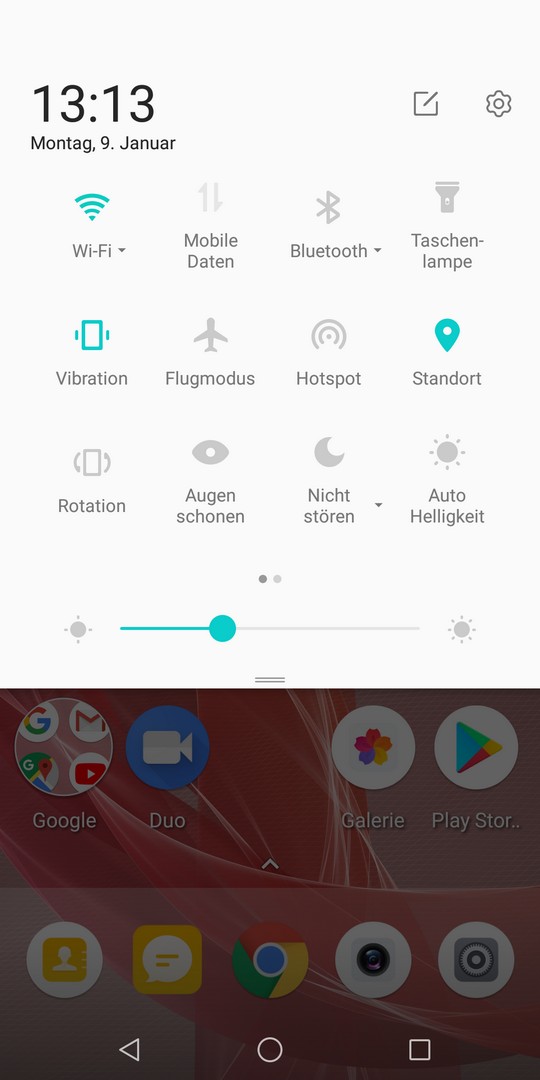
Our test device has multi-user account controls if multiple people need to use the device. The D10 can also connect to wired peripherals via USB Type-C or an appropriate adapter thanks to OTG support.

Communication & GPS
The D10 supports GSM, 3G and LTE networks. The device uses LTE Cat.4 to achieve up to 150 Mb/s download and 50 Mb/s upload speed.
The device also has an NFC chip, Bluetooth 4.0 and supports all modern Wi-Fi standards up to IEEE 802.11 ac, which means that the D10 can connect to 2.4 GHz or 5 GHz Wi-Fi networks. Our test device achieves 336 Mb/s in the iperf3 Client (receive) Wi-Fi test, which is much faster than average and around 10% faster than our quickest comparison devices. However, the D10 averages around 163 Mb/s in the transmission test, which is around 20% slower than the class average and around 50% slower than our fastest comparison devices. It is noticeably quicker than the LG Q7 Plus though.
| Networking | |
| iperf3 transmit AX12 | |
| Asus ZenFone 5Z ZS620KL | |
| Sony Xperia XA2 Plus | |
| Sharp Aquos C10 | |
| Sharp D10 | |
| LG Q7 Plus | |
| iperf3 receive AX12 | |
| Asus ZenFone 5Z ZS620KL | |
| Sharp D10 | |
| Sony Xperia XA2 Plus | |
| Sharp Aquos C10 | |
| LG Q7 Plus | |

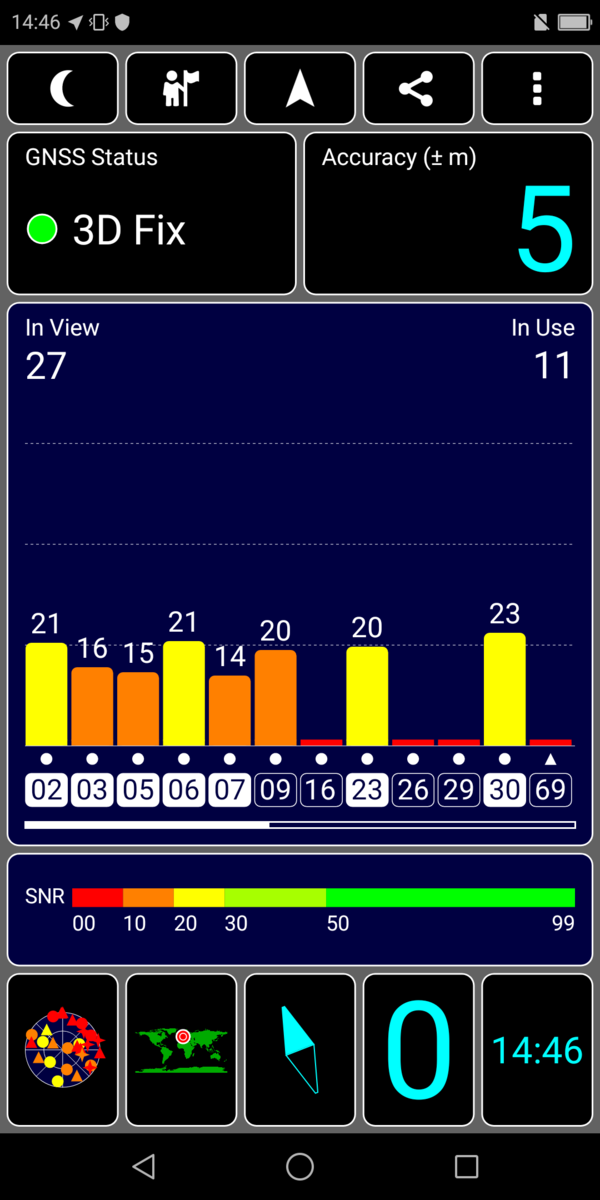
The D10 uses A-GPS, Galileo and GLONASS for location services, the accuracy of which we tested using the GPS Test. Our test device can find our location with up to three metres accuracy outside, and up to five metres when tested inside. The latter is rather impressive given that not all smartphones have managed to find our location indoors in our tests.
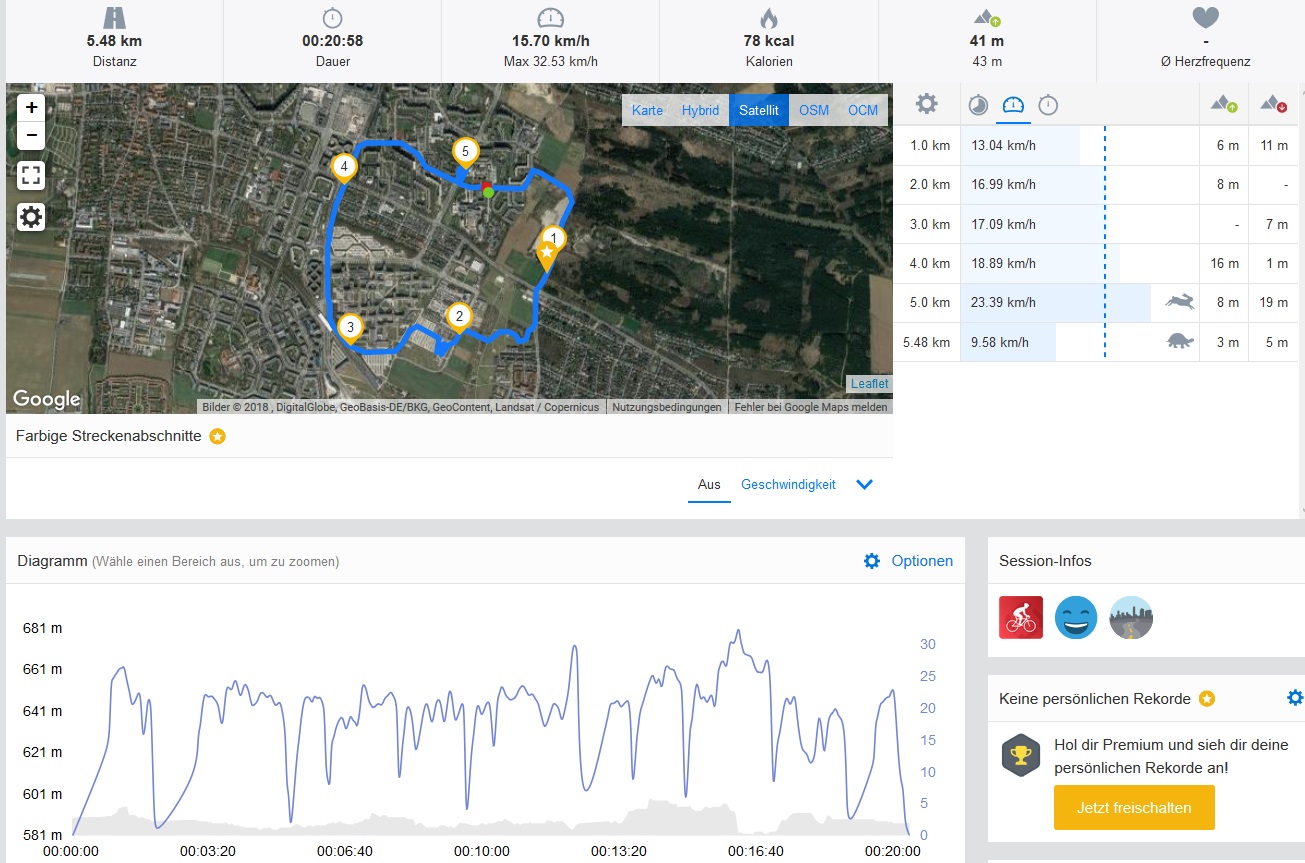
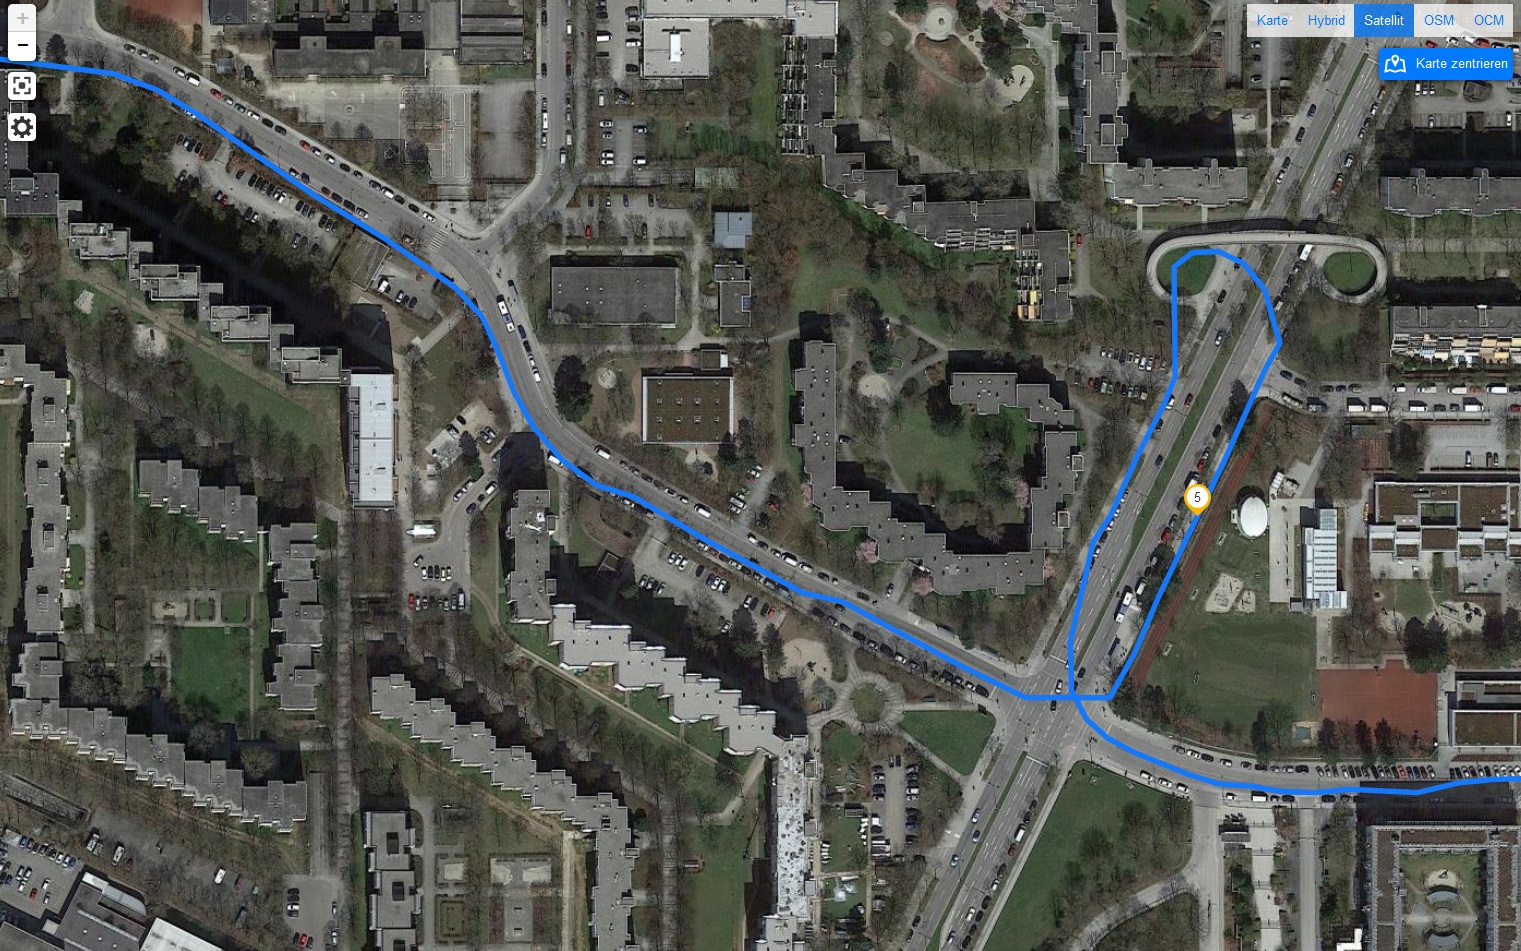
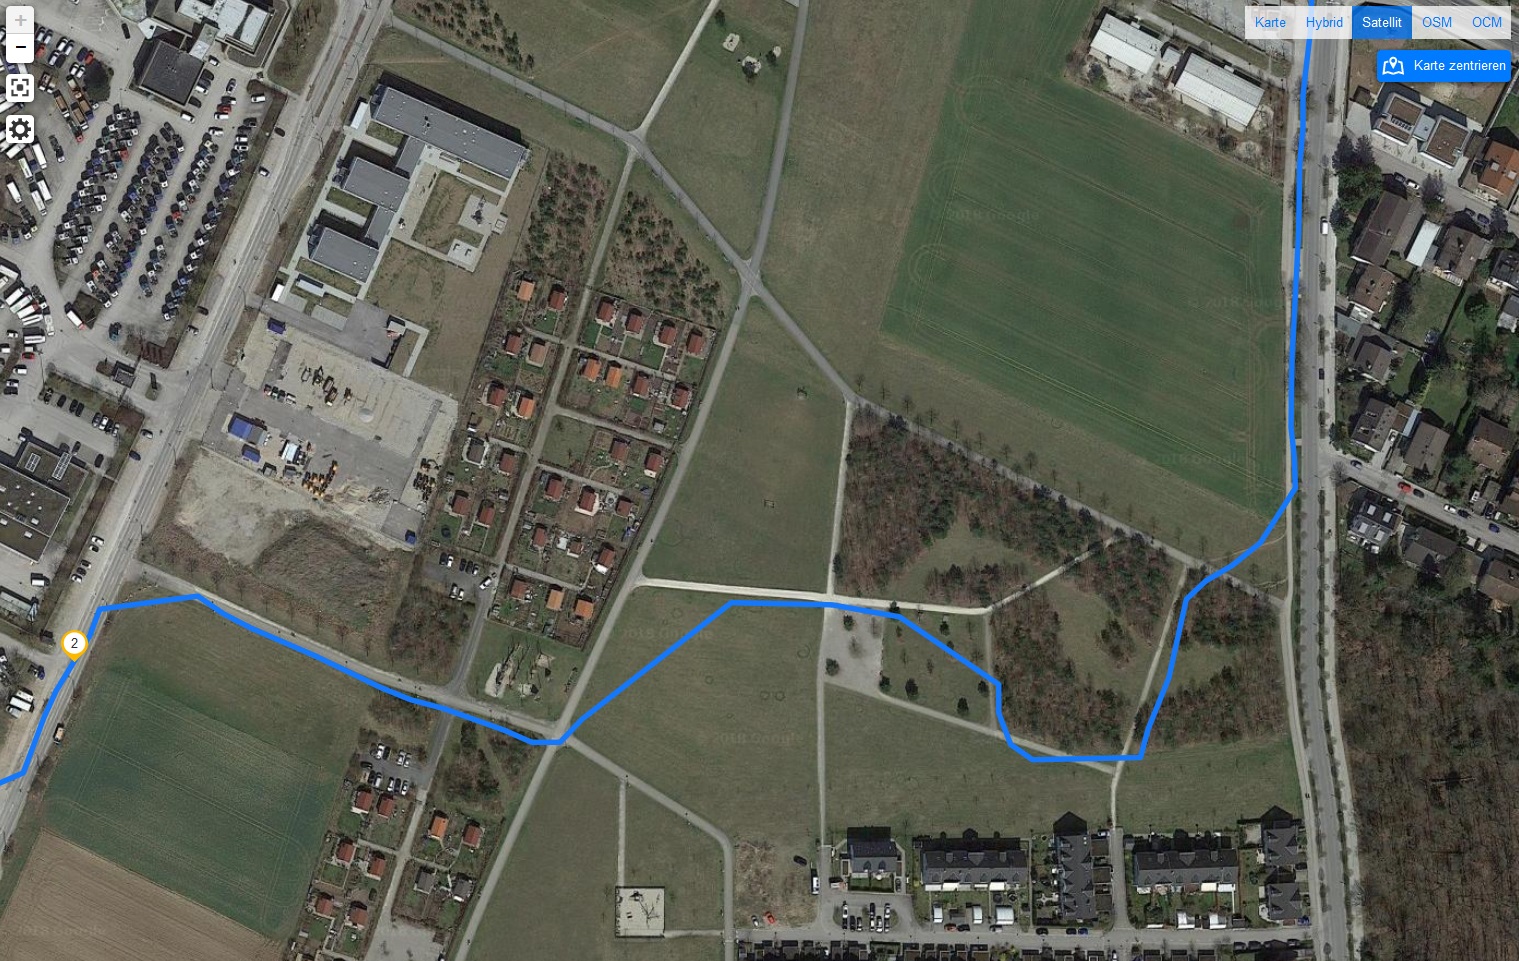
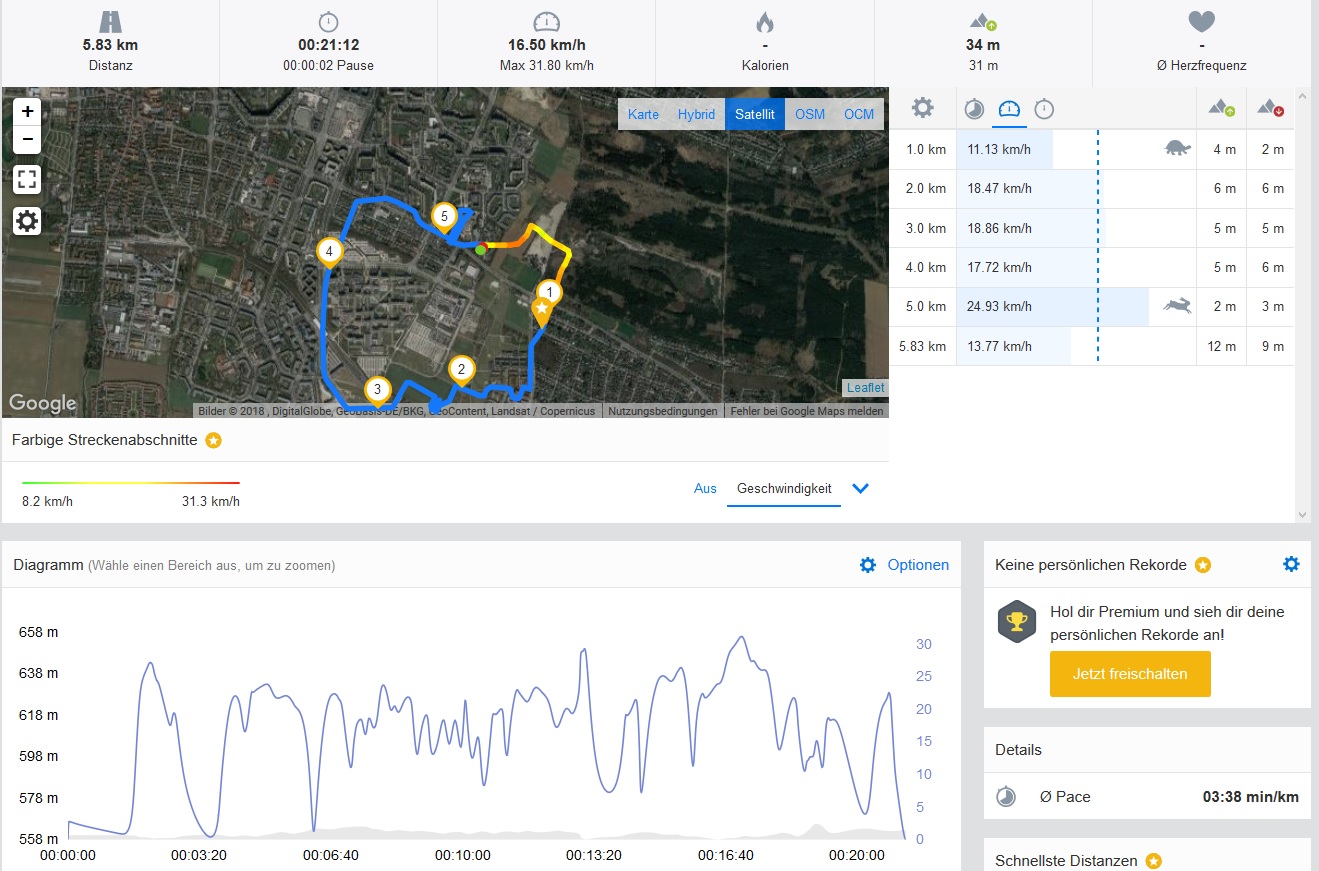
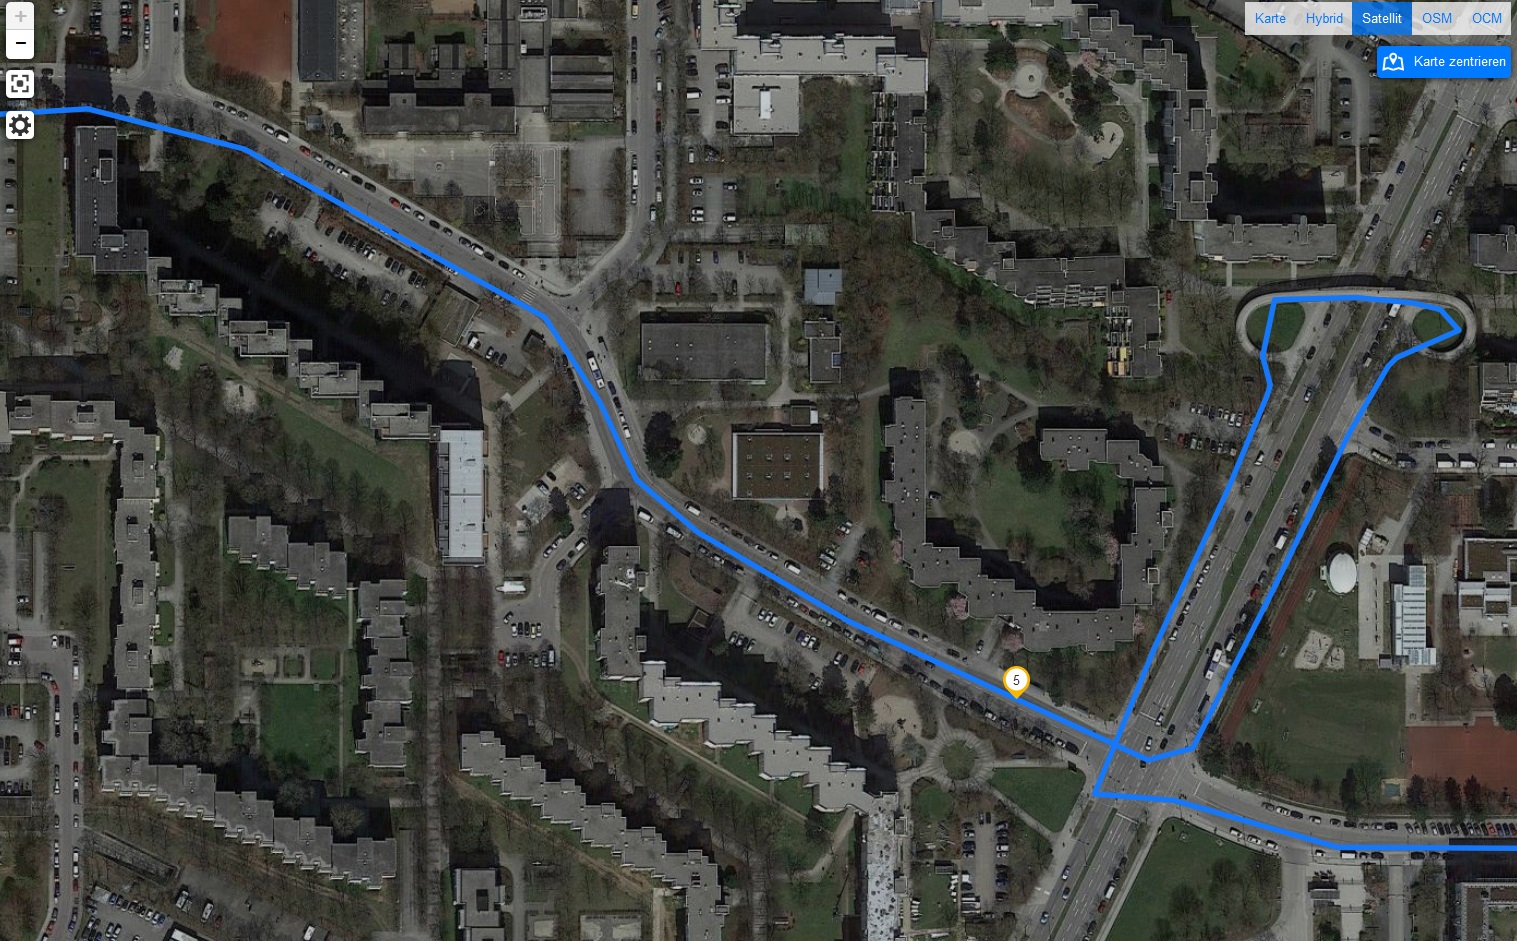
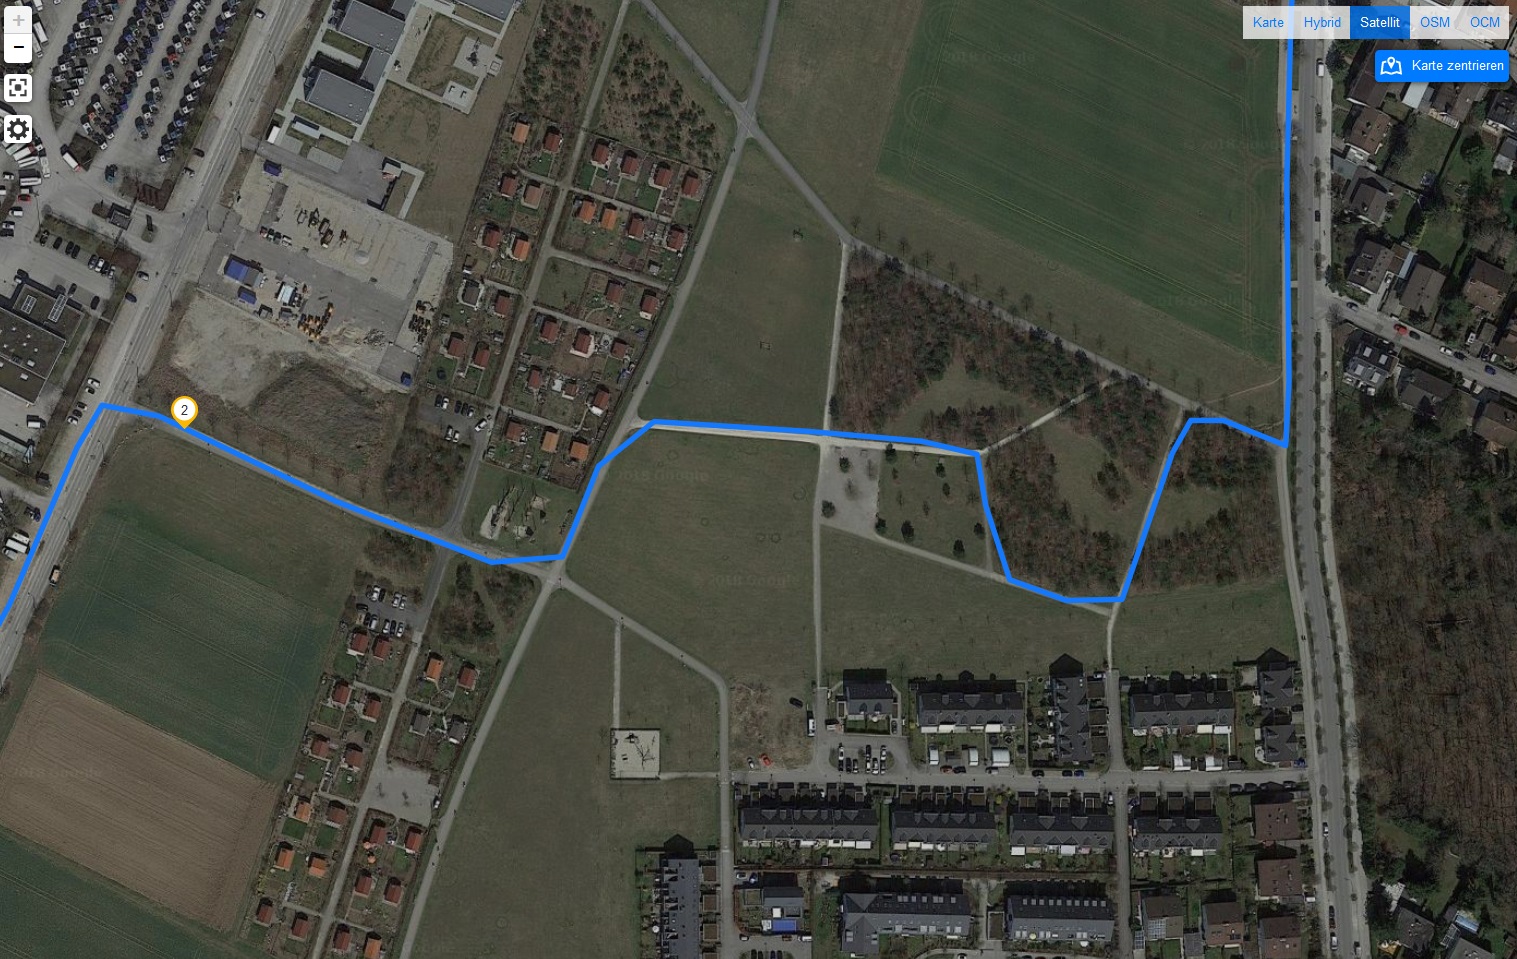
We also took the D10 on our compulsory bike ride to test its navigation accuracy against the Garmin Edge 520, a professional navigation system. Our test device recorded a 350-metre (1,177 feet) shorter course than the Garmin did, which is okay and it represents 93.9% accuracy. Moreover, the D10 tracked us along straight portions of our test ride accurately, but our test device could not keep up with us in corners, during which it regularly takes shortcuts. Overall, the D10 is accurate enough for simple navigation tasks, but it is not good enough for instances where you need precise GPS tracking or location data.
Telephone Features & Call Quality
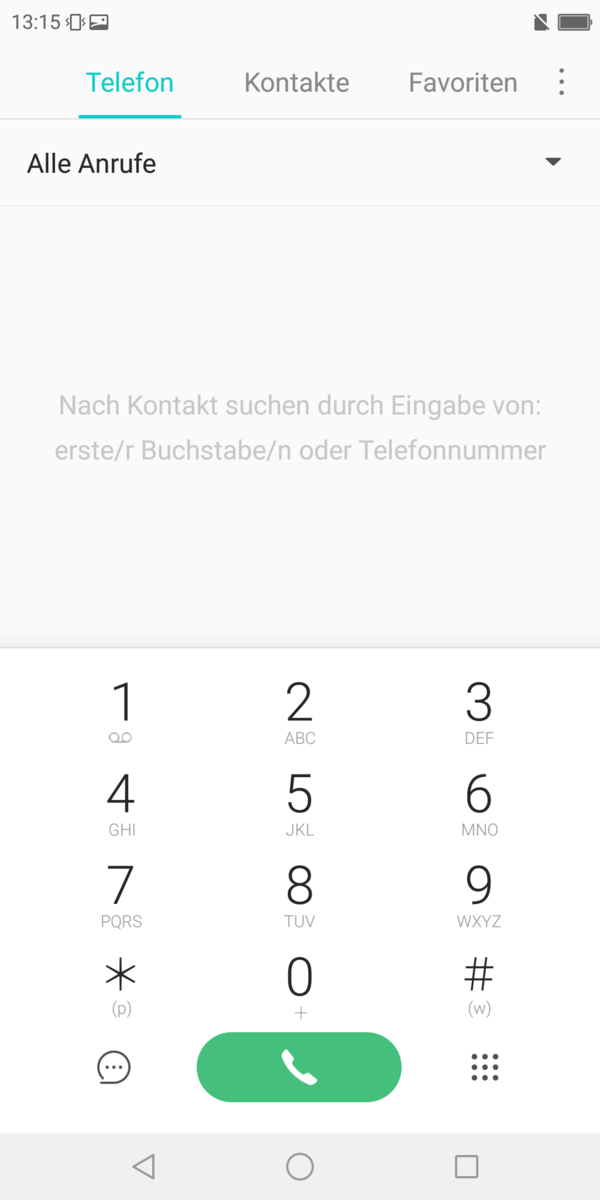
The default phone app provides direct access to the number pad upon opening the app. There are also tabs for Contacts and Favourites should you have favourited contacts. Call quality is good overall, but it deteriorates when making calls at high volumes. Worse still, the maximum call volume is comparatively quiet, which makes calling from noisy environments tricky. The microphone reliably filters out background noise though.
Sharp has included a USB Type-C to 3.5 mm jack adapter in the box, which users could use to connect headphones to the device when making or receiving calls. Our test device did not come with any headphones.
Cameras

The D10 has a 16 MP front-facing camera and dual 12 MP/13 MP rear-facing sensors. The former takes good quality photos, although Sharp has enabled a beautification mode by default that softens the entire image. Photos still look good with this mode disabled even though fine structures are not delineated well. Colours also look too pale for our liking. The default camera mode has a professional mode, which allows users to manually adjust contrast, ISO, lighting and white balance.
The main camera also takes decent photos, but colour transitions tend to look faded when looking at photos in detail. The sensors separate defined objects well, but they struggle with uneven objects like leaves on a tree, which often blend into each other. Photos also generally are too dark for our liking, which particularly becomes an issue when taking pictures in shady areas. Macro shots have bolder colours though and look good overall. However, the rear-facing sensors struggle with transitions between colours when using the electronic zoom. Objects are clearly made out in low-light pictures though, although parts of the image are noticeably underexposed and there is plenty of image noise. The professional mode works with the rear-facing cameras too, while there are also options to adjust focus and the shutter speed.
Sharp has also included optical zoom that theoretically allows users to get closer to objects without compromising on image quality. Unfortunately, this only works at 2 x optical zoom, beyond which photos are dominated by coarse image noise.
Videos shot on the D10 are of a similar quality to photos, but users can only choose between normal and time-lapse recordings. There is no way to manually adjust the image before recording a video. The rear-facing sensors also lack optical image stabilisation (OIS), so buyers will need a steady hand to record smooth looking video.


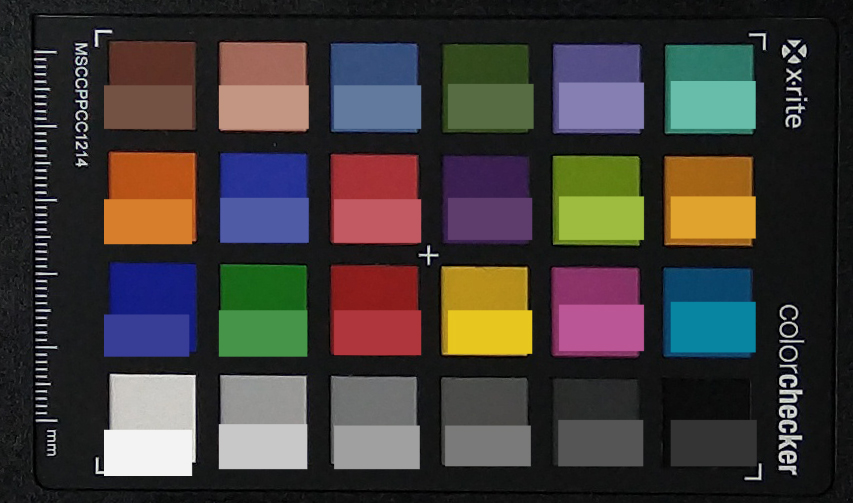
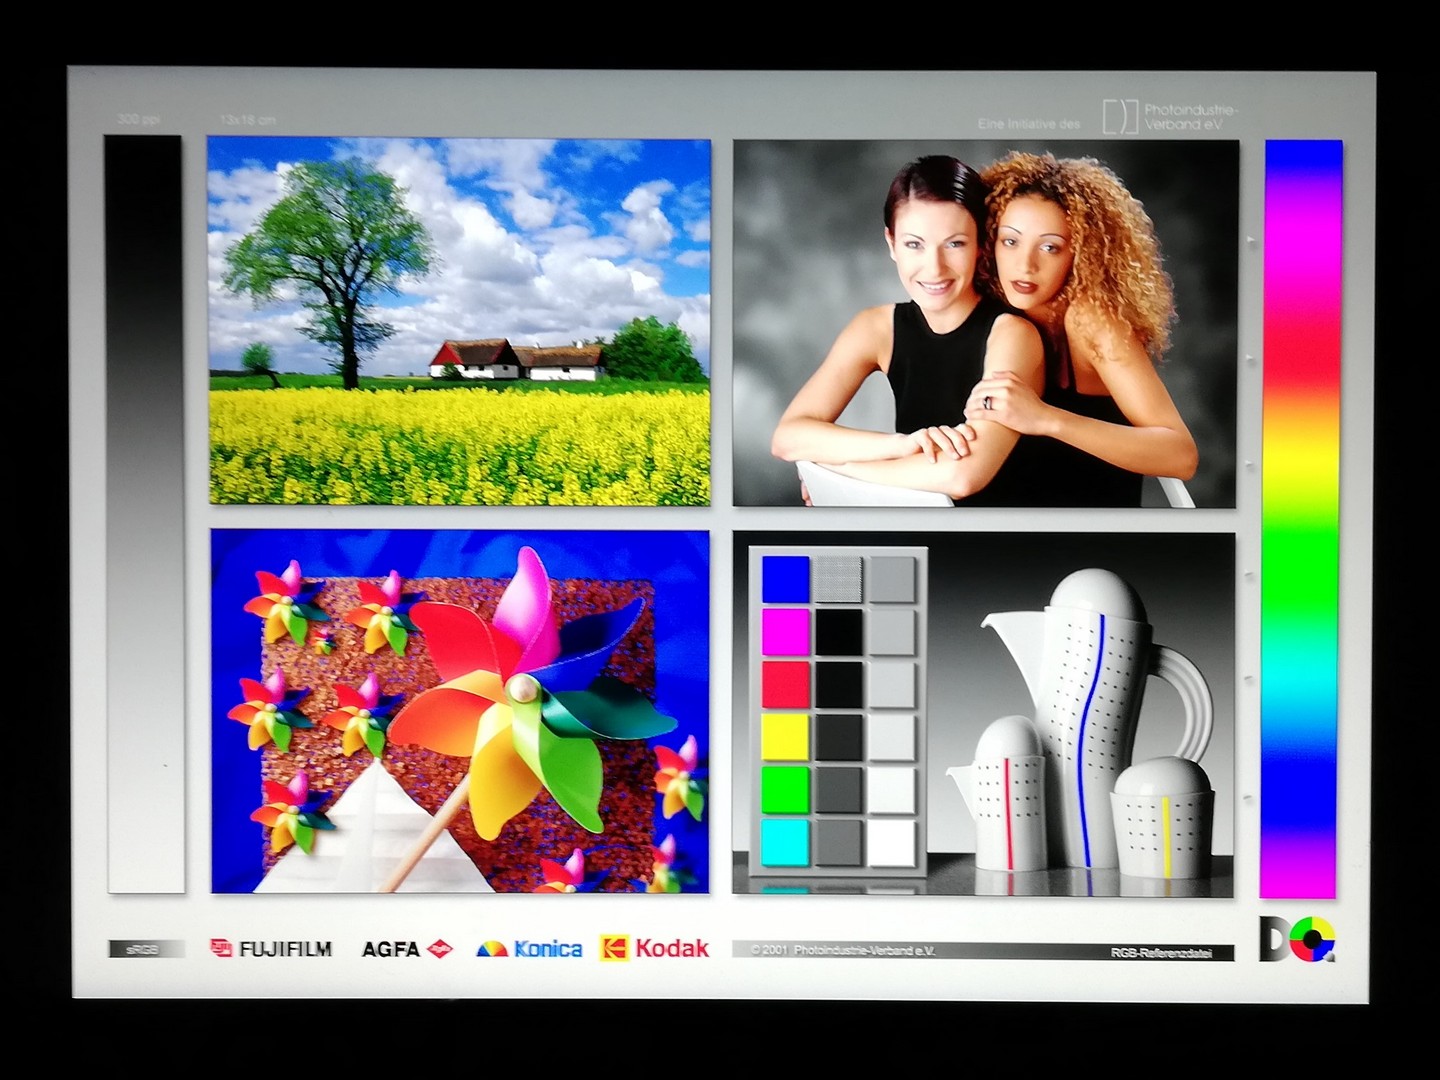
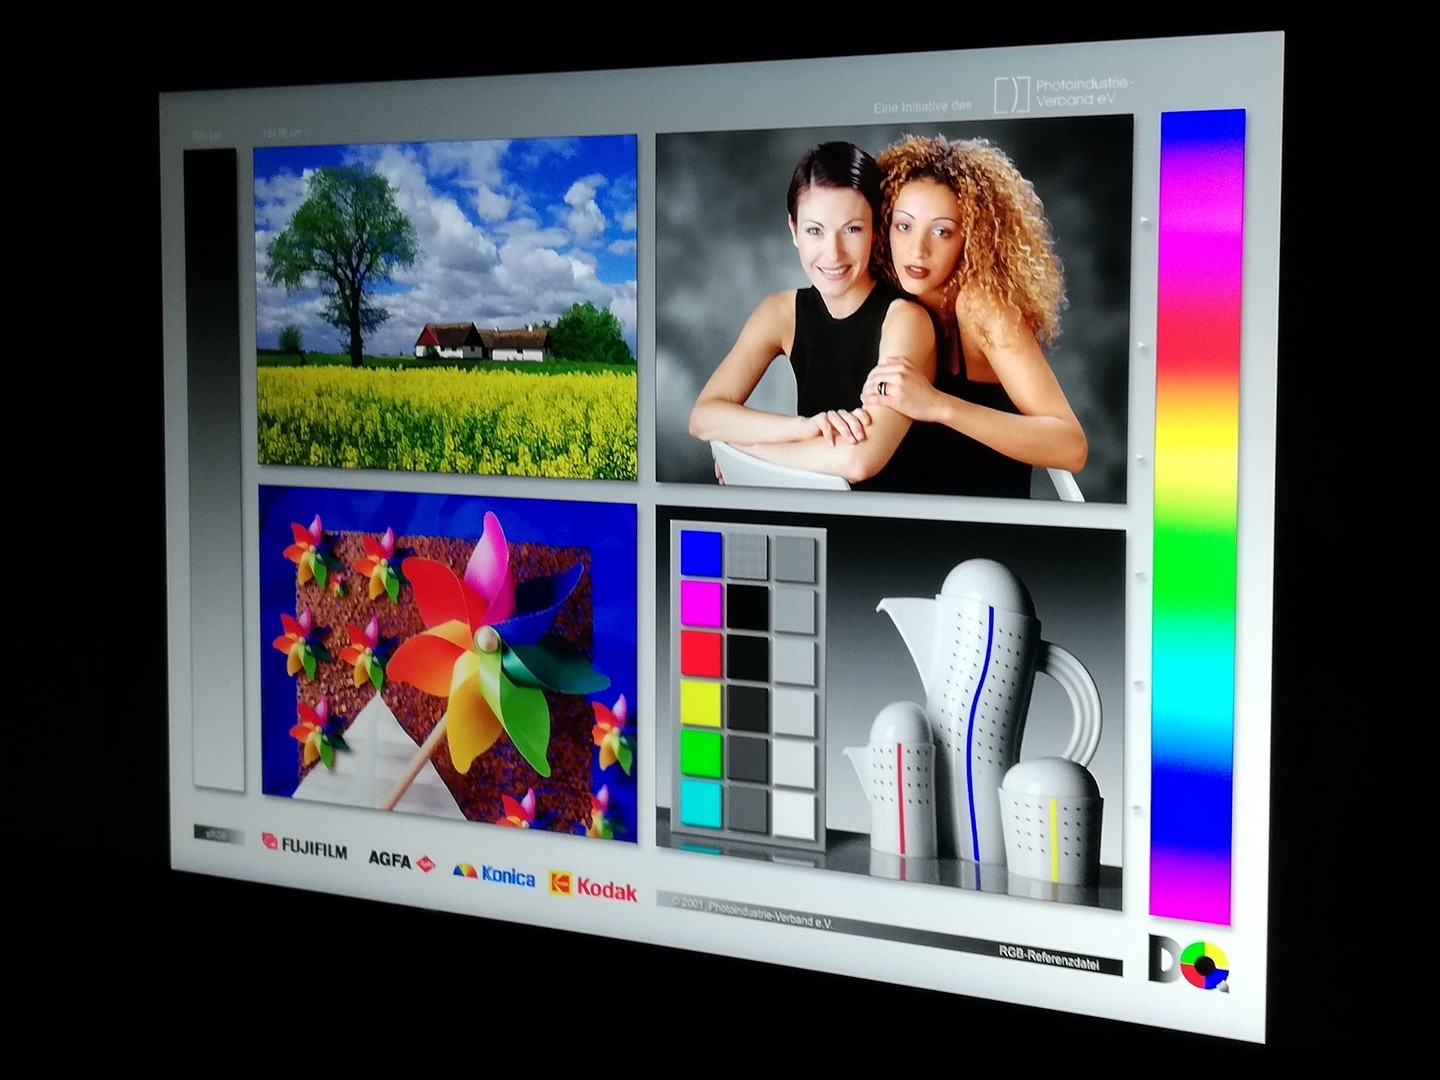
We also checked the main camera’s colour accuracy with ColorChecker Passport. As demonstrated by the chart below, our test device reproduces colours too darkly compared to the reference colour. This colour reproduction particularly affects black and grey tones.
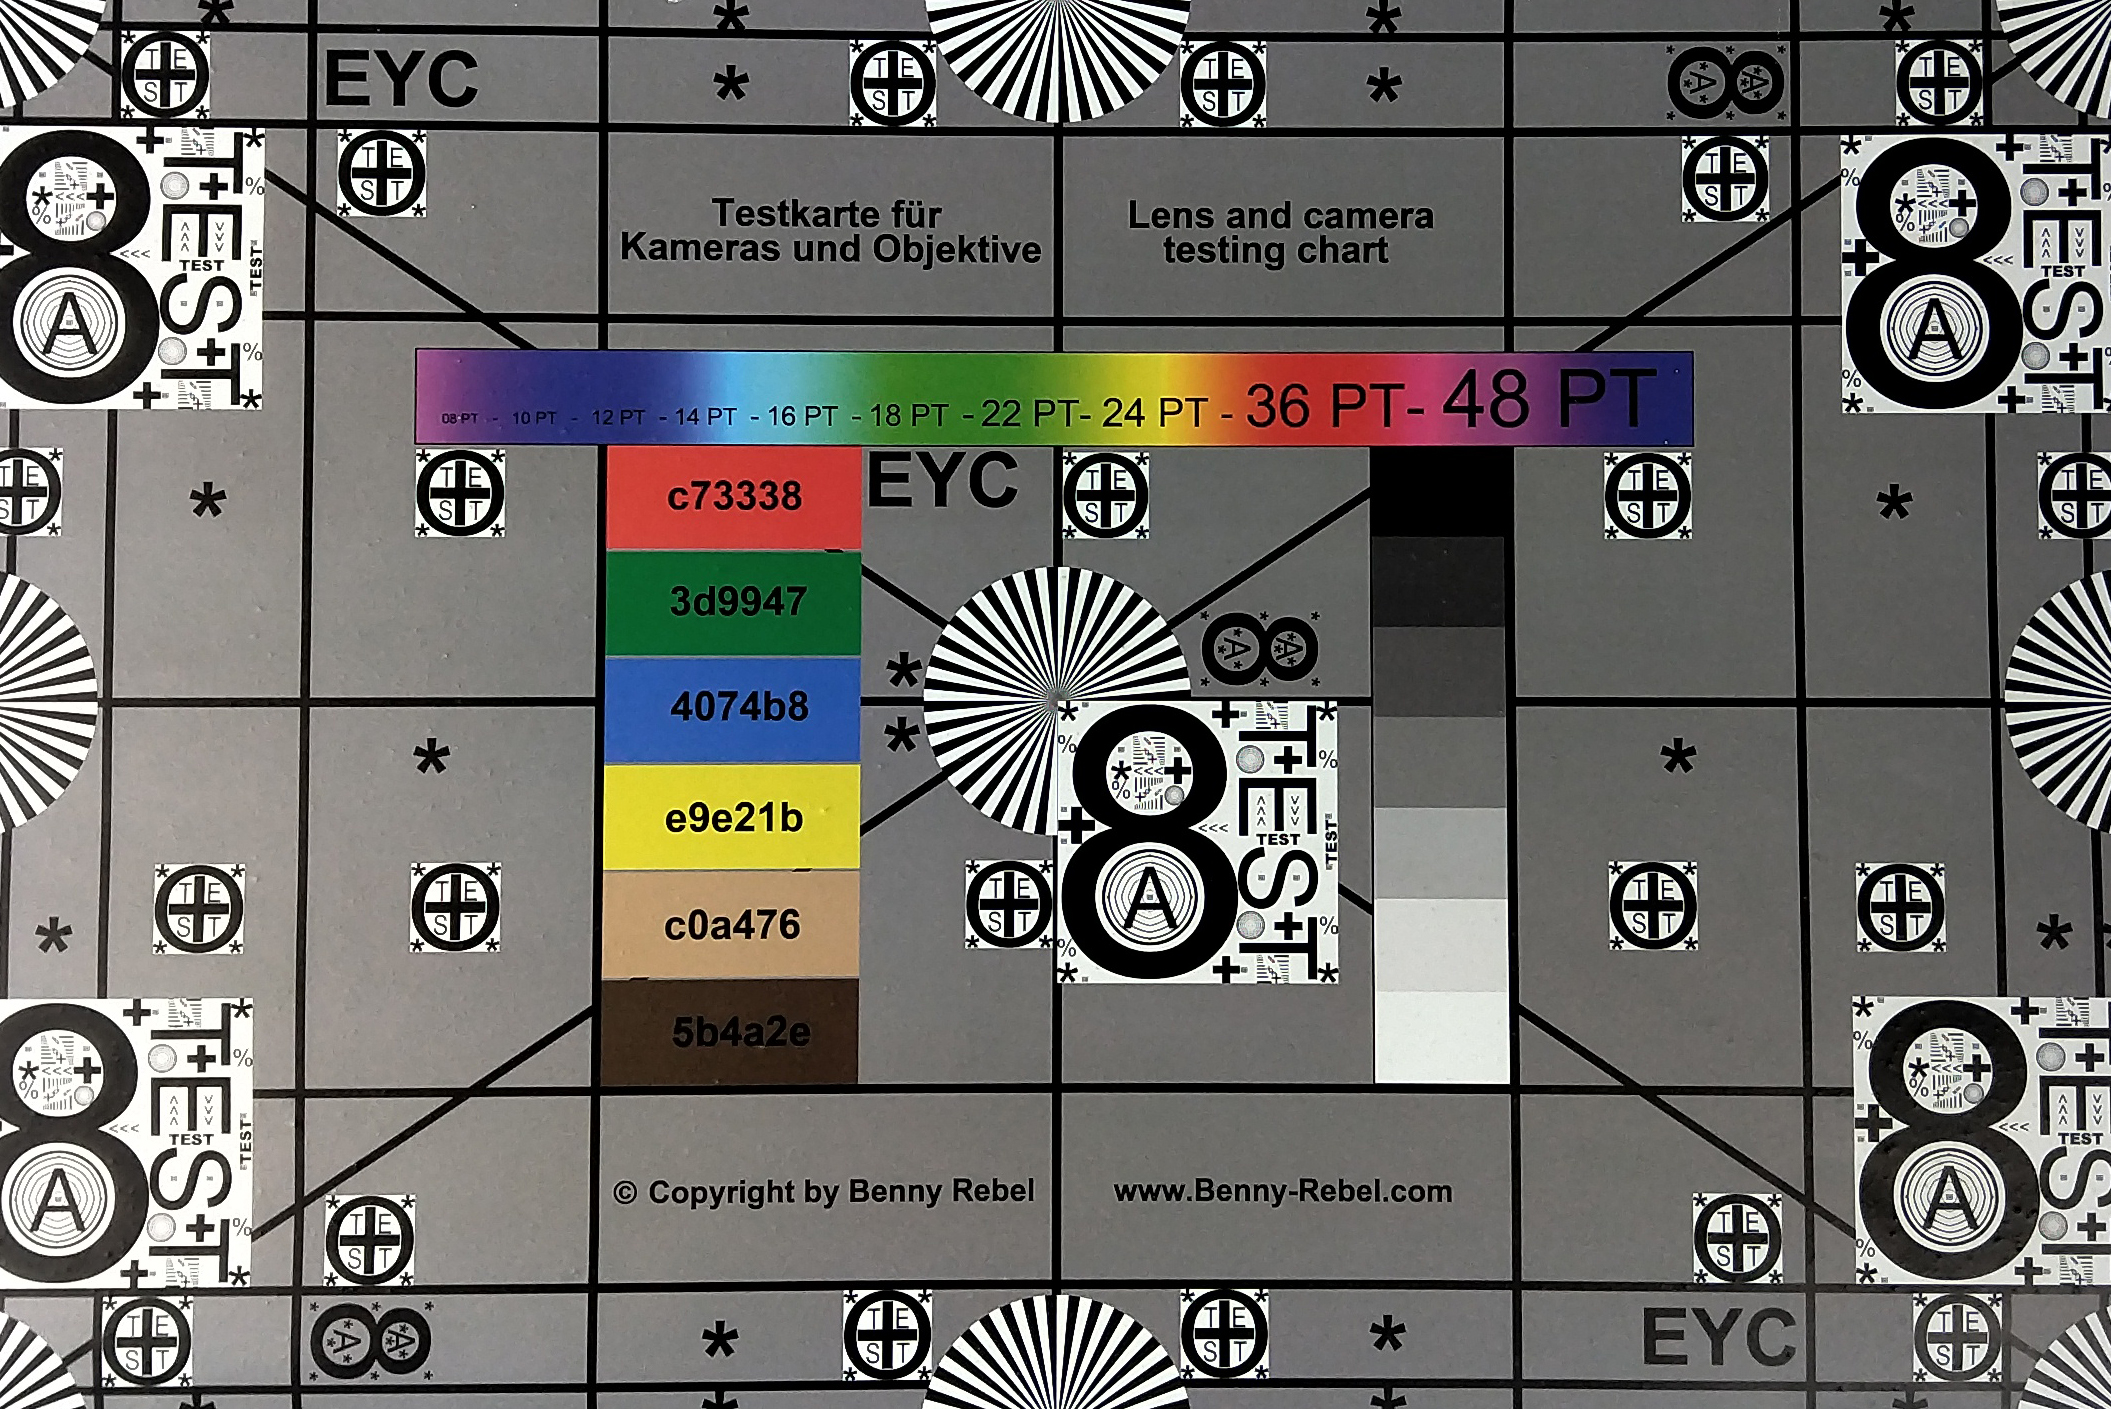
Our test chart also looks too dark when photographed in controlled lighting conditions. However, our test device manages to capture fine details and structures across the entire chart, which not all devices can do.

Accessories & Warranty
The D10 comes with a USB charger with a USB Type-C cable, a plastic case and a 3.5 mm to USB Type-C adapter in the box. Sharp currently does not sell any D10 specific accessories.
The device comes with 24 months manufacturer’s warranty. Please see our Guarantees, Return policies and Warranties FAQ for country-specific information.
Input Devices & Operation
Our test device has Google Gboard installed as the default keyboard. The app functions just as well on the D10 as it does on other devices. Other keyboards are downloadable from the Google Play Store should you wish to change from Gboard.
The touchscreen accurately and reliably reproduces inputs onscreen, while the display’s finish is smooth enough for multi-finger gestures. We found the finish too resistive for our fingertips when using the device for an extended period though. The positional sensor worked well throughout testing and quickly adjusts the orientation of the display according to how we held our test device.
Sharp has placed the D10’s fingerprint sensor on the rear of the device. The fingerprint sensor consistently unlocked our test device quickly during our tests.


Display
The D10 has a 5.99-inch IPS display that runs at a 2160x1080 native resolution with a 2:1 aspect ratio; you may see this referred to elsewhere as an 18:9 aspect ratio. Our test device achieves an average maximum brightness of 723 cd/m² according to X-Rite i1Pro 2, which is considerably brighter than all our comparison devices and is bright even by current flagship smartphone standards. The display is 89% evenly lit too, which a good level, although it is a few percent behind the Xperia XA2 Plus and its predecessor of our comparison devices.
| |||||||||||||||||||||||||
Brightness Distribution: 89 %
Center on Battery: 745 cd/m²
Contrast: 1242:1 (Black: 0.6 cd/m²)
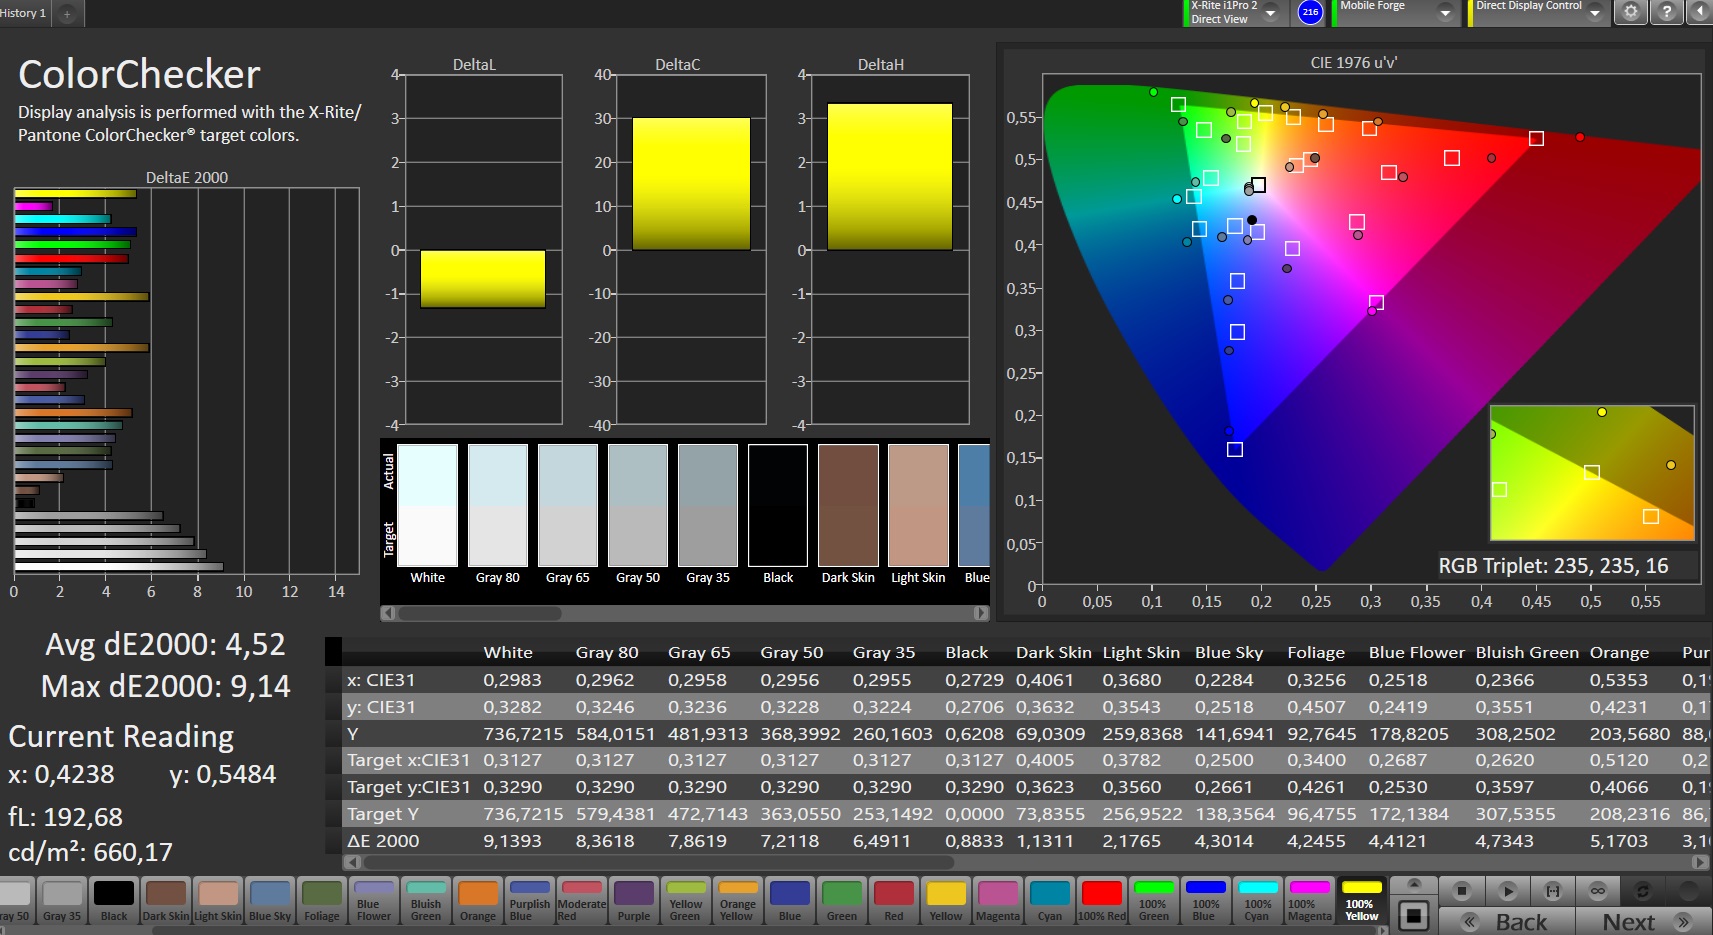
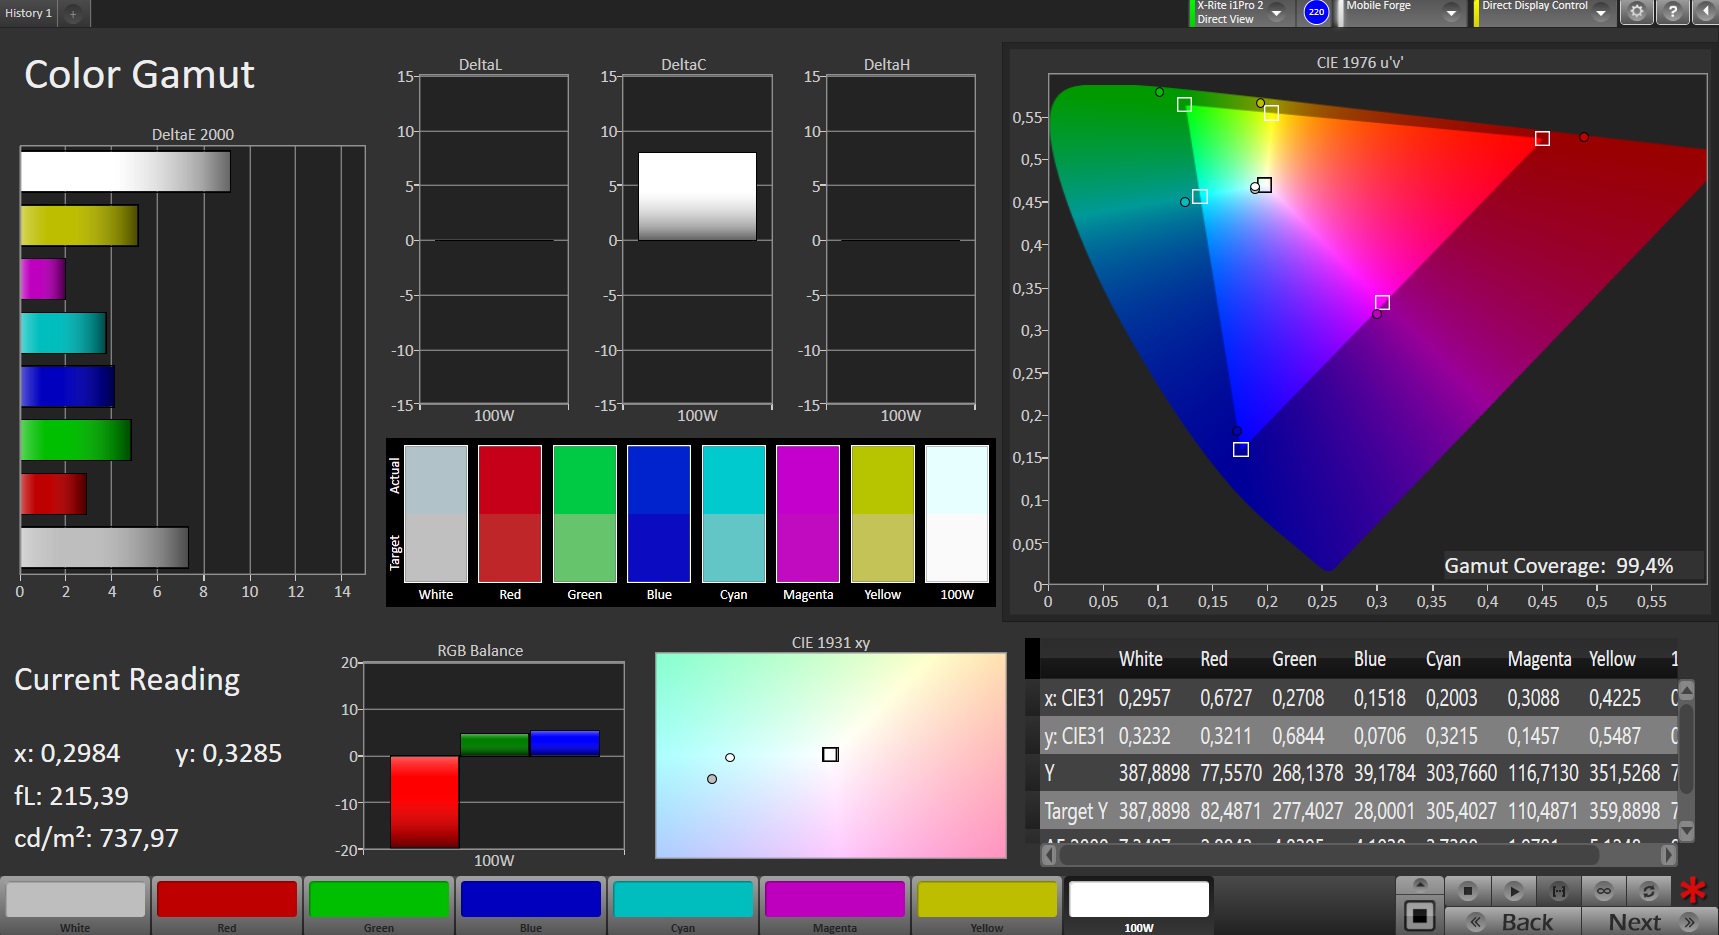
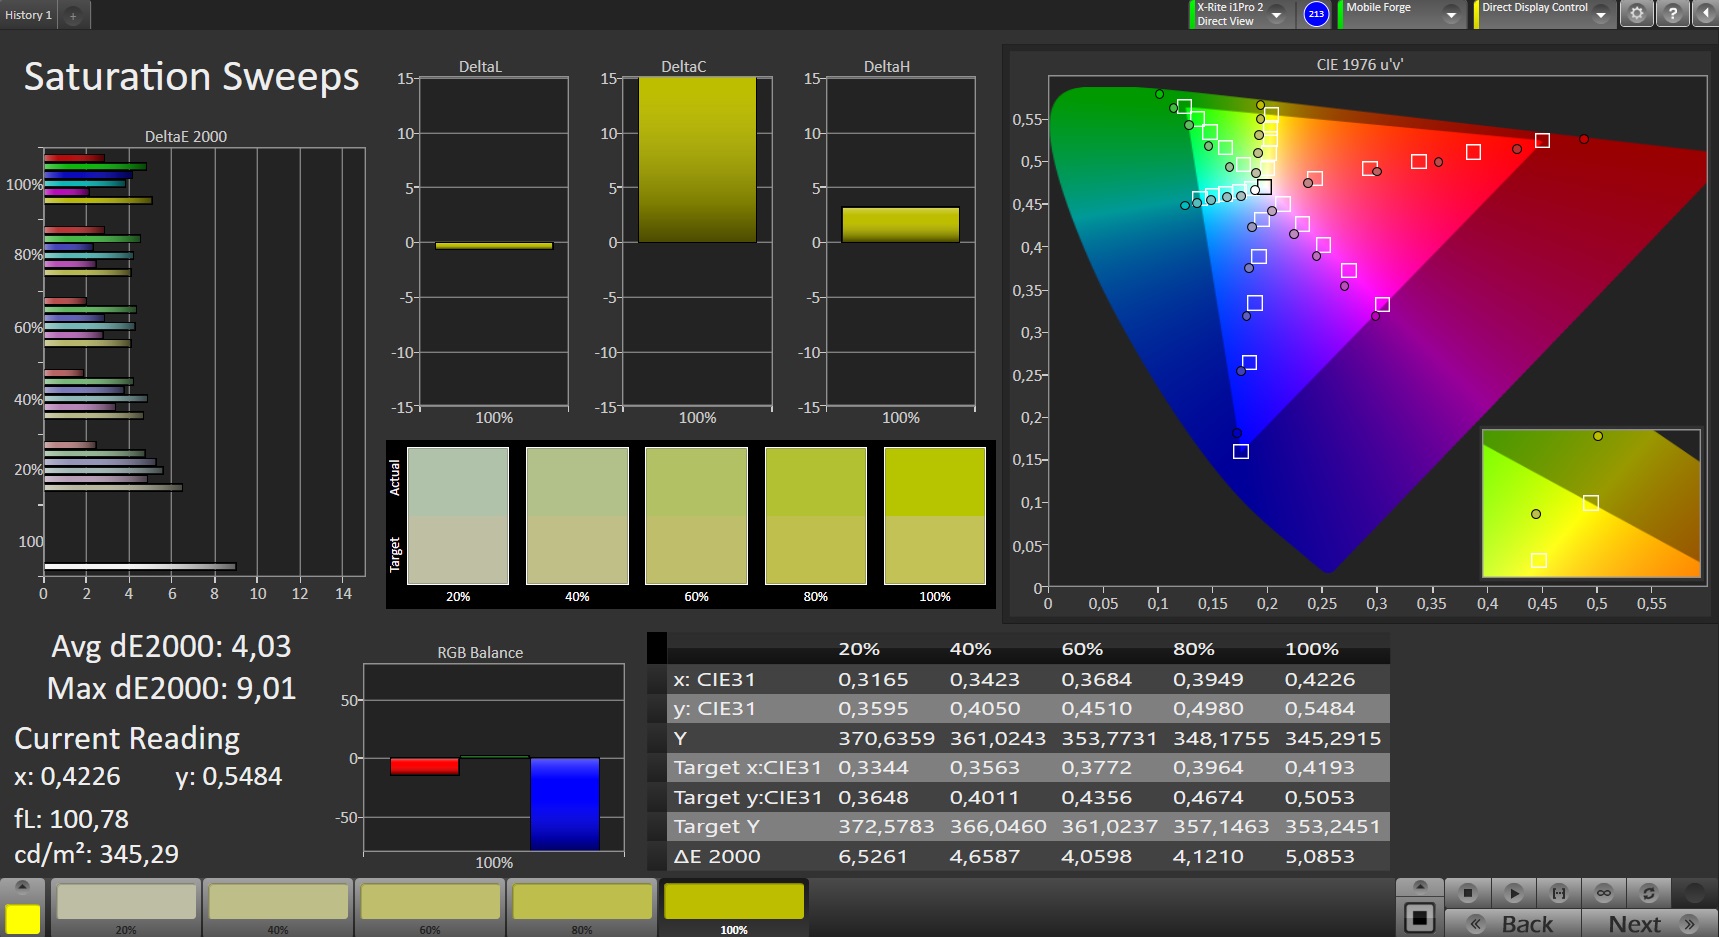
ΔE ColorChecker Calman: 4.52 | ∀{0.5-29.43 Ø4.72}
ΔE Greyscale Calman: 5.8 | ∀{0.09-98 Ø4.97}
99.4% sRGB (Calman 2D)
Gamma: 2.262
CCT: 7660 K
| Sharp D10 IPS, 2160x1080, 5.9" | Sony Xperia XA2 Plus IPS, 2160x1080, 6" | LG Q7 Plus IPS, 2160x1080, 5.5" | Sharp Aquos C10 IPS, 2040x1080, 5.5" | |
|---|---|---|---|---|
| Screen | 24% | -22% | -14% | |
| Brightness middle (cd/m²) | 745 | 597 -20% | 431 -42% | 548 -26% |
| Brightness (cd/m²) | 723 | 592 -18% | 419 -42% | 535 -26% |
| Brightness Distribution (%) | 89 | 92 3% | 89 0% | 92 3% |
| Black Level * (cd/m²) | 0.6 | 0.32 47% | 0.58 3% | 0.49 18% |
| Contrast (:1) | 1242 | 1866 50% | 743 -40% | 1118 -10% |
| Colorchecker dE 2000 * | 4.52 | 2.4 47% | 6.2 -37% | 5.21 -15% |
| Colorchecker dE 2000 max. * | 9.14 | 5.3 42% | 10.1 -11% | 13.47 -47% |
| Greyscale dE 2000 * | 5.8 | 3.4 41% | 6.2 -7% | 6.1 -5% |
| Gamma | 2.262 97% | 2.2 100% | 2.26 97% | 2.228 99% |
| CCT | 7660 85% | 7172 91% | 8064 81% | 7538 86% |
* ... smaller is better
Screen Flickering / PWM (Pulse-Width Modulation)
| Screen flickering / PWM detected | 2358 Hz | ≤ 20 % brightness setting | 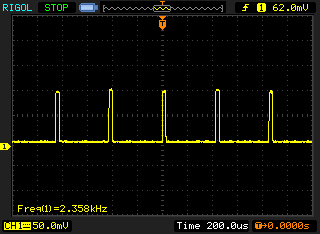 |
The display backlight flickers at 2358 Hz (worst case, e.g., utilizing PWM) Flickering detected at a brightness setting of 20 % and below. There should be no flickering or PWM above this brightness setting. The frequency of 2358 Hz is quite high, so most users sensitive to PWM should not notice any flickering. In comparison: 52 % of all tested devices do not use PWM to dim the display. If PWM was detected, an average of 7750 (minimum: 5 - maximum: 343500) Hz was measured. | |||
Our test device has a rather high 0.6 cd/m² black value but still achieves a decent 1,242:1 contrast ratio thanks to its high maximum luminosity. CalMAN demonstrates that the D10 can separate colours clearly, but black tones have a greyish tint to them.
We also noticed that our test device uses pulse-width modulation (PWM) to regulate display brightness at 20% luminosity and below. We measure a 2,358 Hz PWM frequency, which should be high enough to not cause issues for even those who are PWM sensitive.
CalMAN analysis software demonstrates that the display has a red tint to it, but this can be improved by manually adjusting the colour temperature within Settings. Sharp has included an “eye-saver” mode too, which can adjust the colour temperature to reduce eye strain when using the D10 at night.

Display Response Times
| ↔ Response Time Black to White | ||
|---|---|---|
| 20 ms ... rise ↗ and fall ↘ combined | ↗ 5 ms rise | 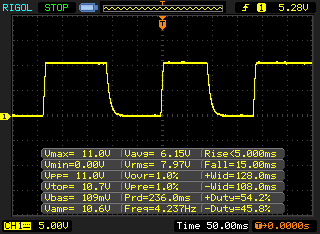 |
| ↘ 15 ms fall | ||
| The screen shows good response rates in our tests, but may be too slow for competitive gamers. In comparison, all tested devices range from 0.1 (minimum) to 240 (maximum) ms. » 44 % of all devices are better. This means that the measured response time is similar to the average of all tested devices (19.8 ms). | ||
| ↔ Response Time 50% Grey to 80% Grey | ||
| 42 ms ... rise ↗ and fall ↘ combined | ↗ 11 ms rise | 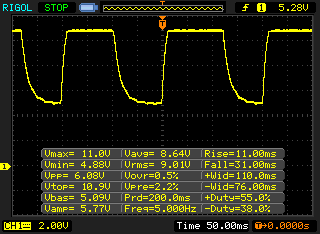 |
| ↘ 31 ms fall | ||
| The screen shows slow response rates in our tests and will be unsatisfactory for gamers. In comparison, all tested devices range from 0.165 (minimum) to 636 (maximum) ms. » 67 % of all devices are better. This means that the measured response time is worse than the average of all tested devices (31 ms). | ||
The D10 is easy to use outdoors thanks to its bright display. Our test device reflects in direct sunlight, but the display is bright enough to overcome this even on sunny days.

Our test device has stable viewing angles thanks to its IPS display. We did notice any brightness or colour distortions even at acute viewing angles. The D10 is usable from practically any angle, but reflections may occasionally obstruct your view.
Performance
The D10 uses a Qualcomm Snapdragon 630 SoC that integrates an Adreno 508 GPU. Sharp has complemented this with 4 GB RAM and 64 GB of eMMC flash storage. In short, the D10 is a performant mid-range smartphone that is powerful enough even for more-demanding apps.
Our test device typically finishes in the upper-midfield of our benchmark comparison tables. The D10 particularly thrives in system performance and GPU-intensive benchmarks. Overall, our test device is on par with our comparison devices.
| PCMark for Android - Work performance score (sort by value) | |
| Sharp D10 | |
| Sony Xperia XA2 Plus | |
| Asus ZenFone 5Z ZS620KL | |
| Asus ZenFone 5Z ZS620KL | |
| LG Q7 Plus | |
| Sharp Aquos C10 | |
| Average Qualcomm Snapdragon 630 (4948 - 6264, n=13) | |
| AnTuTu v7 - Total Score (sort by value) | |
| Sharp D10 | |
| Sony Xperia XA2 Plus | |
| Asus ZenFone 5Z ZS620KL | |
| Asus ZenFone 5Z ZS620KL | |
| LG Q7 Plus | |
| Sharp Aquos C10 | |
| Average Qualcomm Snapdragon 630 (87300 - 90674, n=11) | |
| AnTuTu v6 - Total Score (sort by value) | |
| Sharp D10 | |
| Sony Xperia XA2 Plus | |
| LG Q7 Plus | |
| Sharp Aquos C10 | |
| Average Qualcomm Snapdragon 630 (44128 - 73617, n=12) | |
The D10 also sits in the middle of comparison tables for browser benchmarks. Our test device loads websites and media content quickly in daily use too.
| JetStream 1.1 - 1.1 Total | |
| Asus ZenFone 5Z ZS620KL (Chrome 68; AI Boost ON) | |
| Asus ZenFone 5Z ZS620KL (Chrome 68) | |
| Average Qualcomm Snapdragon 630 (27.4 - 30.8, n=12) | |
| Sharp Aquos C10 (Chrome 68) | |
| Sharp D10 (Chrome 70) | |
| Sony Xperia XA2 Plus (Chrome 67) | |
| LG Q7 Plus (Chrome 67) | |
| Octane V2 - Total Score | |
| Average of class Smartphone (2800 - 126661, n=153, last 2 years) | |
| Asus ZenFone 5Z ZS620KL (Chrome 68, AI Boost ON) | |
| Asus ZenFone 5Z ZS620KL (Chrome 68) | |
| Sharp Aquos C10 (Chrome 68) | |
| Sony Xperia XA2 Plus (Chrome 67) | |
| Sharp D10 (Chrome 70) | |
| Average Qualcomm Snapdragon 630 (4398 - 5202, n=13) | |
| LG Q7 Plus (Chrome 67) | |
| Mozilla Kraken 1.1 - Total | |
| LG Q7 Plus (Chrome 67) | |
| Sony Xperia XA2 Plus (Chrome 67) | |
| Sharp D10 (Chrome 70) | |
| Average Qualcomm Snapdragon 630 (8396 - 10257, n=13) | |
| Sharp Aquos C10 (Chrome 68) | |
| Asus ZenFone 5Z ZS620KL (Chrome 68, AI Boost ON) | |
| Asus ZenFone 5Z ZS620KL (Chrome 68) | |
| Average of class Smartphone (257 - 28190, n=131, last 2 years) | |
* ... smaller is better
Our test device achieves decent scores in AndroBench 3-5 that put the D10 on par with our comparison devices. The eMMC flash storage’s read and write speeds are fast enough to ensure that the system performs smoothly.
We tested the microSD card reader with our Toshiba Exceria Pro M501 reference card, the results of which were good. Our test device achieved 83.2 MB/s sequential read and 63.6 MB/s sequential write speeds, which is about as quick as the microSD card readers in our comparison devices. The Xperia XA2 Plus has a marginally quicker microSD card reader, but we doubt that anyone would notice this in daily use.
| Sharp D10 | Sony Xperia XA2 Plus | LG Q7 Plus | Sharp Aquos C10 | Average 64 GB eMMC Flash | Average of class Smartphone | |
|---|---|---|---|---|---|---|
| AndroBench 3-5 | 1% | -14% | 0% | 17% | 1033% | |
| Sequential Read 256KB (MB/s) | 280.7 | 281.1 0% | 235.9 -16% | 283.8 1% | 278 ? -1% | 2248 ? 701% |
| Sequential Write 256KB (MB/s) | 211.5 | 146.2 -31% | 186.6 -12% | 213.4 1% | 178.6 ? -16% | 1930 ? 813% |
| Random Read 4KB (MB/s) | 47.2 | 77.4 64% | 35.8 -24% | 48.2 2% | 60.9 ? 29% | 312 ? 561% |
| Random Write 4KB (MB/s) | 16.79 | 10.5 -37% | 11.91 -29% | 16.9 1% | 34.2 ? 104% | 362 ? 2056% |
| Sequential Read 256KB SDCard (MB/s) | 83.2 ? | 86 ? 3% | 81.4 ? -2% | 83 ? 0% | 77.4 ? -7% | |
| Sequential Write 256KB SDCard (MB/s) | 63.6 ? | 67 ? 5% | 62.2 ? -2% | 60.7 ? -5% | 58.3 ? -8% |
Games
The Adreno 508 is powerful enough for most modern games at medium graphics settings. Arena of Valor and Asphalt 9: Legends ran smoothly and loaded quickly throughout testing.
The touchscreen and positional sensor worked well during our game tests. However, we found the display finish slightly too resistive for extended gaming sessions.


Emissions
Temperature

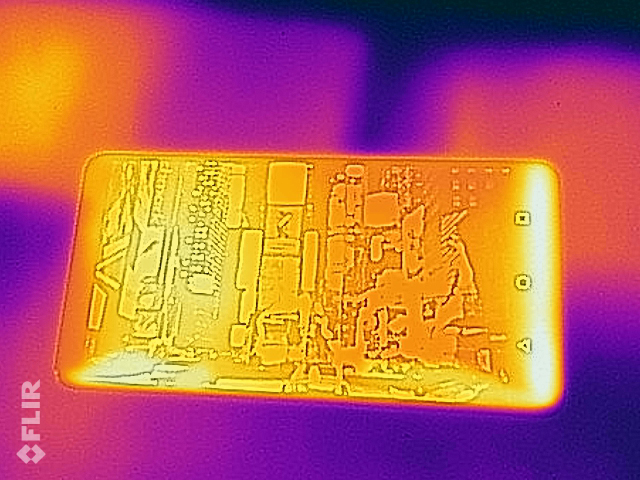
Surface temperatures idled at around 31 °C during our tests, which noticeably rose under load to an average maximum of 34 °C. The D10 should feel comfortable to hold even if users push the device to its limits.
We also subjected our test device to a looped GFXBench benchmark to test how well the D10 can maintain its performance. Our test device ran the complex Manhattan 3.1 benchmark easily and achieved consistent frame rates throughout the benchmark loop. The D10 should not thermal throttle in daily use.
(+) The maximum temperature on the upper side is 33.7 °C / 93 F, compared to the average of 35.3 °C / 96 F, ranging from 21.9 to 247 °C for the class Smartphone.
(+) The bottom heats up to a maximum of 35 °C / 95 F, compared to the average of 34 °C / 93 F
(+) In idle usage, the average temperature for the upper side is 31.8 °C / 89 F, compared to the device average of 33 °C / 91 F.
Speakers
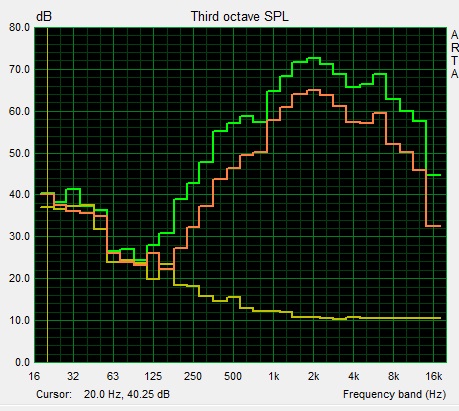
The D10 has a single speaker, the frequency spectrum of which is dominated by mid-tones. The speaker does not get particularly loud either, although mid and high frequencies are relatively loud. The speaker gets loud enough for playing audio in a quiet environment, but we would recommend using external speakers or headphones where possible for a better listening experience.
Sharp includes a 3.5 mm jack to USB Type-C adapter in the box for connecting traditional headphones to the D10. The adapter outputs clean audio when used.
Sharp D10 audio analysis
(±) | speaker loudness is average but good (80.3 dB)
Bass 100 - 315 Hz
(-) | nearly no bass - on average 61.6% lower than median
(+) | bass is linear (0% delta to prev. frequency)
Mids 400 - 2000 Hz
(-) | nearly no mids - on average 61.6% lower than median
(+) | mids are linear (0% delta to prev. frequency)
Highs 2 - 16 kHz
(-) | nearly no highs - on average 61.6% lower than median
(+) | highs are linear (0% delta to prev. frequency)
Overall 100 - 16.000 Hz
(-) | overall sound is not linear (117.6% difference to median)
Compared to same class
» 88% of all tested devices in this class were better, 7% similar, 5% worse
» The best had a delta of 11%, average was 34%, worst was 134%
Compared to all devices tested
» 96% of all tested devices were better, 2% similar, 2% worse
» The best had a delta of 4%, average was 23%, worst was 134%
Sony Xperia XA2 Plus audio analysis
(+) | speakers can play relatively loud (84.7 dB)
Bass 100 - 315 Hz
(-) | nearly no bass - on average 30.7% lower than median
(±) | linearity of bass is average (10.6% delta to prev. frequency)
Mids 400 - 2000 Hz
(+) | balanced mids - only 4.8% away from median
(+) | mids are linear (5.7% delta to prev. frequency)
Highs 2 - 16 kHz
(±) | higher highs - on average 6.6% higher than median
(+) | highs are linear (2.2% delta to prev. frequency)
Overall 100 - 16.000 Hz
(±) | linearity of overall sound is average (24.5% difference to median)
Compared to same class
» 59% of all tested devices in this class were better, 7% similar, 34% worse
» The best had a delta of 11%, average was 34%, worst was 134%
Compared to all devices tested
» 74% of all tested devices were better, 6% similar, 20% worse
» The best had a delta of 4%, average was 23%, worst was 134%
Battery Life
Power Consumption
The D10 is more efficient than all our comparison devices. Our test device consumes an average of 1 W at idle and a maximum of 5.2 W under load, which is significantly lower than average and most of our comparison devices. Only the Xperia XA2 Plus gets close to the D10 in our power consumption tests.
Sharp includes a 10 W charger. The charger is powerful enough to recharge the device even when it is operating under sustained load and recharges the D10 fully in around two hours.
| Off / Standby | |
| Idle | |
| Load |
|
Key:
min: | |
| Sharp D10 2900 mAh | Sony Xperia XA2 Plus 3580 mAh | LG Q7 Plus 3000 mAh | Sharp Aquos C10 2700 mAh | Average Qualcomm Snapdragon 630 | Average of class Smartphone | |
|---|---|---|---|---|---|---|
| Power Consumption | -9% | -29% | -88% | -31% | -59% | |
| Idle Minimum * (Watt) | 0.7 | 0.35 50% | 1 -43% | 0.9 -29% | 0.732 ? -5% | 0.88 ? -26% |
| Idle Average * (Watt) | 1 | 1.81 -81% | 1.57 -57% | 2.2 -120% | 1.835 ? -84% | 1.484 ? -48% |
| Idle Maximum * (Watt) | 1.4 | 1.83 -31% | 1.64 -17% | 3.8 -171% | 2.16 ? -54% | 1.671 ? -19% |
| Load Average * (Watt) | 3.7 | 3.31 11% | 4.1 -11% | 6.2 -68% | 3.81 ? -3% | 6.78 ? -83% |
| Load Maximum * (Watt) | 5.2 | 4.97 4% | 6.02 -16% | 8 -54% | 5.62 ? -8% | 11.4 ? -119% |
* ... smaller is better
Battery Life
The D10 has a 2,900 mAh battery, which delivered okay battery life in our tests. Our test device lasted 10 h 44 m in our Wi-Fi battery life test, which is three hours and 13 minutes short of what the Xperia XA2 Plus achieves. The XA2 Plus has around a 20% larger battery though, but it still lasted 30% longer than our test device. Overall, the D10 has comparatively mediocre battery life, which is unsurprising since it has a smaller battery than most of our comparison devices.
| Sharp D10 2900 mAh | Sony Xperia XA2 Plus 3580 mAh | LG Q7 Plus 3000 mAh | Sharp Aquos C10 2700 mAh | |
|---|---|---|---|---|
| Battery runtime | ||||
| WiFi v1.3 (h) | 10.7 | 14 31% | 10.3 -4% | 11.2 5% |
Pros
Cons
Verdict

The Sharp Aquos D10 is a solid mid-range smartphone that provides a good alternative to devices from more established manufacturers. The D10 has impressive system performance, which is not bogged down by any bloatware. The Snapdragon 630 SoC and 4 GB RAM make the D10 powerful enough to handle even demanding modern apps. The 64 GB of internal storage should be large enough for most users too.
The Sharp Aquos D10 is a solid smartphone that only disappoints with its comparatively disappointing cameras.
Sharp advertises the D10 as having optical zoom, but this did not provide any benefits during our tests. The dual rear-facing cameras are good enough for quick snapshots, but they could not replace a dedicated compact camera. Overall, the D10 is a decent device with a modern design that is let down by a few minor drawbacks.
Sharp D10
- 11/12/2018 v6 (old)
Mike Wobker
Price comparison

