Notebookcheck Logo

Qualcomm Snapdragon 480 Plus 5G vs MediaTek Dimensity 800U

Qualcomm Snapdragon 480 Plus 5G

► remove from comparison Qualcomm SD 480+

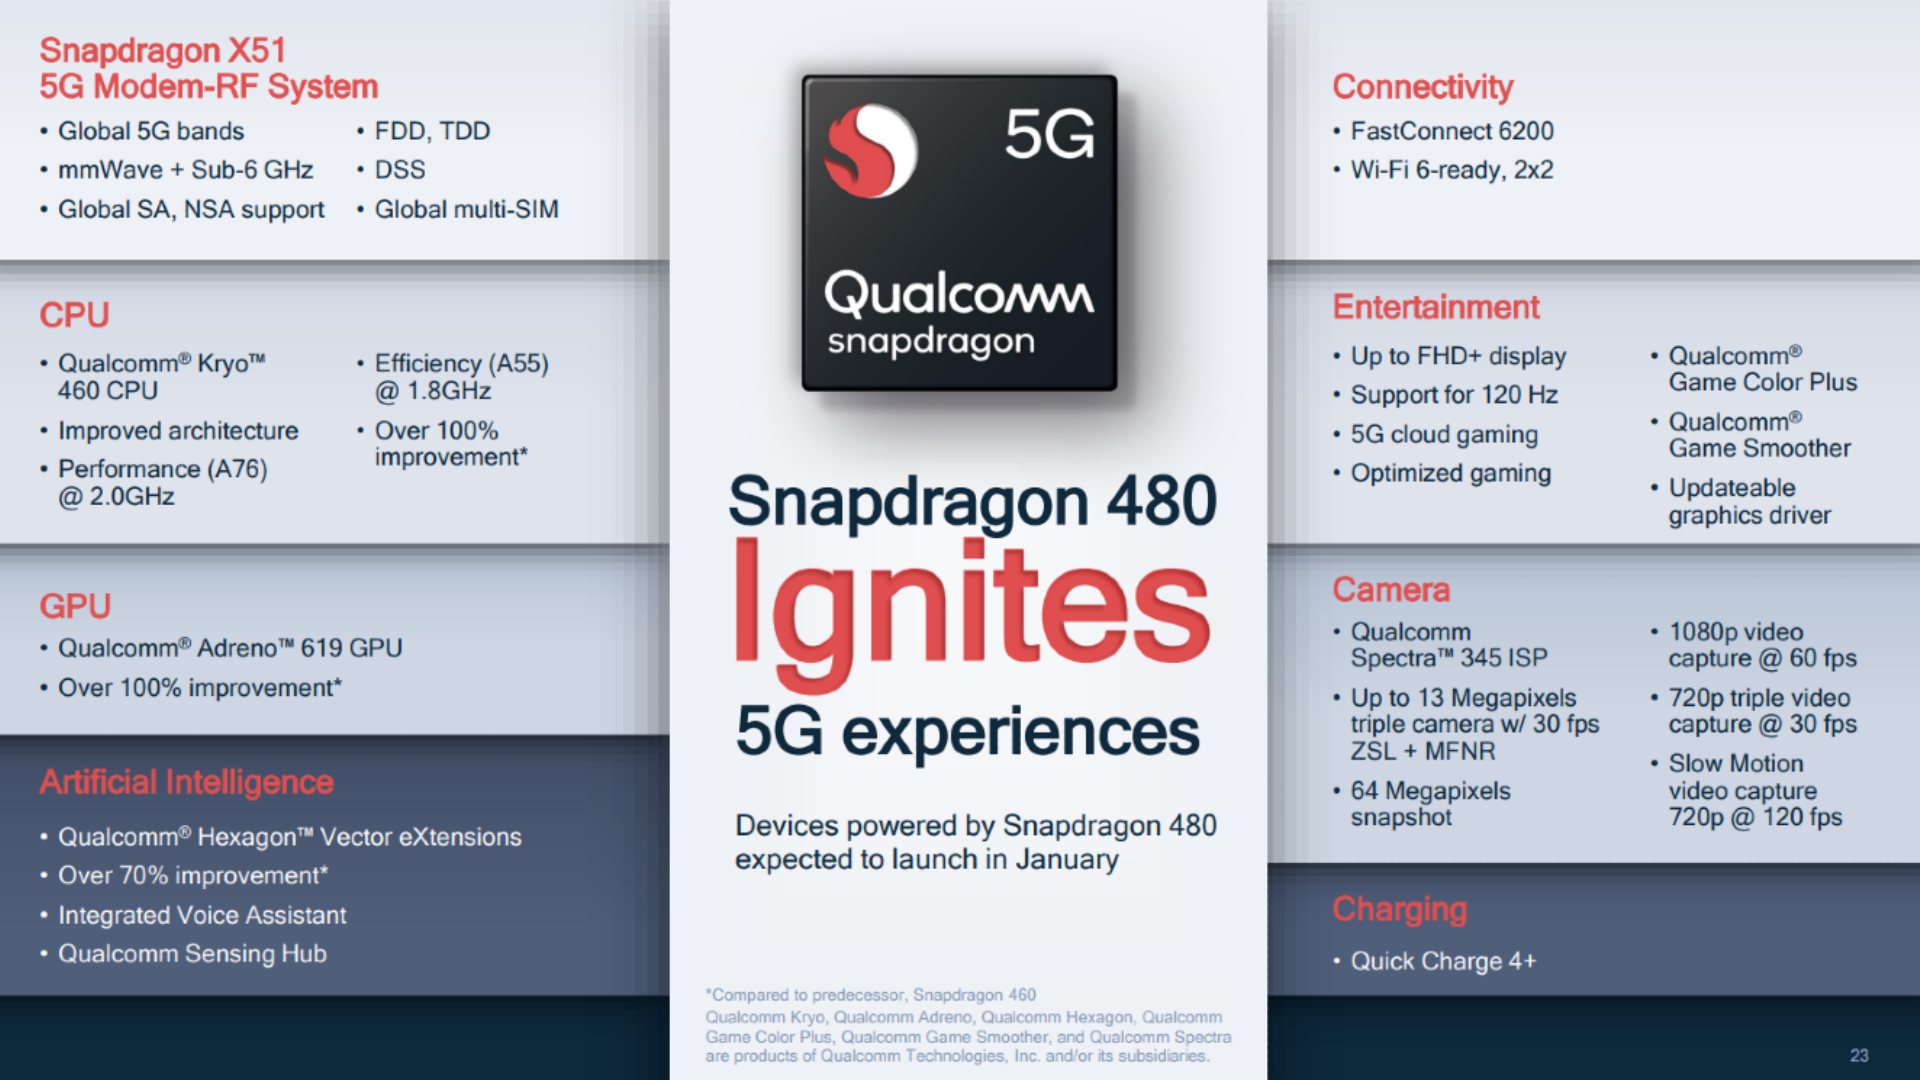
The Qualcomm Snapdragon 480 Plus 5G (SM4350-AC) is a lower mainstream SoC for (Android based) smartphones and tablets. It features eight cores in two clusters. A performance cluster with two ARM Cortex A76 cores at up to 2.2 GHz and a efficiency cluster with six small ARM Cortex A55 cores at up to 1.8 GHz. Compared to the older SD 480 5G, the 480+ offers 200 MHz higher clocked A76 cores.

The integrated Qualcomm X51 5G modem can reach up to 2.5 Gbps (5G) / 800 Mbps (LTE) download and 660 Mbps (5G) / 210 Mbps (LTE) upload speeds. The SoC also integrates WiFi 6 2x2 and Bluetooth 5.1.

The integrated Adreno 619 GPU is over 100% faster than the old Adreno 610 in the SD 460.

The SD480 is manufactured in the modern 8nm process and should be very energy efficient.

MediaTek Dimensity 800U

► remove from comparison Mediatek Dimensity 800U

The Mediatek Dimensity 800U is a fast mid-range SoC with an integrated 5G modem. It includes two fast ARM Cortex-A76 cores at up to 2.4 GHz and six power efficient Cortex-A55 cores at up to 2 GHz (Octa-Core with Heterogeneous Multi-Processing). Furthermore, the chip integrates a 3 core ARM Mali-G57 MC3 GPU, a Wi-fi 5 modem, a LPDDR4x memory controller, a AI processing unit (APU 3.0) and video de- and encoding.

Compared to the Dimensity 820, the 800U offers lower clocked A76 cores and a slower GPU.

The Dimensity 800U is manufactured in the modern 7nm process and should be very power efficient.

ModelQualcomm Snapdragon 480 Plus 5GMediaTek Dimensity 800U
CodenameCortex-A76 / 55Cortex-A76 / A55
SeriesQualcomm Snapdragon
Series: Snapdragon Cortex-A76 / 55
Qualcomm Snapdragon 480 Plus 5G « 1.8 - 2.2 GHz8 / 8 cores Cortex-A76 / 55
Qualcomm Snapdragon 480 5G compare1.8 - 2 GHz8 / 8 cores Cortex-A76 / 55
Clock1800 - 2200 MHz2000 - 2400 MHz
Cores / Threads8 / 88 / 8
Technology8 nm7 nm
FeaturesAdreno 619 GPU, X51 5G Modem, FastConnect Wi-Fi 6 2x2, Spectra 345 ISP, Quick Charge 4+2x ARM Cortex-A76 (2.4 GHz), 6x ARM Cortex-A55 (2 GHz), ARM Mali-G75 MC5, APU 3.0, 5G Modem (2CC), MiraVision (4K HDR Video, 80MP Photo), Wi-Fi 5, Bluetooth 5.1, UFS 2.2, 16GB LPDDR4x Support
iGPUQualcomm Adreno 619ARM Mali-G57 MP3
ArchitectureARMARM
Announced
Manufacturerwww.qualcomm.comwww.mediatek.com

Benchmarks

Performance Rating - Geekbench 5.5, PCM Work, Sling Shot Physics, Antutu v8 CPU - Dimensity 800U
0.6 pt (49%)
Restrict / Search: Model: Max. age: years
3DMark - 3DMark Ice Storm Unlimited Physics
22364 Points (18%)
3DMark - 3DMark Sling Shot Extreme (ES 3.1) Unlimited Physics
min: 3311     avg: 3352     median: 3359 (32%)     max: 3387 Points
min: 3205     avg: 3320     median: 3259 (31%)     max: 3497 Points
3DMark - 3DMark Sling Shot (ES 3.0) Unlimited Physics
3302 Points (38%)
min: 3095     avg: 3281     median: 3236 (37%)     max: 3512 Points
Geekbench 6.5 - Geekbench 6.5 Single-Core
100%
1 SD 480+ +
746 Points (18%)
Geekbench 6.5 - Geekbench 6.5 Multi-Core
100%
1 SD 480+ +
1917 Points (7%)
Geekbench 6.0 - Geekbench 6.0 Single-Core
100%
1 SD 480+ +
734 Points (23%)
Geekbench 6.0 - Geekbench 6.0 Multi-Core
100%
1 SD 480+ +
1690 Points (7%)
Geekbench 5.5 - Geekbench 5.1 - 5.5 64 Bit Single-Core
min: 540     avg: 551     median: 554 (21%)     max: 558 Points
min: 596     avg: 600     median: 599 (23%)     max: 606 Points
Geekbench 5.5 - Geekbench 5.1 - 5.5 64 Bit Multi-Core
min: 1632     avg: 1645     median: 1643 (3%)     max: 1661 Points
min: 1776     avg: 1785     median: 1779.5 (3%)     max: 1805 Points
Geekbench 4.4 - Geekbench 4.1 - 4.4 64 Bit Single-Core
2531 Points (25%)
Geekbench 4.4 - Geekbench 4.1 - 4.4 64 Bit Multi-Core
6819 Points (7%)
Geekbench 4.0 - Geekbench 4.0 64 Bit Single-Core
100%
1 SD 480+ +
2590 Points (29%)
Geekbench 4.0 - Geekbench 4.0 64 Bit Multi-Core
100%
1 SD 480+ +
6429 Points (8%)
Geekbench 3 - Geekbench 3 64 Bit Multi-Core
100%
1 SD 480+ +
3483 Points (5%)
Geekbench 3 - Geekbench 3 64 Bit Single-Core
100%
1 SD 480+ +
903 Points (14%)
Geekbench 2 - 32 Bit - Geekbench Stream
4054 Points (21%)
Geekbench 2 - 32 Bit - Geekbench Memory
4655 Points (32%)
Geekbench 2 - 32 Bit - Geekbench Floating Point
12938 Points (25%)
Geekbench 2 - 32 Bit - Geekbench Integer
6203 Points (12%)
Geekbench 2 - 32 Bit - Geekbench Total Score
8035 Points (21%)
Mozilla Kraken 1.1 - Kraken 1.1 Total Score *
min: 1829.3     avg: 2067     median: 2092 (2%)     max: 2279.9 ms
min: 3013     avg: 3669     median: 3298 (4%)     max: 4695 ms
Octane V2 - Octane V2 Total Score
min: 19795     avg: 20474     median: 20689 (15%)     max: 20938 Points
min: 9999     avg: 14917     median: 16629 (12%)     max: 18123 Points
WebXPRT 4 - WebXPRT 4 Score
100%
1 SD 480+ +
min: 63     avg: 70     median: 70 (19%)     max: 77 Points
WebXPRT 3 - WebXPRT 3 Score
min: 84     avg: 85.5     median: 85.5 (15%)     max: 87 Points
min: 45     avg: 50     median: 47 (8%)     max: 58 Points
AnTuTu v8 - AnTuTu v8 UX
59958 Points (50%)
AnTuTu v8 - AnTuTu v8 MEM
54995 Points (44%)
AnTuTu v8 - AnTuTu v8 GPU
59878 Points (11%)
AnTuTu v8 - AnTuTu v8 CPU
96825 Points (35%)
AnTuTu v8 - AnTuTu v8 Total Score
271656 Points (26%)
Antutu v9 - AnTuTu v9 Total Score
min: 311776     avg: 314751     median: 314750 (15%)     max: 317725 Points
366649 Points (18%)
Antutu v9 - AnTuTu v9 CPU
min: 105559     avg: 106917     median: 106917 (27%)     max: 108275 Points
103228 Points (26%)
PassMark PerformanceTest Mobile V1 - PerformanceTest Mobile V1 CPU Tests
min: 4117     avg: 4242     median: 4242 (1%)     max: 4367 Points
min: 3336     avg: 12939     median: 12938.5 (2%)     max: 22541 Points
PCMark for Android - PCM f. Android Storage 2.0 score
min: 15399     avg: 16066     median: 16065.5 (7%)     max: 16732 Points
17258 Points (8%)
PCMark for Android - PCM f. Android Work Score 3.0
min: 9527     avg: 10037     median: 10093 (37%)     max: 10492 Points
min: 7087     avg: 7337     median: 7337 (27%)     max: 7587 Points
PCMark for Android - PCM f. Android Computer Vision
3228 Points (17%)
PCMark for Android - PCM f. Android Storage
19054 Points (41%)
PCMark for Android - PCM f. Android Work Score 2.0
min: 8738     avg: 9893     median: 9892.5 (65%)     max: 11047 Points
PCMark for Android - PCM f. Android Work Score
min: 10527     avg: 13283     median: 13283 (66%)     max: 16039 Points
CrossMark - CrossMark Overall
100%
1 SD 480+ +
min: 496     avg: 522     median: 525 (20%)     max: 546 Points
Power Consumption - Geekbench 5.5 Power Consumption 150cd *
100%
1 SD 480+ +
min: 3.32     avg: 4.4     median: 4.4 (2%)     max: 5.53 Watt
3.1 Watt (1%)
Power Consumption - Idle Power Consumption 150cd 1min *
100%
1 SD 480+ +
min: 1.068     avg: 1.6     median: 1.6 (2%)     max: 2.18 Watt
1.1 Watt (1%)

Average Benchmarks Qualcomm Snapdragon 480 Plus 5G → 100% n=19

Average Benchmarks MediaTek Dimensity 800U → 101% n=19

- Range of benchmark values for this graphics card
red legend - Average benchmark values for this graphics card
* Smaller numbers mean a higher performance
1 This benchmark is not used for the average calculation

Add one or more devices and compare

In the following list you can select (and also search for) devices that should be added to the comparison. You can select more than one device.

restrict list:
v1.34
log 07. 21:03:39

#0 ran 0s before starting gpusingle class +0s ... 0s

#1 checking url part for id 14129 +0s ... 0s

#2 checking url part for id 12955 +0s ... 0s

#3 redirected to Ajax server, took 1759863819s time from redirect:0 +0s ... 0s

#4 did not recreate cache, as it is less than 5 days old! Created at Tue, 07 Oct 2025 05:18:31 +0200 +0s ... 0s

#5 composed specs +0.005s ... 0.005s

#6 did output specs +0s ... 0.005s

#7 getting avg benchmarks for device 14129 +0.001s ... 0.005s

#8 got single benchmarks 14129 +0.007s ... 0.013s

#9 getting avg benchmarks for device 12955 +0.003s ... 0.016s

#10 got single benchmarks 12955 +0.008s ... 0.024s

#11 got avg benchmarks for devices +0s ... 0.024s

#12 No cached benchmark found, getting uncached values +0.006s ... 0.03s

#13 No cached benchmark found, getting uncached values +0.001s ... 0.031s

#14 min, max, avg, median took s +0.016s ... 0.047s

#15 return log +0.001s ... 0.047s

Please share our article, every link counts!
Mail Logo
> Expert Reviews and News on Laptops, Smartphones and Tech Innovations > Benchmarks / Tech > Processor Comparison - Head 2 Head
Redaktion, 2017-09- 8 (Update: 2023-07- 1)