Notebookcheck Logo

Qualcomm Snapdragon S4 Plus MSM8230 vs HiSilicon Kirin 910T vs Marvell PXA986

Qualcomm Snapdragon S4 Plus MSM8230

► remove from comparison Qualcomm S4 Plus MSM8230

The Qualcomm MSM8230 (Snapdragon S4 Plus series) is a ARM based high-end smartphone SoC in 2012. It contains two Krait (ARMv7) CPU cores at up to 1.2 GHz, a Adreno 305 GPU, a single channel LPDDR2 memory controller and radio elements.  The chip is produced in 28nm LP (low power process) at TSMC. Compared to the MSM8930, the 8230 lacks LTE.

The Krait cores offer a slightly better performance as the standard Cortex-A9 cores and are compatible to the NEON SIMD extensions.

HiSilicon Kirin 910T

► remove from comparison

The HiSilicon Kirin 910T is an ARM based quad core SoC for Android smartphones and tablets. As HiSilicon is fully owned by Huawei, the chip is mostly used in Huawei models like the MediaPad X1, P6 S, MediaPad M1 and Honor 3C 4G). The SoC integrates four Cortex-A9 cores (at 1.8 GHz max.), a ARM Mali-450 MP4 GPU (at 533 MHz), a 32-bit single-channel LPDDR3-1600 memory controller (533 MHz) and a LTE Cat. 4 radio. The similar named HiSilicon Kirin 910 is a 200 MHz slower clocked (CPU) version.

At the time of announcement in mid 2014, the CPU performance of the Kirin910T is in the mid-range of smartphone and tablet SoCs. The power consumption is a bit higher than usual, as the CPU cores are rather high clocked.

Marvell PXA986

► remove from comparison Marvell Technology Group PXA986

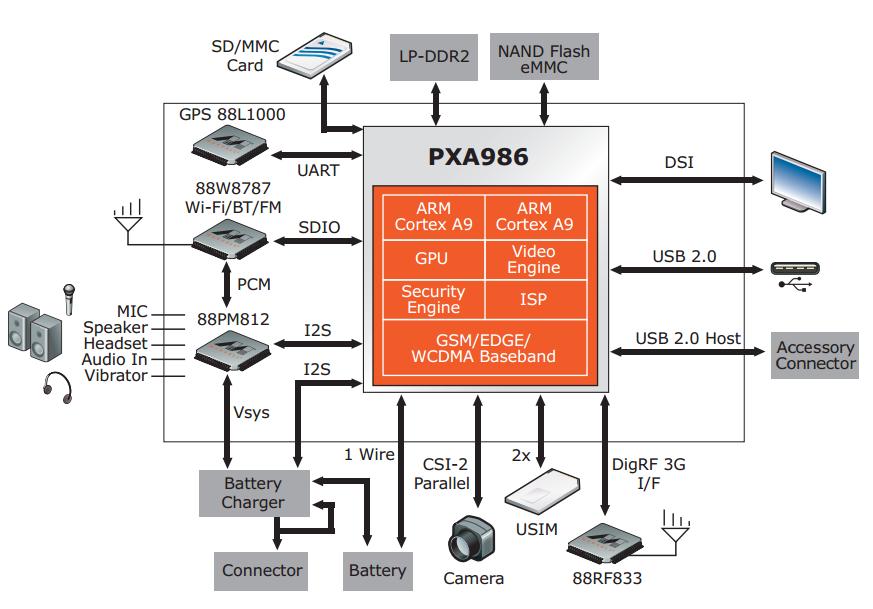
The Marvell PXA986 is an ARM based dual-core SoC for smartphones and tablets (mostly Android based). It contains two Cortex-A9 CPU cores usually clocked around 1.2 GHz and a Vivante GC1000 graphics card. The integrated video processor is able to handle 720p30 content in H.263, H.264 BP and MPEG4 SP encoding. Furthermore, a GSM/EDGE/WCDMA/HSDPA radio is included in the chip.

ModelQualcomm Snapdragon S4 Plus MSM8230HiSilicon Kirin 910TMarvell PXA986
SeriesQualcomm Snapdragon Marvell Technology Group
CodenameARMv7Cortex-A9Cortex-A9
Series: Cortex-A9
Qualcomm Snapdragon S4 Pro APQ8064A1.5 GHz4 / 4 cores ARMv7
Qualcomm Snapdragon 400 MSM89281.6 GHz4 / 4 cores ARMv7
Qualcomm Snapdragon 400 APQ80281.6 GHz4 / 4 cores ARMv7
Qualcomm Snapdragon S4 Pro MSM8960T1.7 GHz2 / 2 cores ARMv7
Qualcomm Snapdragon 400 8930AB1.7 GHz2 / 2 cores ARMv7
Qualcomm Snapdragon S4 Plus APQ8060A1.5 GHz2 / 2 cores ARMv7
Qualcomm Snapdragon S4 Plus MSM89601.5 GHz2 / 2 cores ARMv7
Qualcomm Snapdragon S4 Plus MSM8260A1.7 GHz2 / 2 cores ARMv7
Qualcomm Snapdragon 400 MSM89261.2 GHz4 / 4 cores ARMv7
Qualcomm Snapdragon 400 MSM82261.2 GHz4 / 4 cores ARMv7
Qualcomm Snapdragon 400 APQ80261.2 GHz4 / 4 cores ARMv7
Qualcomm Snapdragon S4 Plus MSM89301.2 GHz2 / 2 cores ARMv7
Qualcomm Snapdragon S4 Plus MSM8230 « 1.2 GHz2 / 2 cores ARMv7
Qualcomm Snapdragon S4 Plus MSM82271 GHz2 / 2 cores ARMv7
Qualcomm Snapdragon S3 MSM86601.7 GHz2 / 2 cores ARMv7
Qualcomm Snapdragon S3 MSM82601.5 GHz2 / 2 cores ARMv7
Qualcomm Snapdragon S1 QSD82501 GHz1 / 1 cores ARMv7
HiSilicon Kirin 910T « 1.8 GHz4 / 4 cores Cortex-A9
Rockchip RK31881.8 GHz4 / 4 cores Cortex-A9
HiSilicon Kirin 9101.6 GHz4 / 4 cores Cortex-A9
Renesas MP52321.5 GHz2 / 2 cores Cortex-A9
Broadcom BCM21664T1.2 GHz2 / 2 cores Cortex-A9
Marvell PXA9861.2 GHz2 / 2 cores Cortex-A9
NXP i.MX 6SLL1 GHz1 / 1 cores Cortex-A9
WonderMedia PRIZM WM89501 GHz1 / 1 cores Cortex-A9
HiSilicon Kirin 910T1.8 GHz4 / 4 cores Cortex-A9
Rockchip RK31881.8 GHz4 / 4 cores Cortex-A9
HiSilicon Kirin 9101.6 GHz4 / 4 cores Cortex-A9
Renesas MP52321.5 GHz2 / 2 cores Cortex-A9
Broadcom BCM21664T1.2 GHz2 / 2 cores Cortex-A9
Marvell PXA986 « 1.2 GHz2 / 2 cores Cortex-A9
NXP i.MX 6SLL1 GHz1 / 1 cores Cortex-A9
WonderMedia PRIZM WM89501 GHz1 / 1 cores Cortex-A9
Clock1200 MHz1800 MHz1200 MHz
L1 Cache64 KB
L2 Cache1 MB
Cores / Threads2 / 24 / 42 / 2
Technology28 nm28 nm45 nm
FeaturesHSPA+, EDGE, GSM, GPRS, GPS, WiFi, Bluetooth, NFC, FMARMv7, Mali-450 MP4 (533 MHz), LTE (Cat. 4), Single-Channel LPDDR3-1600 (6.4 GB/s)
iGPUQualcomm Adreno 305
ArchitectureARMARMARM
Announced
Manufacturerwww.marvell.com

Benchmarks

3DMark - 3DMark Ice Storm Physics
min: 4020     avg: 4586     median: 4586 (4%)     max: 5152 Points
11572 Points (9%)
min: 2623     avg: 2874     median: 2740 (2%)     max: 3258 Points
3DMark - 3DMark Ice Storm Extreme Physics
4038 Points (3%)
11485 Points (9%)
min: 2709     avg: 2985     median: 2985 (2%)     max: 3261 Points
3DMark - 3DMark Ice Storm Unlimited Physics
13330 Points (11%)
28%
1 PXA986 +
3675 Points (3%)
Geekbench 3 - Geekbench 3 32 Bit Multi-Core
457 Points (1%)
1796 Points (3%)
min: 631     avg: 647     median: 646.5 (1%)     max: 662 Points
Geekbench 3 - Geekbench 3 32 Bit Single-Core
454 Points (9%)
599 Points (12%)
min: 376     avg: 379.5     median: 379.5 (7%)     max: 383 Points
Geekbench 2 - 32 Bit - Geekbench Stream
536 Points (4%)
82%
1 PXA986 +
min: 437     avg: 439.5     median: 439.5 (4%)     max: 442 Points
Geekbench 2 - 32 Bit - Geekbench Memory
1320 Points (12%)
110%
1 PXA986 +
min: 1337     avg: 1448     median: 1448 (13%)     max: 1559 Points
Geekbench 2 - 32 Bit - Geekbench Floating Point
1515 Points (3%)
85%
1 PXA986 +
min: 1275     avg: 1284     median: 1284 (3%)     max: 1293 Points
Geekbench 2 - 32 Bit - Geekbench Integer
670 Points (1%)
107%
1 PXA986 +
min: 709     avg: 720     median: 720 (1%)     max: 731 Points
Geekbench 2 - 32 Bit - Geekbench Total Score
1082 Points (3%)
96%
1 PXA986 +
min: 1005     avg: 1035     median: 1034.5 (3%)     max: 1064 Points
Linpack Android / IOS - Linpack Multi Thread
min: 183.5     avg: 194.6     median: 194.6 (7%)     max: 205.7 MFLOPS
254 MFLOPS (9%)
min: 73.7     avg: 74.3     median: 74 (3%)     max: 75.3 MFLOPS
Linpack Android / IOS - Linpack Single Thread
min: 37.71     avg: 85.8     median: 85.8 (8%)     max: 133.9 MFLOPS
83.2 MFLOPS (8%)
min: 39.83     avg: 41.6     median: 41.4 (4%)     max: 43.69 MFLOPS
Mozilla Kraken 1.1 - Kraken 1.1 Total Score *
16231 ms (19%)
16135 ms (19%)
min: 23941     avg: 25315     median: 25315 (30%)     max: 26689 ms
Sunspider - Sunspider 1.0 Total Score *
min: 1154     avg: 1812     median: 1811.5 (20%)     max: 2469 ms
1043 ms (11%)
min: 1428     avg: 1608     median: 1624 (18%)     max: 1771 ms
Sunspider - Sunspider 0.9.1 Total Score *
min: 1055     avg: 1261     median: 1125 (11%)     max: 1604 ms
96%
1 PXA986 +
min: 1453     avg: 1531     median: 1530.5 (15%)     max: 1608 ms
Octane V2 - Octane V2 Total Score
2775 Points (2%)
52%
1 PXA986 +
1448 Points (1%)
Quadrant Standard Edition 2.0 - Quadrant Standard 2.0 Total Score
min: 4202     avg: 4658     median: 4658 (11%)     max: 5114 points
7189 points (17%)
min: 3257     avg: 3515     median: 3514.5 (8%)     max: 3772 points
AnTuTu v3 - AnTuTu v3 CPU
2394 Points (16%)
123%
1 PXA986 +
2945 Points (19%)
AnTuTu v4 - AnTuTu v4 Total Score
14895 Points (35%)
23864 Points (56%)
min: 11051     avg: 11392     median: 11392 (26%)     max: 11733 Points
AndEBench - AndEBench Java
236 Iter./s (7%)
584 Iter./s (18%)
min: 137     avg: 160     median: 159 (5%)     max: 184 Iter./s
AndEBench - AndEBench Native
5123 Iter./s (17%)
13307 Iter./s (44%)
min: 4077     avg: 4208     median: 4266 (14%)     max: 4281 Iter./s
PassMark PerformanceTest Mobile V1 - PerformanceTest Mobile V1 CPU Tests
min: 3723     avg: 4294     median: 4294 (1%)     max: 4865 Points
12178 Points (2%)
min: 3273     avg: 3820     median: 3976 (1%)     max: 4210 Points

Average Benchmarks Qualcomm Snapdragon S4 Plus MSM8230 → 100% n=13

Average Benchmarks HiSilicon Kirin 910T → 200% n=13

Average Benchmarks Marvell PXA986 → 79% n=13

- Range of benchmark values for this graphics card
- Average benchmark values for this graphics card
* Smaller numbers mean a higher performance
1 This benchmark is not used for the average calculation

v1.27
log 16. 09:54:44

#0 checking url part for id 4062 +0s ... 0s

#1 checking url part for id 6191 +0s ... 0s

#2 checking url part for id 4461 +0s ... 0s

#3 not redirecting to Ajax server +0s ... 0s

#4 did not recreate cache, as it is less than 5 days old! Created at Sun, 16 Jun 2024 05:37:17 +0200 +0.001s ... 0.001s

#5 composed specs +0.098s ... 0.099s

#6 did output specs +0s ... 0.099s

#7 getting avg benchmarks for device 4062 +0.004s ... 0.103s

#8 got single benchmarks 4062 +0.012s ... 0.115s

#9 getting avg benchmarks for device 6191 +0.003s ... 0.118s

#10 got single benchmarks 6191 +0.008s ... 0.126s

#11 getting avg benchmarks for device 4461 +0.004s ... 0.129s

#12 got single benchmarks 4461 +0.011s ... 0.141s

#13 got avg benchmarks for devices +0s ... 0.141s

#14 min, max, avg, median took s +0.212s ... 0.352s

#15 return log +0s ... 0.353s

Please share our article, every link counts!
> Expert Reviews and News on Laptops, Smartphones and Tech Innovations > Benchmarks / Tech > Processor Comparison - Head 2 Head
Redaktion, 2017-09- 8 (Update: 2023-07- 1)