Review of the OCZ Octane SATA 3 SSD with 512 GB

Manufacturer's information:
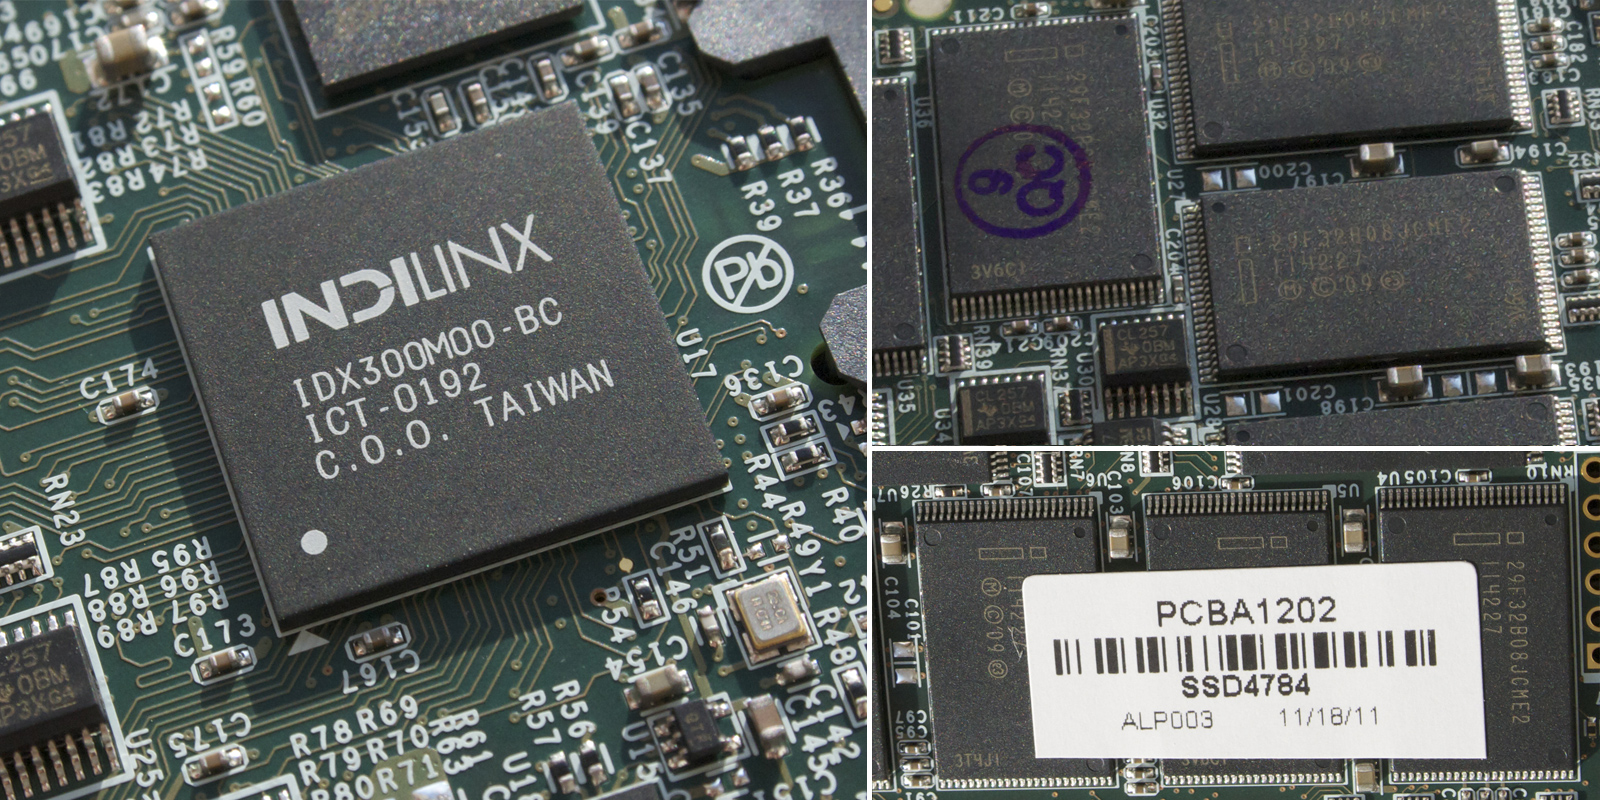
- Indilinx Everest Controller (ICX300M00-BC) Dual-Core CPU with 512 MB Cache
- automatic AES encryption
- 128 GB (read max. 535 MB/s, write max. 170 MB/s) up to 1 TB (read max. 560 MB/s, write max. 400 MB/s).
- 2.5 " (99.8 x 69.6 x 9.3 mm), 83g
- 1.98 W active, 1,15 W stand-by
- MTBF (Mean Time Between Failures): 1,250,000 hours
- 3 years warranty
- OCZ toolbox not yet available - but sheduled
- Manufacturer's site
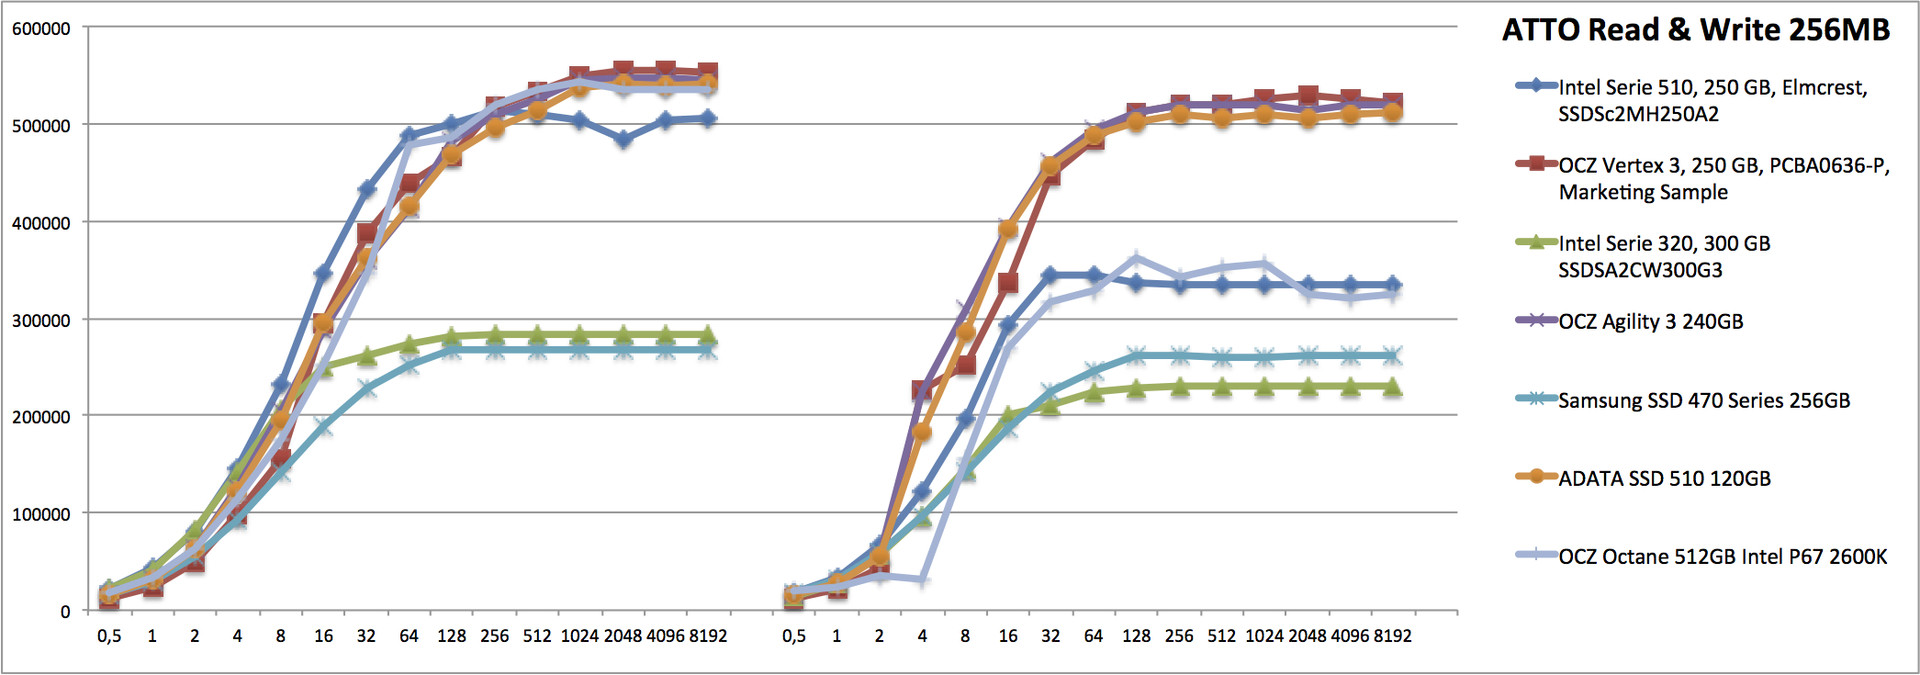
ATTO
In the ATTO benchmark, most SSDs reach top values, and so the marketing claims of the manufacturer. This is true for the read rates of the Octane (530 versus 535 MB/s), but ATTO could only measure a write rate of 353 MB/s instead of the promised 400 MB/s. Later, in the AS SSD benchmark, we'll see that OCZ does not make empty promises anyway. In this benchmark, the Octane achieves 397.7 MB/s in the sequential write test.
Sequential Write and Read Rates
The new Indilinx Controllers can show its strength in the sequential data transfer rates. In AS SSD and CrystalDiskMark it can (partly clearly) outperform its competitors. Even the High-End SSDs 510 from Intel and the Vertex 3 from OCZ are 30% and 13% slower on average.
| OCZ Octane 512GB Desktop GeForce GTX 470, 2600K, OCZ Octane OCT1-25SAT3-512G | ADATA S510 120GB Desktop GeForce GTS 450, 2600K, ADATA S510 S510S3-120GM-C | Samsung SSD 470 Desktop GeForce GTX 470, 2600K, Samsung SSD 470 Series MZ-5PA256/EU | Intel SSD 320 Desktop Radeon HD 6450 GDDR5, 2600K, Intel SSD 320 Series SSDSA2CW300G310 | Intel SSD 510 250GB Desktop GeForce GTX 470, 2600K, Intel SSD 510 Series SSDSC2MH250A2K5 | OCZ Agility 3 240GB Desktop Radeon HD 6450 GDDR5, 2600K, OCZ Agility 3 AGT3-25SAT3-240G | Schenker XMG A701 GeForce GT 540M, 2630QM, OCZ Vertex 3 VTX3-25SAT3-240G | |
|---|---|---|---|---|---|---|---|
| CrystalDiskMark 3.0 | -59% | -39% | -41% | -7% | -43% | -13% | |
| Read Seq (MB/s) | 505 | 213.7 -58% | 264.3 -48% | 277 -45% | 486 -4% | 220.7 -56% | 478 -5% |
| Write Seq (MB/s) | 364 | 144 -60% | 257.2 -29% | 230 -37% | 327 -10% | 255 -30% | 293 -20% |
| AS SSD | -62% | -43% | -55% | -13% | -48% | -17% | |
| Seq Read (MB/s) | 484 | 204.6 -58% | 251 -48% | 165 -66% | 468 -3% | 212 -56% | 485.6 0% |
| Seq Write (MB/s) | 398 | 135.2 -66% | 245 -38% | 221 -44% | 308 -23% | 241 -39% | 266.6 -33% |
| Total Average (Program / Settings) | -61% /
-61% | -41% /
-41% | -48% /
-48% | -10% /
-10% | -46% /
-45% | -15% /
-15% |
4K Performance
It looks slightly different in the 4K benchmarks. While the Octane is still partly faster than its high-end competitors in the read tests, it rather ranges in the lower end in the write tests. However, read access is more important in typical use.
| OCZ Octane 512GB Desktop GeForce GTX 470, 2600K, OCZ Octane OCT1-25SAT3-512G | ADATA S510 120GB Desktop GeForce GTS 450, 2600K, ADATA S510 S510S3-120GM-C | Samsung SSD 470 Desktop GeForce GTX 470, 2600K, Samsung SSD 470 Series MZ-5PA256/EU | Intel SSD 320 Desktop Radeon HD 6450 GDDR5, 2600K, Intel SSD 320 Series SSDSA2CW300G310 | Intel SSD 510 250GB Desktop GeForce GTX 470, 2600K, Intel SSD 510 Series SSDSC2MH250A2K5 | OCZ Agility 3 240GB Desktop Radeon HD 6450 GDDR5, 2600K, OCZ Agility 3 AGT3-25SAT3-240G | Schenker XMG A701 GeForce GT 540M, 2630QM, OCZ Vertex 3 VTX3-25SAT3-240G | |
|---|---|---|---|---|---|---|---|
| CrystalDiskMark 3.0 | 15% | -11% | -17% | -16% | 50% | 56% | |
| Read 512 (MB/s) | 335 | 206.6 -38% | 201.2 -40% | 180 -46% | 335 0% | 210 -37% | 436 30% |
| Write 512 (MB/s) | 358 | 144 -60% | 253.7 -29% | 219 -39% | 303 -15% | 254 -29% | 292 -18% |
| Read 4k (MB/s) | 26.5 | 28.6 8% | 17.58 -34% | 21 -21% | 20.6 -22% | 28.6 8% | 26.7 1% |
| Write 4k (MB/s) | 46.9 | 81.7 74% | 57.2 22% | 40.2 -14% | 46.4 -1% | 81.4 74% | 83 77% |
| Read 4k QD32 (MB/s) | 145.5 | 102 -30% | 130 -11% | 142 -2% | 81.3 -44% | 145.6 0% | 192 32% |
| Write 4k QD32 (MB/s) | 58.9 | 139.5 137% | 75.3 28% | 70.8 20% | 50.1 -15% | 225.6 283% | 183 211% |
| AS SSD | 44% | 2% | -1% | -32% | 91% | 97% | |
| 4K Read (MB/s) | 23.5 | 18.02 -23% | 16.2 -31% | 18.7 -20% | 18.6 -21% | 18.7 -20% | 16.4 -30% |
| 4K Write (MB/s) | 38.7 | 65.2 68% | 49.1 27% | 34.4 -11% | 14.3 -63% | 63.2 63% | 43.9 13% |
| 4K-64 Read (MB/s) | 132.5 | 88.1 -34% | 113 -15% | 135 2% | 76.6 -42% | 140 6% | 184 39% |
| 4K-64 Write (MB/s) | 49.3 | 130.6 165% | 61.4 25% | 61 24% | 48.7 -1% | 205 316% | 229 365% |
| Total Average (Program / Settings) | 30% /
27% | -5% /
-6% | -9% /
-11% | -24% /
-22% | 71% /
66% | 77% /
72% |
Access Times
The access times of our Octane were also excellent. So, on average, the storage device is top. However, the performance gain should not really be noticeable as the results only differ from the second decimal place downwards.
| OCZ Octane 512GB Desktop GeForce GTX 470, 2600K, OCZ Octane OCT1-25SAT3-512G | ADATA S510 120GB Desktop GeForce GTS 450, 2600K, ADATA S510 S510S3-120GM-C | Samsung SSD 470 Desktop GeForce GTX 470, 2600K, Samsung SSD 470 Series MZ-5PA256/EU | Intel SSD 320 Desktop Radeon HD 6450 GDDR5, 2600K, Intel SSD 320 Series SSDSA2CW300G310 | Intel SSD 510 250GB Desktop GeForce GTX 470, 2600K, Intel SSD 510 Series SSDSC2MH250A2K5 | OCZ Agility 3 240GB Desktop Radeon HD 6450 GDDR5, 2600K, OCZ Agility 3 AGT3-25SAT3-240G | Schenker XMG A701 GeForce GT 540M, 2630QM, OCZ Vertex 3 VTX3-25SAT3-240G | |
|---|---|---|---|---|---|---|---|
| AS SSD | -182% | -27% | -17% | -119% | -180% | -124% | |
| Access Time Read * (ms) | 0.06 | 0.151 -152% | 0.108 -80% | 0.072 -20% | 0.203 -238% | 0.154 -157% | 0.082 -37% |
| Access Time Write * (ms) | 0.09 | 0.281 -212% | 0.066 27% | 0.102 -13% | 0.089 1% | 0.273 -203% | 0.28 -211% |
* ... smaller is better
IOMeter
In using the profiles IOMix from c't and Worstation, the IOMeter tests check the performance during typical desktop PCs and workstations use. The Octane is slightly slower than high-end SSDs (Intel 510 and Sandforce based ones like the Agility 3), but faster than mid-range SSDs like the Samsung SSD 470 or the ADATA S510 (also based on Sandforce, but featuring a cheaper asynchronous flash memory).
| IOMeter | |
| Workstation, 3min, 10GB Partition (sort by value) | |
| OCZ Octane 512GB Desktop | |
| ADATA S510 120GB Desktop | |
| Samsung SSD 470 Desktop | |
| Intel SSD 320 Desktop | |
| Intel SSD 510 250GB Desktop | |
| OCZ Agility 3 240GB Desktop | |
| IOMix, 5min, 10GB Partition (sort by value) | |
| OCZ Octane 512GB Desktop | |
| ADATA S510 120GB Desktop | |
| Samsung SSD 470 Desktop | |
| Intel SSD 320 Desktop | |
| Intel SSD 510 250GB Desktop | |
| OCZ Agility 3 240GB Desktop | |
Degrading
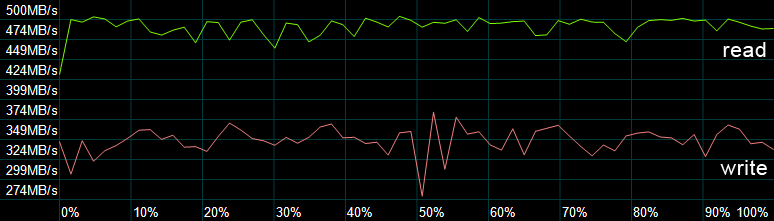
Performance drops of used SSDs are a known problem. These can not be completely avoided despite TRIM. In particular, after longer and heavy use, the performance of an SSD can clearly fall. This is only true for the Octane to a lesser extent. After two hours, the IOMix profile still achieved results comparable to those after short usage and the results usually ranged between 130 to 143 MB/s.
Interestingly, the sequential data rates were slightly lower with an Intel Core i7-3960X and an Intel pre-production mainboard (-6% in the read test and -15% in the write test). However, this can also be due to the pre-production state of the mainboard. So, we did not record these benchmarks in our database.
Compressed Data
In the AS SSD Compression Benchmark Chart, you can see that the Octane Controller does not depend on the compressibility of data at first glance. So, it can copy poorly compressible data considerably faster than current Sandforce models (e.g., see the figure in the Agility 3 test).
System Performance - PCMark7
PCMark 7 should record the general system performance by means of many tests. Here the Octane is slower than the Intel SSD 510 and the older Samsung SSD 470. It cannot be said that it is especially weak in one of the categories and the maximum difference of 8% is also very low.
| OCZ Octane 512GB Desktop GeForce GTX 470, 2600K, OCZ Octane OCT1-25SAT3-512G | Intel SSD 510 250GB Desktop GeForce GTX 470, 2600K, Intel SSD 510 Series SSDSC2MH250A2K5 | Samsung SSD 470 Desktop GeForce GTX 470, 2600K, Samsung SSD 470 Series MZ-5PA256/EU | |
|---|---|---|---|
| PCMark 7 | |||
| System Storage (Points) | 5194 | 4592 | |
| Computation (Points) | 4755 | 4736 | |
| Creativity (Points) | 5412 | 5059 | |
| Entertainment (Points) | 4705 | 4638 | |
| Productivity (Points) | 4755 | 4343 | |
| Lightweight (Points) | 5106 | 4636 | |
| Score (Points) | 4944 | 4760 |
| PCMark Vantage - 1024x768 HDD Score (sort by value) | |
| OCZ Octane 512GB Desktop | |
| ADATA S510 120GB Desktop | |
| Samsung SSD 470 Desktop | |
| Intel SSD 320 Desktop | |
| Intel SSD 510 250GB Desktop | |
| OCZ Agility 3 240GB Desktop | |
| Schenker XMG A701 | |
Copying Data
We used the copy benchmarks integrated in AS SSD to check the performance while copying data. The Octane achieves excellent results here too and can partly clearly outperform its competitors. Interestingly, the performance clearly fluctuated during the test. In the ISO sub test it even achieved a maximum rate of 388 MB/s.
| AS SSD | |
| Copy Game MB/s (sort by value) | |
| OCZ Octane 512GB Desktop | |
| ADATA S510 120GB Desktop | |
| Samsung SSD 470 Desktop | |
| Intel SSD 320 Desktop | |
| Intel SSD 510 250GB Desktop | |
| OCZ Agility 3 240GB Desktop | |
| Schenker XMG A701 | |
| Copy Program MB/s (sort by value) | |
| OCZ Octane 512GB Desktop | |
| ADATA S510 120GB Desktop | |
| Samsung SSD 470 Desktop | |
| Intel SSD 320 Desktop | |
| Intel SSD 510 250GB Desktop | |
| OCZ Agility 3 240GB Desktop | |
| Schenker XMG A701 | |
| Copy ISO MB/s (sort by value) | |
| OCZ Octane 512GB Desktop | |
| ADATA S510 120GB Desktop | |
| Samsung SSD 470 Desktop | |
| Intel SSD 320 Desktop | |
| Intel SSD 510 250GB Desktop | |
| OCZ Agility 3 240GB Desktop | |
| Schenker XMG A701 | |
Real Tests
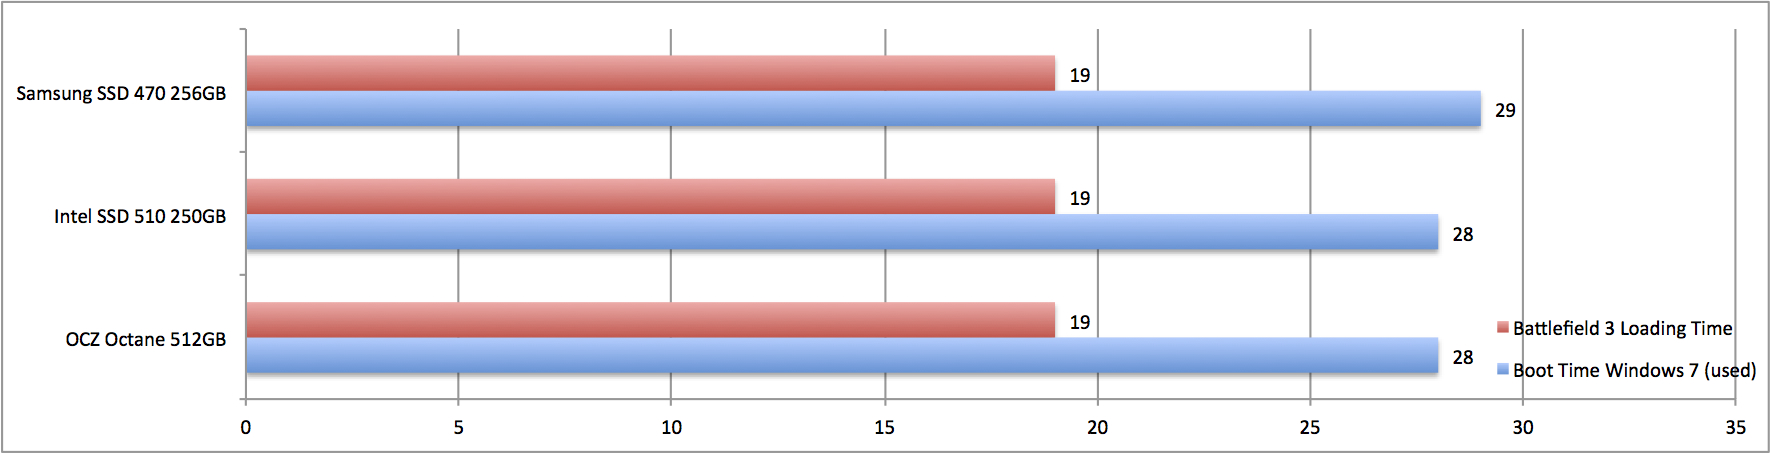
In addition to the synthetic tests, we also ran two real-world tests and compared the results with the Intel SSD 510 and the Samsung SSD 470. First of all, we measured the boot times of a used Windows 7 64 Bit installation. OCZ advertises a special optimization called "Boot Time Reduction Optimization". However, it was not measurably faster than the Intel 510 in our tests (average of several tries). The difference to the older Samsung SSD 470 is also marginal.
In our second test, we started the demanding Battlefield 3 in offline mode. The time until the intro videos start is the same for all contenders (19 s). In comparison, loading from the relatively fast desktop HDD, Samsung HD103SJ (1TB 7200RPM), it took an agonizingly long 75 seconds.
Verdict

The first SSD with Indilinx Controller after it was bought by OCZ is impressive. The performance convinces and is top in many categories. Just the 4K write performance could be better. Poorly compressible data are no problem for the Octane - contrary to current Sandforce models.
Because of its steep price (770 - 1000 Euros), the 512 GB model unfortunately is not the model bought most often. The cheaper models with lower capacity are also slower. At the time of writing, the price of the Octane (SATA 3, 6GBits) is between the Agility 3 and the Vertex 3. So, the price performance ratio is absolutely fair.
The new controller will have to prove how well it performs in terms of reliability in the next few months. Sandforce based SSDs had some problems in the past months (e.g., blue screen). With a warranty of 3 years, it is at least protected longer than the usual lifetime of a PC. Nevertheless, the user is responsible for data security (backup).
Update 2012-01-23: OCZ has just released a new firmware version (v1.13) for the 6GBps Octane which should improve the random 4K write:
For all Octane SATA 6Gb/s models, the improved IOPS made possible by this new firmware allow for greater transactional performance, especially during small file and random access speeds in everyday computing applications. When compared to the previous revision, random write IOPS performance doubles across nearly all capacities when tested in Iometer 2008:
Old Random Write 4K IOPS (FW v1.12) | New Random Write 4K IOPS (FW v1.13) | |
| Octane 128GB | 7,700 | 18,000 |
| Octane 256GB | 12,000 | 25,000 |
| Octane 512GB | 16,000 | 26,000 |

