Notebookcheck Logo

Rockchip RK3066 1.5 GHz vs HiSilicon Kirin 620 vs HiSilicon Kirin 650

Rockchip RK3066 1.5 GHz

► remove from comparison  RK3066

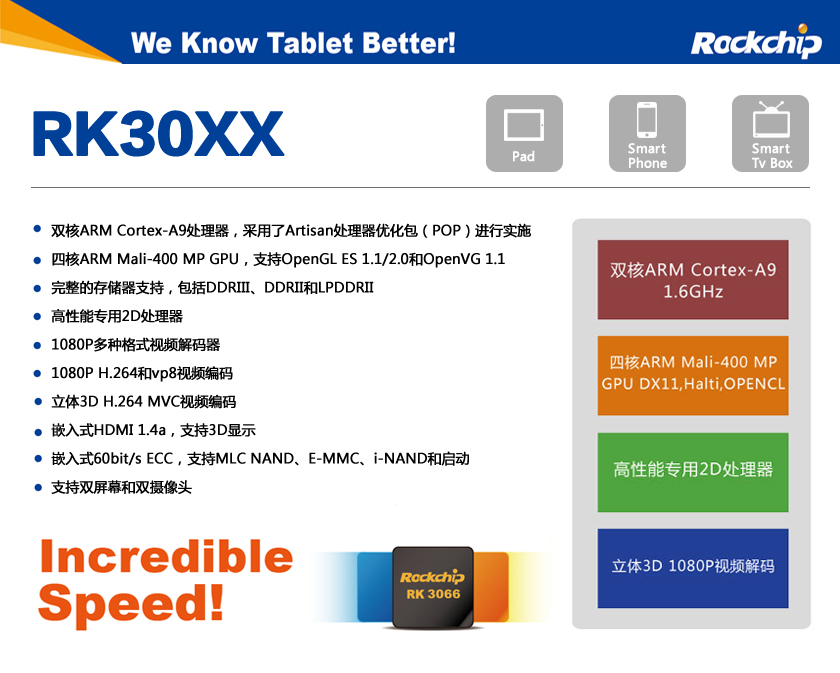
The Rockchip RK3066 is a cheap ARM based SoC for Tablets and Smartphones. It integrates two ARM Cortex-A9 (ARMv7) CPU cores with NEON extensions, a ARM Mali-400MP4 (quad-core clocked at 250 MHz) graphics card and a video de- and encoder as main components. The integrated memory controller supports a maximum of 2 GB DDR1, DDR2 or DDR3 memory.

The CPU cores can be clocked up to 1.6 GHz depending on the cooling solution of the tablet / smartphone.

Additional Features according to Wikipedia

  • VPU (Video Processing Unit) Multi-Media Processor supporting 1080p image and video decoding
  • HDMI 1.4 Interface
  • 2-channels TFT LCD Interface with 5 layers and 3D Display (1920×1080 Maximum Display Size)
  • USB 2.0 Interface
  • SD/MMC Interface

HiSilicon Kirin 620

► remove from comparison  Kirin 620

The HiSilicon Kirin 620 is an ARM-based octa core SoC for mid-range smartphones. It was announced at the end of 2014 and features eight ARM Cortex-A53 cores at 1.2 GHz (max.). Furthermore, the processor integrates a ARM Mali-450 MP4 graphics card, an LPDDR3 memory controller, an LTE Cat.4 modem, 802.11n WiFi and Bluetooth 4.0. The chip is manufactured in 28nm and relatively power efficient.

HiSilicon Kirin 650

► remove from comparison  Kirin 650

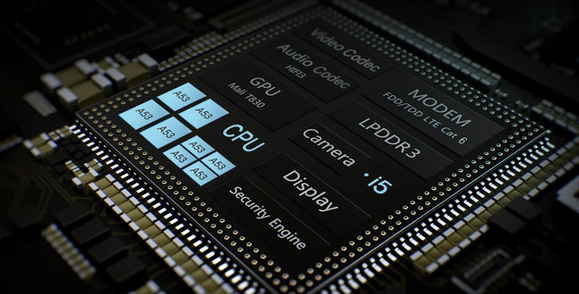
The HiSilicon Kirin 650 is an ARM-based octa-core SoC for mid-range smartphones and tablets. It was announced early 2016 and features eight ARM Cortex-A53 cores. Four cores can be clocked with up to 1.7 GHz (power saving cores) and four with up to 2 GHz (performance cores). Furthermore, a ARM Mali-T830 MP2 graphics card (at 600 MHz with 40.8 GFLOPS), a 64-Bit LPDDR3 memory controller and a dual-sim capable LTE Cat. 6 (max. 300 MBit/s and GSM, WCDMA, UMTS, HSPA+) radio are integrated in the SoC.

The processor performance can be compared with the older Kirin 930 and therefore sufficient for daily usage as browsing and non demanding apps. High-end SoCs with Cortex-A57 or A72 cores however should be noticeably faster.

The SoC is produced in a modern 16nm FinFET process and is therefore very power efficient.


ModelRockchip RK3066 1.5 GHzHiSilicon Kirin 620HiSilicon Kirin 650
Series
Series: Cortex-A53
newitem cores
HiSilicon Kirin 9000W1.53 - 2.49 GHz12 / 12 cores
UNISOC Tiger T3101.8 - 2 GHz4 / 4 cores
Rockchip RK32881.8 GHz4 / 4 cores
Apple A6x1.4 GHzcores
Apple A61 GHzcores
Apple S52 / 2 cores
HiSilicon k3v2 Hi36201.2 GHz4 / 4 cores
Rockchip RK3066 1.5 GHz « 1.5 GHz2 / 2 cores
Amlogic AML8726-MX1.5 GHz2 / 2 cores
Rockchip RK31681.2 GHz2 / 2 cores
Rockchip RK2918 1.2 GHz1.2 GHz1 / 1 cores
ARM Cortex A8 1.2 GHz1.2 GHz1 / 1 cores
Telechips TCC8803 1GHz1 GHz1 / 1 cores
Loongson 2F 900MHz0.9 GHz1 / 1 cores
CSR86700.08 GHzcores
ARM Cortex-M4 cores
HiSilicon Hi6262 cores
DK3.5+STcores
unknown cores
JLQ JR5101.5 - 2 GHz8 / 8 cores Cortex-A53
HiSilicon Kirin 9352.2 GHz8 / 8 cores Cortex-A53
HiSilicon Kirin 6592.36 GHz8 / 8 cores Cortex-A53
HiSilicon Kirin 6582.35 GHz8 / 8 cores Cortex-A53
HiSilicon Kirin 6552.1 GHz8 / 8 cores Cortex-A53
HiSilicon Kirin 6502 GHz8 / 8 cores Cortex-A53
HiSilicon Kirin 9302 GHz8 / 8 cores Cortex-A53
HiSilicon Kirin 620 « 1.2 GHz8 / 8 cores Cortex-A53
MediaTek MT8163 V/A 1.5 GHz1.5 GHz4 / 4 cores Cortex-A53
MediaTek MT8163 V/B 1.3 GHz1.3 GHz4 / 4 cores Cortex-A53
MediaTek MT81611.3 GHz4 / 4 cores Cortex-A53
Marvell Armada PXA19081.2 GHz4 / 4 cores Cortex-A53
JLQ JR5101.5 - 2 GHz8 / 8 cores Cortex-A53
HiSilicon Kirin 9352.2 GHz8 / 8 cores Cortex-A53
HiSilicon Kirin 6592.36 GHz8 / 8 cores Cortex-A53
HiSilicon Kirin 6582.35 GHz8 / 8 cores Cortex-A53
HiSilicon Kirin 6552.1 GHz8 / 8 cores Cortex-A53
HiSilicon Kirin 650 « 2 GHz8 / 8 cores Cortex-A53
HiSilicon Kirin 9302 GHz8 / 8 cores Cortex-A53
HiSilicon Kirin 6201.2 GHz8 / 8 cores Cortex-A53
MediaTek MT8163 V/A 1.5 GHz1.5 GHz4 / 4 cores Cortex-A53
MediaTek MT8163 V/B 1.3 GHz1.3 GHz4 / 4 cores Cortex-A53
MediaTek MT81611.3 GHz4 / 4 cores Cortex-A53
Marvell Armada PXA19081.2 GHz4 / 4 cores Cortex-A53
Clock1500 MHz1200 MHz2000 MHz
L2 Cache512 KB
Cores / Threads2 / 28 / 88 / 8
Technology40 nm28 nm16 nm
FeaturesMali-400 MP4, Single Channel DDR3 Memory ControllerARMv8-ISA, Mali-450 MP4, LTE (Cat. 4), LPDDR3 Memory ControllerARMv8-ISA, Mali-T830 MP2, Dual SIM LTE (Cat. 6), LPDDR3 Memory Controller
iGPUARM Mali-400 MP4 (250 MHz)ARM Mali-450 MP4ARM Mali-T830 MP2 (900 MHz)
ArchitectureARMARMARM
Announced
Manufacturerwww.rock-chips.com
CodenameCortex-A53Cortex-A53

Benchmarks

3DMark - 3DMark Ice Storm Physics
100%
1 RK3066 +
min: 4687     avg: 4990     median: 5059 (4%)     max: 5161 Points
min: 6531     avg: 6885     median: 6884.5 (6%)     max: 7238 Points
3DMark - 3DMark Ice Storm Extreme Physics
4890 Points (4%)
min: 6434     avg: 6917     median: 6916.5 (6%)     max: 7399 Points
11640 Points (9%)
3DMark - 3DMark Ice Storm Unlimited Physics
min: 6861     avg: 7534     median: 7533.5 (6%)     max: 8206 Points
min: 13588     avg: 13632     median: 13632 (11%)     max: 13676 Points
3DMark - 3DMark Sling Shot Extreme (ES 3.1) Unlimited Physics
1440 Points (17%)
Geekbench 3 - Geekbench 3 64 Bit Multi-Core
min: 2151     avg: 2453     median: 2452.5 (4%)     max: 2754 Points
min: 3768     avg: 3841     median: 3841 (6%)     max: 3914 Points
Geekbench 3 - Geekbench 3 64 Bit Single-Core
min: 541     avg: 565     median: 564.5 (8%)     max: 588 Points
min: 883     avg: 895     median: 894.5 (13%)     max: 906 Points
Geekbench 2 - 32 Bit - Geekbench Stream
100%
1 RK3066 +
min: 206     avg: 398.6     median: 390 (3%)     max: 621 Points
Geekbench 2 - 32 Bit - Geekbench Memory
100%
1 RK3066 +
min: 389     avg: 1072     median: 1071 (10%)     max: 1439 Points
Geekbench 2 - 32 Bit - Geekbench Floating Point
100%
1 RK3066 +
min: 843     avg: 1408     median: 1342 (3%)     max: 2107 Points
Geekbench 2 - 32 Bit - Geekbench Integer
100%
1 RK3066 +
min: 490     avg: 798     median: 788.5 (2%)     max: 1201 Points
Geekbench 2 - 32 Bit - Geekbench Total Score
100%
1 RK3066 +
min: 694     avg: 1026     median: 1007.5 (3%)     max: 1518 Points
Linpack Android / IOS - Linpack Multi Thread
100%
1 RK3066 +
min: 50.7     avg: 80     median: 82.5 (3%)     max: 104.6 MFLOPS
166 MFLOPS (6%)
Linpack Android / IOS - Linpack Single Thread
100%
1 RK3066 +
min: 24.87     avg: 52.1     median: 54.8 (5%)     max: 62.1 MFLOPS
52 MFLOPS (5%)
Mozilla Kraken 1.1 - Kraken 1.1 Total Score *
min: 15866     avg: 17376     median: 17375.5 (20%)     max: 18885 ms
min: 9111     avg: 9254     median: 9254 (11%)     max: 9397 ms
Sunspider - Sunspider 1.0 Total Score *
100%
1 RK3066 +
1959 ms (21%)
min: 1373     avg: 1680     median: 1679.5 (18%)     max: 1986 ms
Sunspider - Sunspider 0.9.1 Total Score *
100%
1 RK3066 +
min: 1150     avg: 1418     median: 1355.5 (13%)     max: 1884 ms
Octane V2 - Octane V2 Total Score
min: 1857     avg: 2170     median: 2170 (2%)     max: 2483 Points
min: 4188     avg: 4472     median: 4472 (4%)     max: 4756 Points
Vellamo 3.x - Vellamo 3.x Metal
907 Points (24%)
1434 Points (38%)
Vellamo 3.x - Vellamo 3.x Multicore Beta
1104 Points (25%)
1965 Points (44%)
Vellamo 3.x - Vellamo 3.x Browser
1146 Points (15%)
3356 Points (44%)
Quadrant Standard Edition 2.0 - Quadrant Standard 2.0 Total Score
100%
1 RK3066 +
min: 3105     avg: 3862     median: 3974 (9%)     max: 4257 points
AnTuTu v3 - AnTuTu v3 CPU
100%
1 RK3066 +
min: 2135     avg: 3577     median: 3734 (24%)     max: 4267 Points
AnTuTu v5 - AnTuTu v5 Total Score
min: 30558     avg: 32403     median: 32402.5 (33%)     max: 34247 Points
AnTuTu v6 - AnTuTu v6 Total Score
min: 50366     avg: 51755     median: 51754.5 (18%)     max: 53143 Points
PassMark PerformanceTest Mobile V1 - PerformanceTest Mobile V1 CPU Tests
100%
1 RK3066 +
5852 Points (1%)
2436%
1 Kirin 650 +
142543 Points (19%)
PCMark for Android - PCM f. Android Work Score
3717 Points (19%)
min: 5120     avg: 5230     median: 5229.5 (26%)     max: 5339 Points

Average Benchmarks Rockchip RK3066 1.5 GHz → 100% n=1

Average Benchmarks HiSilicon Kirin 620 → 141% n=1

Average Benchmarks HiSilicon Kirin 650 → 238% n=1

- Range of benchmark values for this graphics card
- Average benchmark values for this graphics card
* Smaller numbers mean a higher performance
1 This benchmark is not used for the average calculation

v1.27
log 03. 15:54:45

#0 checking url part for id 3576 +0s ... 0s

#1 checking url part for id 6667 +0s ... 0s

#2 checking url part for id 8075 +0s ... 0s

#3 not redirecting to Ajax server +0s ... 0s

#4 did not recreate cache, as it is less than 5 days old! Created at Sat, 01 Jun 2024 05:37:57 +0200 +0.001s ... 0.001s

#5 composed specs +0.107s ... 0.108s

#6 did output specs +0s ... 0.108s

#7 getting avg benchmarks for device 3576 +0.004s ... 0.112s

#8 got single benchmarks 3576 +0.021s ... 0.134s

#9 getting avg benchmarks for device 6667 +0.003s ... 0.137s

#10 got single benchmarks 6667 +0.009s ... 0.145s

#11 getting avg benchmarks for device 8075 +0.003s ... 0.148s

#12 got single benchmarks 8075 +0.009s ... 0.158s

#13 got avg benchmarks for devices +0s ... 0.158s

#14 min, max, avg, median took s +0.146s ... 0.303s

#15 return log +0s ... 0.304s

Please share our article, every link counts!
> Expert Reviews and News on Laptops, Smartphones and Tech Innovations > Benchmarks / Tech > Processor Comparison - Head 2 Head
Redaktion, 2017-09- 8 (Update: 2023-07- 1)