

PowerVR G6200 vs Qualcomm Adreno 510
PowerVR G6200
► remove from comparison
The PowerVR G6200 from Imagination Technologies is a mobile graphics solution that is used in ARM SoCs like the MediaTek MT8135. The chip is available since 2014 and designed for mid-range devices.
Architecture and Performance
The GPU is based on the series 6 (Rogue) and integrates two clusters with two TMUs each and a scalar Unified Shader architecture. Depending on the available memory bandwidth and clock rate, the performance is similar to the Qualcomm Adreno 320 and ARM Mali-T624 MP4. High-resolution displays (up to 2560 x 1600 pixels) and demanding mobile games of 2014 will be handled without problems. Among others, the GPU supports OpenGL 3.x/4.x, OpenGL ES 3.0 as well as DirectX 10.
Clock rates and performance of the G6200 may vary between different SoCs. For example, the Mediatek MT6795 has a somewhat higher GPU frequency than the MT8135 (700 vs. 600 MHz).
Energy Consumption
Especially the lower clocked versions of the G6200 are very energy efficient and therefore suited for medium-sized smartphones and tablets. Usually, the GPU can be found in SoCs manufactured in 28nm.
Qualcomm Adreno 510
► remove from comparison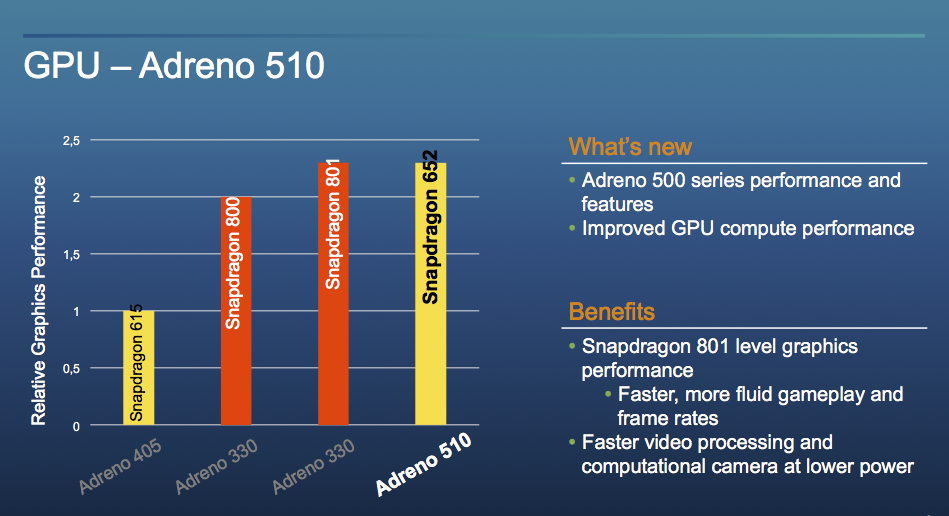
The Qualcomm Adreno 510 is a mobile graphics card for mid-range smartphones and tablets (mostly Android based). It is included in the Qualcomm Snapdragon 650 and 652 SoCs and based on the Adreno 500 architecture (like the Adreno 520 in the S820, which should be fully compatible in software).
The GPU supports modern standards like Vulkan 1.0 (according to Wikipedia), OpenGL ES 3.1 + AE (3.2 in other sources), OpenCL 2.0 and DirectX 12 (FL 12.1 according to Wikipedia, 11.1 according to Qualcomm). Furthermore, the GPU supports Universal Bandwidth Compression (UBWC) to save memory bandwidth.
Compared the the faster Adreno 530, the 510 is currently produced in the older 28nm process (650 and 652) and should offer less ALUs. The clock speed is not disclosed.
Early benchmarks and performance ratings from Qualcomm position the GPU on a level with the old Adreno 330 (former high end GPU) in the Snapdragon 810. Therefore, it should be able to handle most Android games up to Full HD fluently.
| PowerVR G6200 | Qualcomm Adreno 510 | |||||||||||||||||||||||||||||||||||||
| Adreno 500 Series |
|
| ||||||||||||||||||||||||||||||||||||
| Codename | Rogue | |||||||||||||||||||||||||||||||||||||
| Architecture | PowerVR Rogue | Adreno 500 | ||||||||||||||||||||||||||||||||||||
| Pipelines | 64 - unified | |||||||||||||||||||||||||||||||||||||
| Core Speed | 450 - 700 MHz | |||||||||||||||||||||||||||||||||||||
| Shared Memory | no | yes | ||||||||||||||||||||||||||||||||||||
| API | DirectX 10, OpenGL 3.x, 4.x, OpenGL ES 3.1 | DirectX 12.1, OpenGL ES 3.2, Vulkan | ||||||||||||||||||||||||||||||||||||
| Features | OpenGL 3.x, 4.x, OpenGL ES 3.1 | OpenGL ES 3.2, OpenCL 2.0, Direct3D 12 (FL 12_1) | ||||||||||||||||||||||||||||||||||||
| Date of Announcement | 10.09.2013 | 15.12.2015 | ||||||||||||||||||||||||||||||||||||
| Link to Manufacturer Page | www.imgtec.com | |||||||||||||||||||||||||||||||||||||
| technology | 14 nm |
|
| ||||||||||||||||||||||||||||||||||||||||
Benchmarks
GFXBench T-Rex HD Offscreen C24Z16 + PowerVR G6200
Average Benchmarks PowerVR G6200 → 100% n=8
Average Benchmarks Qualcomm Adreno 510 → 192% n=8
* Smaller numbers mean a higher performance
1 This benchmark is not used for the average calculation
Game Benchmarks
The following benchmarks stem from our benchmarks of review laptops. The performance depends on the used graphics memory, clock rate, processor, system settings, drivers, and operating systems. So the results don't have to be representative for all laptops with this GPU. For detailed information on the benchmark results, click on the fps number.

| PowerVR G6200 | Qualcomm Adreno 510 | |||||||||||||
|---|---|---|---|---|---|---|---|---|---|---|---|---|---|---|
| low | med. | high | ultra | QHD | 4K | low | med. | high | ultra | QHD | 4K | |||
| Dead Trigger 2 | 49 | |||||||||||||
| Asphalt 8: Airborne | 30 | 27 | ||||||||||||
| PowerVR G6200 | Qualcomm Adreno 510 | |||||||||||||
| low | med. | high | ultra | QHD | 4K | low | med. | high | ultra | QHD | 4K | < 30 fps < 60 fps < 120 fps ≥ 120 fps | | | | | | | < 30 fps < 60 fps < 120 fps ≥ 120 fps | 1 | | 1 1 | | | |
For more games that might be playable and a list of all games and graphics cards visit our Gaming List