

Apple M1 vs Apple M4 (10 cores)
Apple M1
► remove from comparison
The Apple M1 is a System on a Chip (SoC) from Apple that is found in the late 2020 MacBook Air, MacBook Pro 13, and Mac Mini. It offers 8 cores divided in four performance cores and four power-efficiency cores. The big cores offer 192 KB instruction cache, 128 KB data cache, and 12 MB shared L2 cache. According to Apple the performance of these cores should be better than anything on the market (in late 2020). The four efficiency cores are a lot smaller and offer only 128 KB instruction cache, 64 KB data cache, and 4 MB shared cache. The efficiency cores (E cluster) clock with 600 - 2064 MHz, the performance cores (P cluster) with 600 - 3204 MHz.
The M1 is available in two TDP variants, a passive cooled 10 Watt variant for the MacBook Air and an active cooled faster variant for the MacBook Pro 13 and Mac Mini. Those should offer a better-sustained performance according to Apple.
The integrated graphics card in the M1 offers 8 cores (7 cores in the entry MacBook Air) and a peak performance of 2.6 teraflops. Apple claims that it is faster than any other iGPU at the time of announcement.
Furthermore, the SoC integrates a fast 16 core neural engine with a peak performance of 11 TOPS (for AI hardware acceleration), a secure enclave (e.g., for encryption), a unified memory architecture, Thunderbolt / USB 4 controller, an ISP, and media de- and encoders.
The Apple M1 includes 16 billion transistors (up from the 10 billion of the A12Z Bionic and therefore double the amount of a Tiger Lake-U chip like the i7-1185G7) and is manufactured in 5nm at TSMC.
Apple M4 (10 cores)
► remove from comparison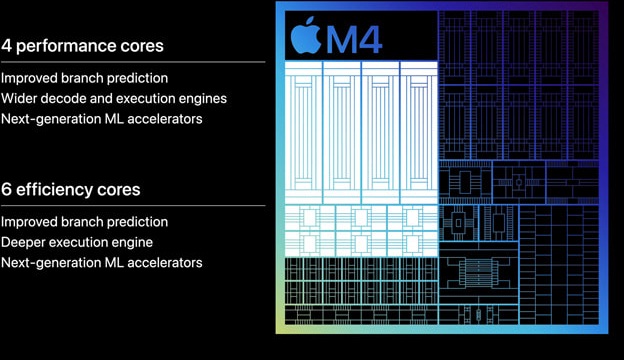
The 10-core Apple M4 is an impressively fast ARM architecture processor (SoC) sporting 4 performance and 6 efficient CPU cores along with a 16-core neural engine and a 10-core GPU with hardware RT support and other modern features. On-package 7500 MT/s LPDDR5x RAM, USB 4 support and Thunderbolt 4 support are onboard as well, as are Wi-Fi 6E and Bluetooth 5.3.
The M4 debuted in May 2024 as part of an iPad launch event; its 4 performance cores run at up to 4.4 GHz, representing a healthy improvement over the M3 (10-core GPU) and its 4.06 GHz top clock speed. Besides, this new chip also has 6 efficient cores at its disposal that run at up to 2.9 GHz. The M3 had to make do with 4 performance cores and 4 efficient cores, for reference.
Architecture and Features
The new CPU cores run at faster clock speeds than what the M3 was capable of while also featuring some minor architectural improvements. A heavily customized version of ARM's v9.4-A microarchitecture is reportedly employed here. The M4 comes with on-package LPDDR5x-7500 RAM (120 GB/s) whereas the M3 was limited to 6400 MT/s. The updated NPU delivers up to 38 TOPS of performance for AI workloads.
Performance
In 2024 iPad Pros, the 3 nm chip is 10% to 20% faster than the M3 (10 GPU cores) in both multi-thread and single-thread short-term workloads. It also delivers about 10% higher multi-thread performance than the 9-core M4. This puts the 10-core part on an equal footing with the Ryzen 7 7745HX, Core i7-13705H and other higher-end x86 processors released in 2023 and 2024.
iPad Pros come with no active cooling solution however Mac minis and MacBook Pros do have one and the latest iMacs probably do as well. As our Fall 2024 Mac mini review shows, the M4's short-term performance doesn't benefit much from the presence of a fan, however its sustained performance benefits tremendously.
Graphics
The M4 GPU (10 cores) has hardware support for ray tracing as well as mesh shading and other modern technologies. It supports external displays with resolutions as high as 8K.
The graphics adapter runs at higher clock speeds than what the (otherwise identical) 10-core GPU built into the 9-core M4 can muster. As our Mac mini 2024 review confirmed, its performance is good enough to run many 2023 and 2024 games at 1080p on low or medium quality settings.
- Сyberpunk 2077 2.1 Phantom Liberty (1080p, Med): 28 fps
Much like it is with CPU performance, M4-powered iPad Pros will be much slower in long-term GPU-intensive workloads than iMacs, Mac minis and MacBook Pros due to the lack of proper cooling.
Power consumption
This specific M4 chip is found in 2024 iPad Pros, 2024 iMacs, 2024 Mac minis and 2024 MacBook Pros. Within the thin metal cases of the iPads - no active cooling - the chip's sustained power consumption hovers in the 4 W - 5 W area, with short-term peaks of up to 14 W possible. However, Mac minis and MacBook Pros do have an active cooling solution (and the new iMacs probably do, too) meaning the power consumption figures are several times higher. In our Fall 2024 Mac mini review, the SoC consumed 30 W to 40 W when under high loads.
The M4 is built with a "second generation" 3 nm TSMC process which is still cutting-edge as of late 2024.
| Model | Apple M1 | Apple M4 (10 cores) | ||||||||||||||||||||||||||||||||||||||||||||
| Series | Apple M1 | Apple M4 | ||||||||||||||||||||||||||||||||||||||||||||
| Series: M4 |
|
| ||||||||||||||||||||||||||||||||||||||||||||
| Clock | 2064 - 3220 MHz | 2890 - 4464 MHz | ||||||||||||||||||||||||||||||||||||||||||||
| L1 Cache | 2 MB | |||||||||||||||||||||||||||||||||||||||||||||
| L2 Cache | 16 MB | 4 MB | ||||||||||||||||||||||||||||||||||||||||||||
| L3 Cache | 8 MB | |||||||||||||||||||||||||||||||||||||||||||||
| Cores / Threads | 8 / 8 | 10 / 10 4 x 4.5 GHz Apple M4 P-Core 6 x 2.9 GHz Apple M4 E-Core | ||||||||||||||||||||||||||||||||||||||||||||
| Transistors | 16000 Million | 28 Million | ||||||||||||||||||||||||||||||||||||||||||||
| Technology | 5 nm | 3 nm | ||||||||||||||||||||||||||||||||||||||||||||
| Features | ARMv8 Instruction Set | Unified Memory LPDDR5X-7500 (120 GB/s), 16-Core Neural Engine, Media Engine (Encoding / Decoding: H.264, HEVC, ProRes, ProRes RAW, AV1 Decoding only) | ||||||||||||||||||||||||||||||||||||||||||||
| iGPU | Apple M1 8-Core GPU | Apple M4 10-core GPU | ||||||||||||||||||||||||||||||||||||||||||||
| Chip AI | 11 TOPS INT8 | |||||||||||||||||||||||||||||||||||||||||||||
| Architecture | ARM | ARM | ||||||||||||||||||||||||||||||||||||||||||||
| Announced | ||||||||||||||||||||||||||||||||||||||||||||||
| TDP | 40 Watt | |||||||||||||||||||||||||||||||||||||||||||||
| TDP Turbo PL2 | 40 Watt | |||||||||||||||||||||||||||||||||||||||||||||
| NPU / AI | 38 TOPS INT8 |

Benchmarks

Average Benchmarks Apple M1 → 100% n=16
Average Benchmarks Apple M4 (10 cores) → 173% n=16
* Smaller numbers mean a higher performance
1 This benchmark is not used for the average calculation