

Apple M1 Max 24-Core GPU vs AMD Radeon Pro 5300M vs Apple M1 7-Core GPU
Apple M1 Max 24-Core GPU
► remove from comparison
The Apple M1 Max 24-Core-GPU is an integrated graphics card by Apple offering 24 of the 32 cores in the M1 Max Chip. The 3,072 ALUs offer a theoretical performance of up to 8 Teraflops.
The graphics card has no dedicated graphics memory but can use the fast LPDDR5-6400 unified memory with a 512 bit bus (up to 400 GBit/s).
The GPU clocks between 389 and 1296 MHz and offers no short term boost (389, 486, 648, 778, 972, 1296 MHz steps according to Powermetrics). The GPU is intended to use Apple Metal 2 API and could still be based on the older PowerVR architectures (last used in the Apple A10).
The Apple M1 Max is manufactured in the modern 5nm process at TSMC and offers an excellent energy efficiency.
AMD Radeon Pro 5300M
► remove from comparison
The AMD Radeon Pro 5300M is a dedicated mobile mid-range graphics card for laptops. It uses the new Navi 14 chip (RDNA architecture) which is produced in 7nm. The Pro 5300M was announced in the entry level Apple MacBook Pro 16 in late 2019 and features 4 GB of GDDR6 VRAM. Compared to the similar named Radeon RX 5300M, the Pro 5300M features different specifications with 20 instead of 22 CUs and the full 128 Bit memory bus but reduced clock speeds.
The Navi 14 chip uses the new RDNA (Radeon DNA) microarchitecture which is a successor the the GCN instruction set. It features a new processor design, a multi-level cache hierarchy and an improved rendering pipeline with support for GDDR6 memory.
The RX5300M competes directly with the GeForce GTX 1650 and should offer a similar gaming performance. Therefore, we expect the Radeon Pro 5300M to offer a similar performance. The faster Radeon Pro 5500M in the higher end versions of the MBP16 is faster and compares against a GeForce GTX 1660 Ti.
The mobile RX5300M is specified with a TDP of 65 Watt (versus 85W of the RX 5500M). The "Pro" version however is specified at 50 Watt TGP and therefore the same as the faster Radeon Pro 5500M.
Apple M1 7-Core GPU
► remove from comparison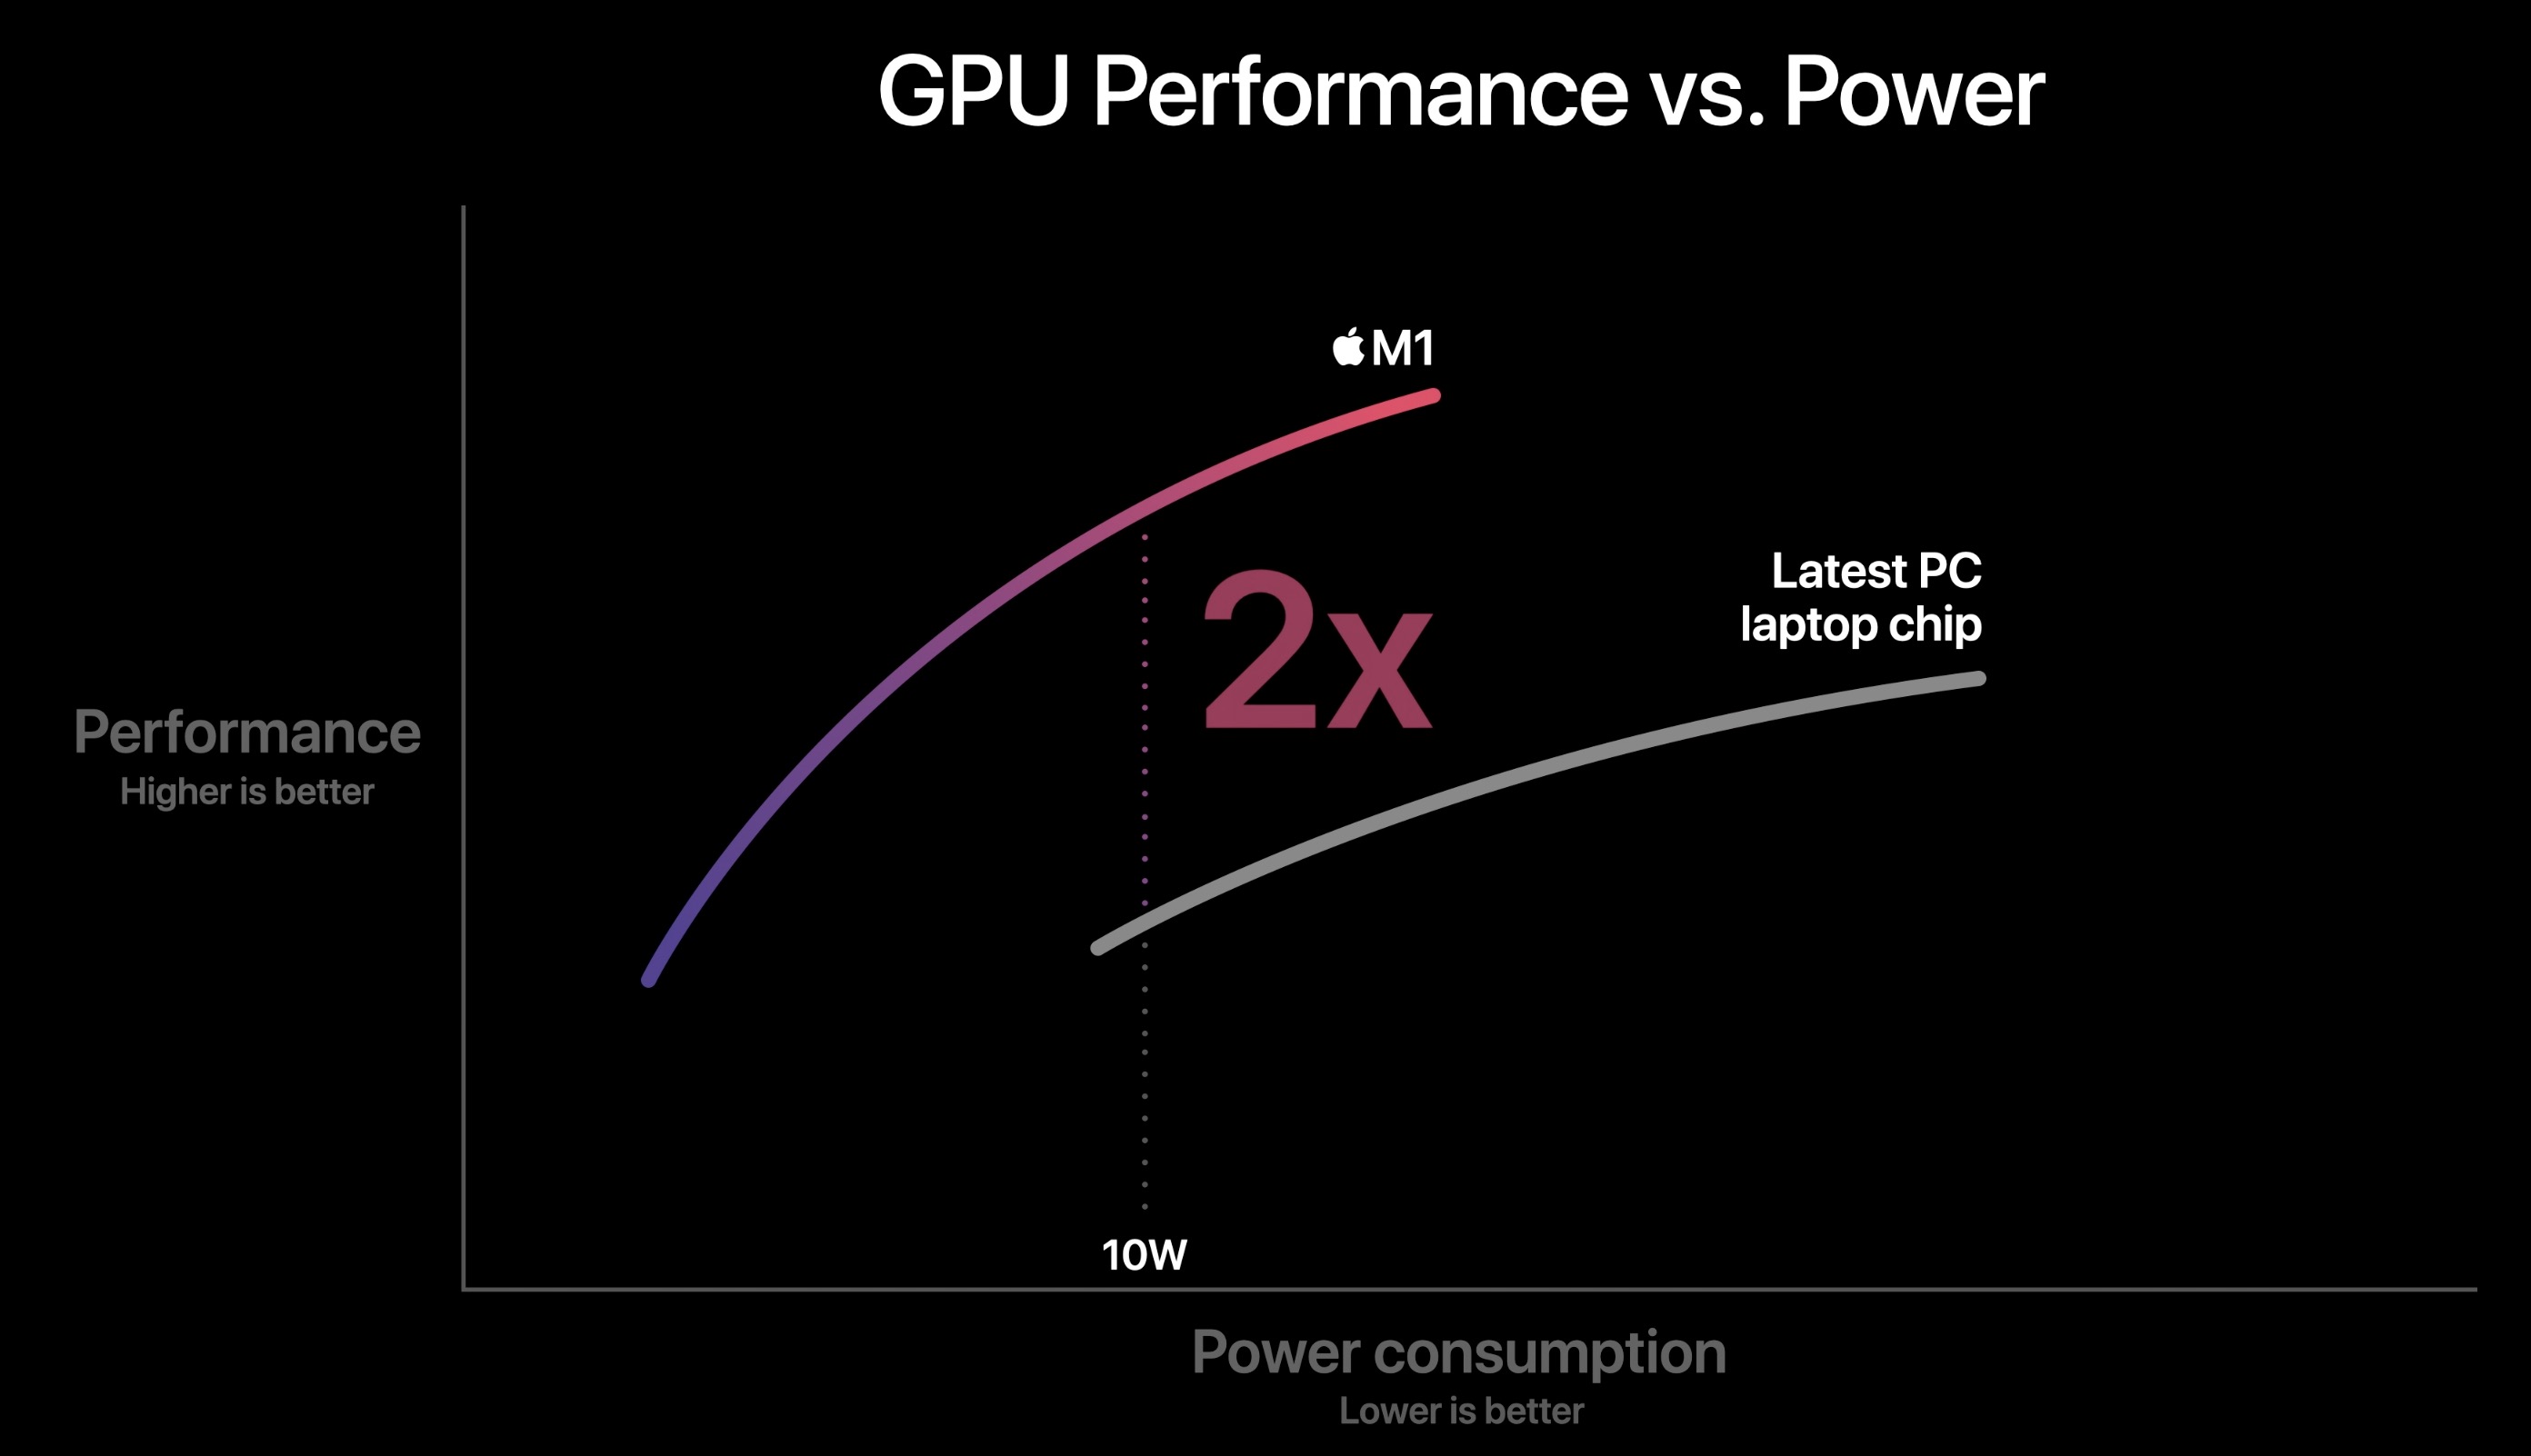
The Apple M1 GPU is an integrated graphics card offering 7 cores (1 deactivated core in the entry MacBook Air) designed by Apple and integrated in the Apple M1 SoC. According to Apple it is faster and more energy efficient as competing products (like the Tiger Lake Xe GPU). The peak performance of the high end variant with 8 cores is 2.6 teraflops, therefore the 7 core version should offer around 2.3 teraflops. Thanks to the unified memory architecture it should have fast access to the RAM.
The Apple M1 is manufactured in the modern 5nm process at TSMC and should offer an excellent energy efficiency.
| Apple M1 Max 24-Core GPU | AMD Radeon Pro 5300M | Apple M1 7-Core GPU | |||||||||||||||||||||||||||||||||||||||||||
| Apple M1 Series |
|
|
| ||||||||||||||||||||||||||||||||||||||||||
| Pipelines | 24 - unified | 1280 - unified | 7 - unified | ||||||||||||||||||||||||||||||||||||||||||
| Core Speed | 1296 MHz | 1250 (Boost) MHz | 1278 MHz | ||||||||||||||||||||||||||||||||||||||||||
| Memory Type | LPDDR5-6400 | GDDR6 | LPDDR4X-4266 | ||||||||||||||||||||||||||||||||||||||||||
| Shared Memory | no | no | no | ||||||||||||||||||||||||||||||||||||||||||
| Power Consumption | 10 Watt | 65 Watt | |||||||||||||||||||||||||||||||||||||||||||
| technology | 5 nm | 7 nm | 5 nm | ||||||||||||||||||||||||||||||||||||||||||
| Date of Announcement | 10.11.2020 | 13.11.2019 | 10.11.2020 | ||||||||||||||||||||||||||||||||||||||||||
| Codename | Navi 14 | ||||||||||||||||||||||||||||||||||||||||||||
| Architecture | Navi / RDNA | ||||||||||||||||||||||||||||||||||||||||||||
| Memory Speed | 12000 MHz | ||||||||||||||||||||||||||||||||||||||||||||
| Memory Bus Width | 128 Bit | ||||||||||||||||||||||||||||||||||||||||||||
| Max. Amount of Memory | 4 GB | ||||||||||||||||||||||||||||||||||||||||||||
| API | DirectX 12, Shader 6.4, OpenGL 4.6 | ||||||||||||||||||||||||||||||||||||||||||||
| Features | DisplayPort 1.4 w/DFSC, HDMI 2.0b, Radeon Media Engine (H.264 4K150 decode, 4K90 encode / H.265 4K90 decode, 4K60 encode / VP9 4K90 decode) | ||||||||||||||||||||||||||||||||||||||||||||
| Notebook Size | medium sized |
Benchmarks
Cinebench R15 OpenGL 64 Bit + Apple M1 Max 24-Core GPU
GFXBench T-Rex HD Offscreen C24Z16 + Apple M1 Max 24-Core GPU
Average Benchmarks Apple M1 Max 24-Core GPU → 0% n=0
Average Benchmarks Apple M1 7-Core GPU → 0% n=0
* Smaller numbers mean a higher performance
1 This benchmark is not used for the average calculation
Game Benchmarks
The following benchmarks stem from our benchmarks of review laptops. The performance depends on the used graphics memory, clock rate, processor, system settings, drivers, and operating systems. So the results don't have to be representative for all laptops with this GPU. For detailed information on the benchmark results, click on the fps number.

Hearthstone
2020
Borderlands 3
2019


F1 2017
2017
Civilization 6
2016Counter-Strike: GO
2012
Batman: Arkham City
2011Average Gaming Apple M1 Max 24-Core GPU → 100%
Average Gaming 30-70 fps → 100%
Average Gaming Apple M1 7-Core GPU → 45%
Average Gaming 30-70 fps → 63%
| Apple M1 Max 24-Core GPU | AMD Radeon Pro 5300M | Apple M1 7-Core GPU | |||||||||||||||||||
|---|---|---|---|---|---|---|---|---|---|---|---|---|---|---|---|---|---|---|---|---|---|
| low | med. | high | ultra | QHD | 4K | low | med. | high | ultra | QHD | 4K | low | med. | high | ultra | QHD | 4K | ||||
| Hearthstone | 58 | ||||||||||||||||||||
| Borderlands 3 | 57.2 | 47.7 | 40.7 | 34.6 | 45.2 | 28 | 17.7 | ||||||||||||||
| Total War: Three Kingdoms | 201 | 96 | 62 | 46 | 95.2 | 26.3 | 17.4 | ||||||||||||||
| Shadow of the Tomb Raider | 141 | 85 | 79 | 77 | 65 | 22 | |||||||||||||||
| F1 2017 | 60 | 54 | 43 | ||||||||||||||||||
| Warhammer 40.000: Dawn of War III | 43.9 | 32.5 | |||||||||||||||||||
| Civilization 6 | 80.3 | 30.1 | 27 | 15.8 | |||||||||||||||||
| Deus Ex Mankind Divided | 47.6 | 35.3 | 19 | ||||||||||||||||||
| Counter-Strike: GO | 109 | 69 | 44.4 | ||||||||||||||||||
| Batman: Arkham City | 86 | 47 | |||||||||||||||||||
| Apple M1 Max 24-Core GPU | AMD Radeon Pro 5300M | Apple M1 7-Core GPU | |||||||||||||||||||
| low | med. | high | ultra | QHD | 4K | low | med. | high | ultra | QHD | 4K | low | med. | high | ultra | QHD | 4K | < 30 fps < 60 fps < 120 fps ≥ 120 fps | 1 2 | 1 2 | 1 2 | 2 1 | | | < 30 fps < 60 fps < 120 fps ≥ 120 fps | | | | | | | < 30 fps < 60 fps < 120 fps ≥ 120 fps | 3 5 | 3 3 | 3 2 2 | 1 2 | 1 | 1 |
For more games that might be playable and a list of all games and graphics cards visit our Gaming List