Notebookcheck Logo

Samsung Exynos 2200 vs Qualcomm Snapdragon 888 4G

Samsung Exynos 2200

► remove from comparison Samsung Exynos 2200

The Samsung Exynos 2200  is a high end SoC with 8 cores in three clusters. One fast ARM Cortex-S2 with up to 2.8 GHz for single thread performance. Three more slower ARM Cortex-A710 with up to 2.52 GHz for performance tasks and four efficient cores using the ARM Cortex-A510 architecture clocked at up to 1.82 GHz.

The SoC also integrates a 5G modem with up to 7.35 Gbps (5G NR Sub-6Hz, 5G NR mmWave, LTE Cat.24 DL / Cat.22 UL) similar to the Exynos 2100. In addition to this, an image processor for 200mP in single camera mode and 8K video, an AI engine with a dual-core NPU and DPS and various GNSS systems (GPS, GLONASS, BeiDou, Galileo).

As a first, the Exynos 2200 integrates a graphics card based on the AMD RDNA 2 architecture called Samsung Xclipse 920).

The CPU performance in our benchmarks was slightly below the Snapdragon 8 Gen 1 (fastest Android SoC currently) and the Apple A15 in the iPhone 13.

The chip is produced in the modern 4nm process at Samsung using EUV.

Qualcomm Snapdragon 888 4G

► remove from comparison Qualcomm SD 888 4G

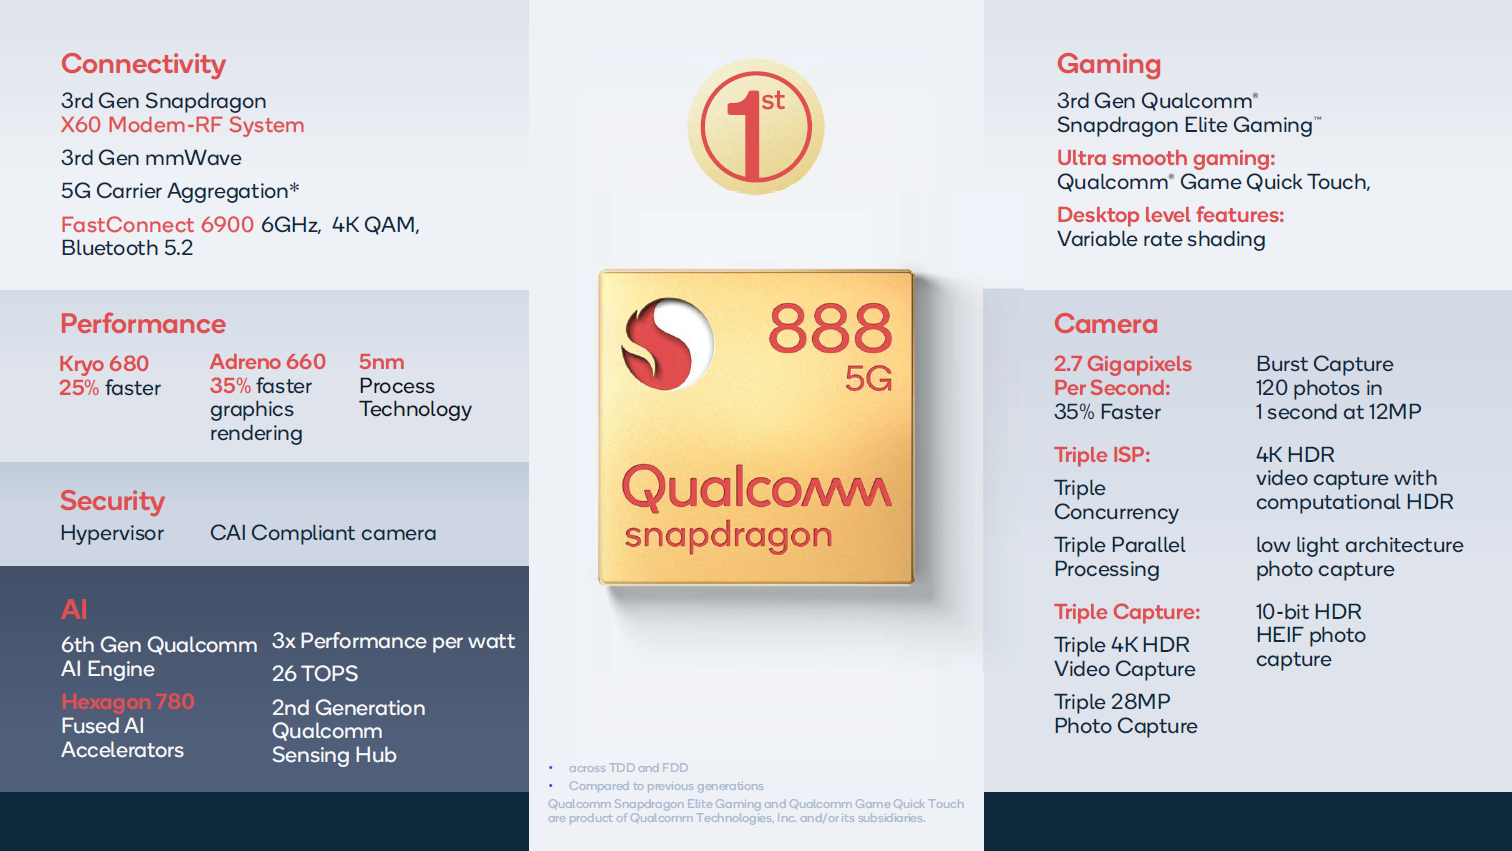
The Qualcomm Snapdragon 888 4G Mobile Platform is a high-end SoC for smartphones that was introduced in mid 2021 and manufactured in 5 nm at Samsung. Compared to the earlier released Snapdragon 888 5G, the 4G variant only features a 4G LTE modem.

The chip integrates one “Prime Core” based on a ARM Cortex-X1 architecture clocked at up to 2.84 GHz. Three more performance cores are based on the A78 but clock up to 2.42 GHz. Furthermore, four energy saving cores are integrated that are based on the ARM Cortex-A55 architecture and clock at up to 1.8 GHz. In addition to the processor cores, the SoC integrates a WiFi 6e modem, a Hexagon 780 DSP (up to 26 TOPS of AI performance) and a Spectra 580 ISP. The integrated memory controller now supports faster LPDDR5 memory with up to 3,200 MHz. 

The performance of the processor cores should be around 15% better than the old Snapdragon 865+. The integrated Adreon 660 GPU should make a bigger jump by 35% (most likely compared to the SD 865).

ModelSamsung Exynos 2200Qualcomm Snapdragon 888 4G
CodenameExynos X2 / Cortex-A710 / A510Cortex-X1 / A78 / A55 (Kryo 680)
SeriesSamsung ExynosQualcomm Snapdragon
Clock1820 - 2800 MHz1800 - 2840 MHz
Cores / Threads8 / 88 / 8
1 x 2.8 GHz ARM Cortex-X1
3 x 2.4 GHz ARM Cortex-A78
4 x 1.8 GHz ARM Cortex-A55
Technology4 nm5 nm
Features5G NR Sub-6GHz, 5G NR mmWave, LTE Cat. 24/22, LPDDR5-RAM, Dual-Core NPU, Wi-Fi 6E, Bluetooth 5.2Adreno 660 GPU, Spectra 580 ISP, Hexagon 780, X60 5G Modem, FastConnect 6900 WiFi,LPDDR5-6400 / LPDDR4X-4266 MHz Memory Controller (64 Bit)
iGPUSamsung Xclipse 920 ( - 555 MHz)Qualcomm Adreno 660
ArchitectureARMARM
Announced
Manufacturersemiconductor.samsung.comwww.qualcomm.com
Series: Snapdragon Cortex-X1 / A78 / A55 (Kryo 680)
Qualcomm Snapdragon G3x Gen 1 compare1.8 - 3 GHz8 / 8 cores3 MB L3 Cortex-X1 / A78 / A55 (Kryo 680)
Qualcomm Snapdragon 888 Plus 5G compare1.8 - 3 GHz8 / 8 cores3 MB L3 Cortex-X1 / A78 / A55 (Kryo 680)
Qualcomm Snapdragon 888 5G compare1.8 - 2.84 GHz8 / 8 cores3 MB L3 Cortex-X1 / A78 / A55 (Kryo 680)
Qualcomm Snapdragon 888 4G « 1.8 - 2.84 GHz8 / 8 cores3 MB L3 Cortex-X1 / A78 / A55 (Kryo 680)
L3 Cache3 MB
TDP5 Watt

Benchmarks

3DMark - 3DMark Sling Shot Extreme (ES 3.1) Unlimited Physics
min: 3909     avg: 4039     median: 3978.5 (37%)     max: 4288 Points
min: 1751     avg: 3815     median: 4539 (43%)     max: 5156 Points
3DMark - 3DMark Sling Shot (ES 3.0) Unlimited Physics
min: 3923     avg: 4120     median: 4085.5 (47%)     max: 4385 Points
min: 4222     avg: 4576     median: 4638 (53%)     max: 4867 Points
Geekbench 6.4 - Geekbench 6.4 Single-Core
1601 Points (40%)
Geekbench 6.4 - Geekbench 6.4 Multi-Core
3938 Points (15%)
Geekbench 5.5 - Geekbench 5.1 - 5.5 64 Bit Single-Core
min: 1133     avg: 1148     median: 1149.5 (45%)     max: 1161 Points
min: 1099     avg: 1105     median: 1107 (43%)     max: 1109 Points
Geekbench 5.5 - Geekbench 5.1 - 5.5 64 Bit Multi-Core
min: 3474     avg: 3600     median: 3579.5 (6%)     max: 3768 Points
min: 2944     avg: 3207     median: 3334 (6%)     max: 3342 Points
Geekbench 4.4 - Geekbench 4.1 - 4.4 64 Bit Single-Core
min: 5788     avg: 5830     median: 5829.5 (58%)     max: 5871 Points
5083 Points (51%)
Geekbench 4.4 - Geekbench 4.1 - 4.4 64 Bit Multi-Core
min: 15209     avg: 15260     median: 15259.5 (15%)     max: 15310 Points
13553 Points (14%)
Mozilla Kraken 1.1 - Kraken 1.1 Total Score *
min: 840.3     avg: 1306     median: 1408.5 (2%)     max: 1566 ms
min: 1835     avg: 1887     median: 1886.5 (2%)     max: 1938 ms
Sunspider - Sunspider 1.0 Total Score *
281.5 ms (3%)
Octane V2 - Octane V2 Total Score
min: 34055     avg: 42162     median: 41695 (31%)     max: 51202 Points
min: 21748     avg: 23536     median: 22851 (17%)     max: 26010 Points
WebXPRT 4 - WebXPRT 4 Score
130 Points (36%)
WebXPRT 3 - WebXPRT 3 Score
min: 124     avg: 142     median: 149 (27%)     max: 153 Points
min: 101     avg: 108     median: 108 (19%)     max: 115 Points
Antutu v9 - AnTuTu v9 Total Score
min: 704479     avg: 797881     median: 818322 (40%)     max: 850401 Points
min: 784775     avg: 789386     median: 789386 (38%)     max: 793997 Points
Antutu v9 - AnTuTu v9 CPU
min: 145904     avg: 195898     median: 208772 (52%)     max: 220142 Points
min: 205034     avg: 205504     median: 205504 (51%)     max: 205974 Points
Antutu v10 - AnTuTu v10 Total Score
1124910 Points (37%)
Antutu v10 - AnTuTu v10 CPU
327492 Points (10%)
PCMark for Android - PCM f. Android Storage 2.0 random write internal
70.5 MB/s (48%)
PCMark for Android - PCM f. Android Storage 2.0 seq write internal
685 MB/s (19%)
PCMark for Android - PCM f. Android Storage 2.0 random read internal
41.6 MB/s (20%)
PCMark for Android - PCM f. Android Storage 2.0 seq read internal
1300 MB/s (32%)
PCMark for Android - PCM f. Android Storage 2.0 score
min: 31101     avg: 33630     median: 33934.5 (15%)     max: 35551 Points
35655 Points (16%)
PCMark for Android - PCM f. Android Work Score 3.0
min: 12579     avg: 13805     median: 13820.5 (50%)     max: 14998 Points
min: 11230     avg: 12134     median: 11897 (43%)     max: 13274 Points
PCMark for Android - PCM f. Android Work Score 2.0
min: 12233     avg: 12402     median: 12402 (81%)     max: 12571 Points
CrossMark - CrossMark Overall
min: 888     avg: 979     median: 949.5 (36%)     max: 1129 Points
0 Points (0%)
Power Consumption - Geekbench 5.5 Power Consumption 150cd *
min: 6.24     avg: 6.7     median: 6.8 (3%)     max: 7.01 Watt
min: 5.09     avg: 5.5     median: 5.5 (2%)     max: 5.84 Watt
Power Consumption - Idle Power Consumption 150cd 1min *
min: 0.625     avg: 0.8     median: 0.8 (1%)     max: 0.913 Watt
min: 1.357     avg: 1.4     median: 1.4 (2%)     max: 1.426 Watt

Average Benchmarks Samsung Exynos 2200 → 100% n=14

Average Benchmarks Qualcomm Snapdragon 888 4G → 84% n=14

- Range of benchmark values for this graphics card
red legend - Average benchmark values for this graphics card
* Smaller numbers mean a higher performance
1 This benchmark is not used for the average calculation

Add one or more devices and compare

In the following list you can select (and also search for) devices that should be added to the comparison. You can select more than one device.

restrict list:
v1.33
log 15. 00:01:23

#0 ran 0s before starting gpusingle class +0s ... 0s

#1 checking url part for id 14146 +0s ... 0s

#2 checking url part for id 13837 +0s ... 0s

#3 redirected to Ajax server, took 1757887283s time from redirect:0 +0s ... 0s

#4 did not recreate cache, as it is less than 5 days old! Created at Sat, 13 Sep 2025 14:08:46 +0200 +0s ... 0s

#5 composed specs +0.006s ... 0.006s

#6 did output specs +0s ... 0.006s

#7 getting avg benchmarks for device 14146 +0.001s ... 0.007s

#8 got single benchmarks 14146 +0.006s ... 0.013s

#9 getting avg benchmarks for device 13837 +0.001s ... 0.013s

#10 got single benchmarks 13837 +0.005s ... 0.018s

#11 got avg benchmarks for devices +0s ... 0.018s

#12 No cached benchmark found, getting uncached values +0.015s ... 0.033s

#13 min, max, avg, median took s +0.001s ... 0.035s

#14 return log +0s ... 0.035s

Please share our article, every link counts!
Mail Logo
> Expert Reviews and News on Laptops, Smartphones and Tech Innovations > Benchmarks / Tech > Processor Comparison - Head 2 Head
Redaktion, 2017-09- 8 (Update: 2023-07- 1)