Notebookcheck Logo

Samsung Exynos 1380 vs Qualcomm Snapdragon 778G+ 5G

Samsung Exynos 1380

► remove from comparison Samsung Exynos 1380

The Samsung Exynos 1380 is a system on a chip (SoC) designed for mid-range smartphones and tablets running on the Android operating system. The CPU is made up of two clusters, each consisting of four cores. It features four Cortex-A78 performance cores (up to 2.4 GHz) and four Cortex-A55 power-saving cores (up to 2.0 GHz). The integrated graphics unit is an ARM Mali-G68 MP5 with speeds of up to 950 MHz.

The NPU's performance has been improved by around 14 percent compared to its predecessor, with a capacity of 4.9 TOPS. Displays with up to 144 Hz and Full HD+ resolution can now be used, and the chipset supports cameras with up to 200 MPix. The chipset also includes Wi-Fi 6 and Bluetooth 5.3. Both LPDDR4x and LPDDR5 can be used as RAM, and UFS 3.1 is possible as internal storage.

The integrated modem has significantly increased download speeds, supporting both 5G-Sub6 (download: up to 3.79 Gbps (+32%), upload: up to 1.28 Gbps) and 5G-mmWave (download: up to 3.67 Gbps (+75%), upload: up to 0.92 Gbps). The upload speed for LTE (Cat. 18, download: up to 1.2 Gbps, upload: up to 0.211 Gbps (+5%)) has only been slightly improved.

The Exynos 1380 is manufactured by Samsung using the 5-nm process.

Qualcomm Snapdragon 778G+ 5G

► remove from comparison Qualcomm SD 778G+ 5G

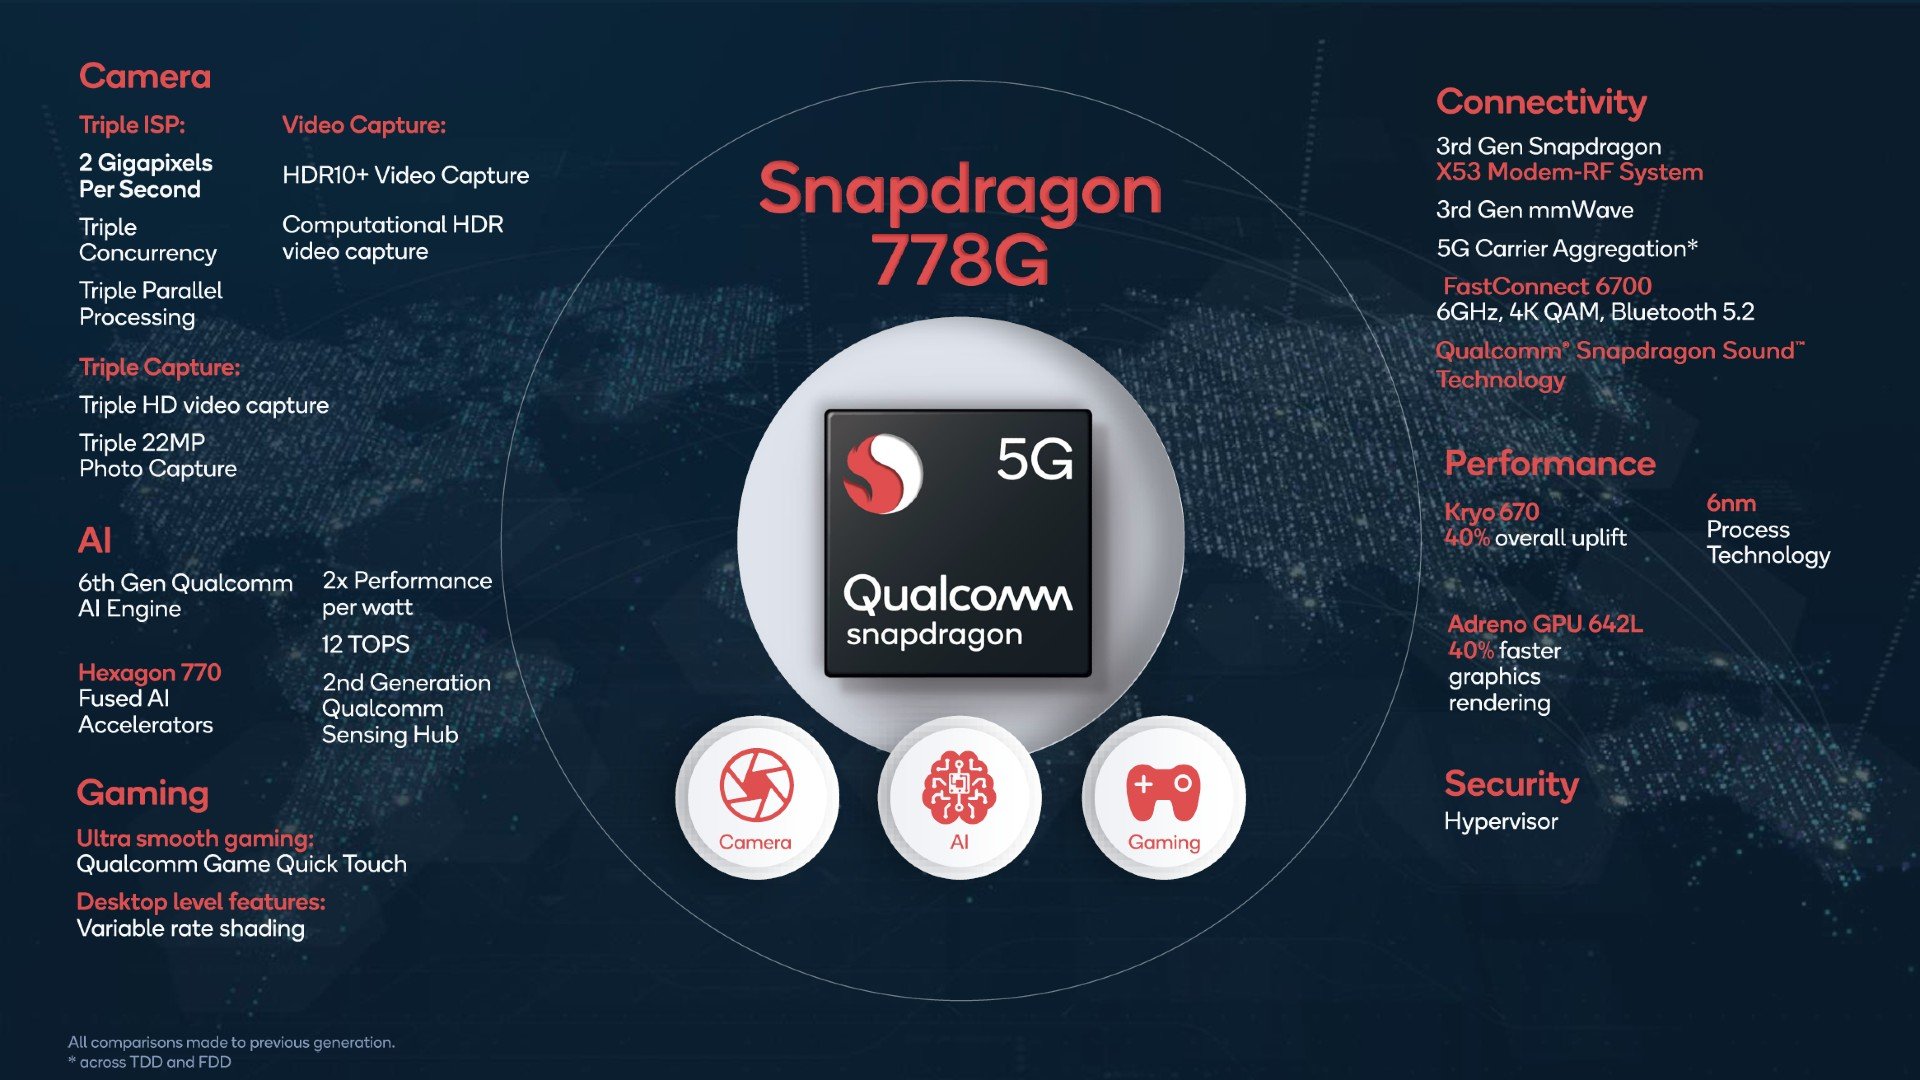
The Qualcomm Snapdragon 778G+ 5G (SDM778G Plus 5G Mobile Platform) is a fast mid-range ARM-based SoC largely found on Android tablets and smartphones. It integrates eight cores (octa-core) divided into two clusters. A fast performance cluster with four cores based on the ARM Cortex-A78 architecture with up to 2.5 GHz and a power efficiency cluster with four small ARM Cortex-A55 cores at up to 1.9 GHz. Depending on the workload only single clusters or all cores can run at different clock speeds. Compared to the older non-plus variant, the 778G+ offers 100 MHz higher clocked CPU cores.

Thanks to the new Cortex-A78 cores, the CPU performance increases by up to 40% compared to the old Snapdragon 768G according to Qualcomm. In our benchmarks, the 778G+ is able to reach the performance of the old high end chip Kirin 990

The integrated X53 5G modem supports up to 3.3 Gbps with sub 6Ghz. The FastConnect 6900 Wi-Fi modem supports the current Wi-Fi 6e standard with 6GHz.

The integrated Qualcomm Adreno 642L offers a 40% higher performance compared to the old Adreno 620 in the predecessor. This is partly thanks to the fast memory controller with LPDDR5-3200 support.

The integrated 6th gen AI engine called Hexagon 770 offers a 2x improvement and up to 12 TOPS of performance. The Spectra 570 ISP (image signal processor) supports up to three cameras. The satellite system supports all major standards like Beidou, Galileo, GLONASS and GPS.

The G specifies an optimized SoC for gaming and e.g. Qualcomm offers updates for the graphics driver.

The Snapdragon 778G Plus is manufactured in the modern 6 nm process at TSMC (vs the 5LPE of the 780G).

ModelSamsung Exynos 1380Qualcomm Snapdragon 778G+ 5G
CodenameARM Cortex-A55 / A78Kryo 670 (Cortex-A78/A55)
SeriesSamsung ExynosQualcomm Snapdragon
Series: Snapdragon Kryo 670 (Cortex-A78/A55)
Samsung Exynos 1480 compare2.05 - 2.75 GHz8 / 8 cores ARM Cortex-A55 / A78
Samsung Exynos 1380 « 2 - 2.4 GHz8 / 8 cores ARM Cortex-A55 / A78
Samsung Exynos 1330 compare2 - 2.4 GHz8 / 8 cores ARM Cortex-A55 / A78
Qualcomm Snapdragon 780G 5G compare1.9 - 2.4 GHz8 / 8 cores Kryo 670 (Cortex-A78/A55)
Qualcomm QCM6490 compare1.96 - 2.71 GHz8 / 8 cores Kryo 670 (Cortex-A78/A55)
Qualcomm Snapdragon 778G+ 5G « 1.9 - 2.5 GHz8 / 8 cores Kryo 670 (Cortex-A78/A55)
Qualcomm Snapdragon 778G 5G compare1.8 - 2.4 GHz8 / 8 cores Kryo 670 (Cortex-A78/A55)
Qualcomm Snapdragon 778G 4G compare1.8 - 2.4 GHz8 / 8 cores Kryo 670 (Cortex-A78/A55)
Clock2000 - 2400 MHz1900 - 2500 MHz
Cores / Threads8 / 8
4 x 2.4 GHz ARM Cortex-A78
4 x 2.0 GHz ARM Cortex-A55
8 / 8
Technology5 nm6 nm
FeaturesNPU, Wi-Fi 802.11ax (2x2 MIMO), Bluetooth 5.3, FM Radio Rx, GNSS (GPS, Glonass, BeiDou, Galileo), Triple-ISPAdreno 642L GPU, X53 5G Modem, Hexagon 770 DSP, Spectra 570L ISP, Wi-Fi 6E
iGPUARM Mali-G68 MP5 ( - 950 MHz)Qualcomm Adreno 642L
ArchitectureARMARM
Announced
Manufacturersemiconductor.samsung.comwww.qualcomm.com

Benchmarks

3DMark - 3DMark Sling Shot Extreme (ES 3.1) Unlimited Physics
min: 4227     avg: 4385     median: 4383 (41%)     max: 4486 Points
min: 4518     avg: 4659     median: 4547 (43%)     max: 4912 Points
3DMark - 3DMark Sling Shot (ES 3.0) Unlimited Physics
min: 4176     avg: 4349     median: 4386.5 (50%)     max: 4445 Points
4732 Points (54%)
Geekbench 6.4 - Geekbench 6.4 Single-Core
min: 1008     avg: 1014     median: 1012 (25%)     max: 1023 Points
Geekbench 6.4 - Geekbench 6.4 Multi-Core
min: 2857     avg: 2877     median: 2866 (11%)     max: 2906 Points
Geekbench 6.0 - Geekbench 6.0 Single-Core
1006 Points (32%)
Geekbench 6.0 - Geekbench 6.0 Multi-Core
2828 Points (12%)
Geekbench 5.5 - Geekbench 5.1 - 5.5 64 Bit Single-Core
min: 771     avg: 781     median: 783 (31%)     max: 788 Points
min: 813     avg: 821     median: 824 (32%)     max: 826 Points
Geekbench 5.5 - Geekbench 5.1 - 5.5 64 Bit Multi-Core
min: 2719     avg: 2761     median: 2763 (5%)     max: 2817 Points
min: 2872     avg: 2933     median: 2929 (5%)     max: 2998 Points
Geekbench 5.0 - Geekbench 5.0 64 Bit Single-Core
786 Points (3%)
Geekbench 5.0 - Geekbench 5.0 64 Bit Multi-Core
2766 Points (9%)
Geekbench 4.4 - Geekbench 4.1 - 4.4 64 Bit Single-Core
min: 3550     avg: 3556     median: 3555.5 (35%)     max: 3561 Points
min: 3758     avg: 3760     median: 3760 (38%)     max: 3762 Points
Geekbench 4.4 - Geekbench 4.1 - 4.4 64 Bit Multi-Core
min: 11130     avg: 11160     median: 11160 (11%)     max: 11190 Points
min: 11089     avg: 11342     median: 11342 (11%)     max: 11595 Points
Geekbench 4.0 - Geekbench 4.0 64 Bit Single-Core
min: 3632     avg: 3641     median: 3640.5 (40%)     max: 3649 Points
Geekbench 4.0 - Geekbench 4.0 64 Bit Multi-Core
min: 10488     avg: 10675     median: 10674.5 (15%)     max: 10861 Points
Geekbench 3 - Geekbench 3 64 Bit Multi-Core
min: 10323     avg: 11834     median: 11833.5 (19%)     max: 13344 Points
Geekbench 3 - Geekbench 3 64 Bit Single-Core
min: 2966     avg: 3441     median: 3440.5 (52%)     max: 3915 Points
Mozilla Kraken 1.1 - Kraken 1.1 Total Score *
min: 975.3     avg: 1128     median: 1139.1 (1%)     max: 1208.8 ms
min: 1236.1     avg: 1456     median: 1335 (2%)     max: 1796.1 ms
Sunspider - Sunspider 1.0 Total Score *
187 ms (2%)
Octane V2 - Octane V2 Total Score
min: 33801     avg: 35734     median: 35384 (27%)     max: 38939 Points
min: 24488     avg: 29797     median: 32109 (24%)     max: 32794 Points
WebXPRT 4 - WebXPRT 4 Score
min: 97     avg: 110.7     median: 110.5 (30%)     max: 123 Points
min: 69     avg: 85     median: 93 (26%)     max: 93 Points
WebXPRT 3 - WebXPRT 3 Score
min: 124     avg: 131.3     median: 125 (22%)     max: 145 Points
min: 102     avg: 115     median: 116 (21%)     max: 127 Points
Antutu v9 - AnTuTu v9 Total Score
min: 505141     avg: 510383     median: 508957 (25%)     max: 518476 Points
min: 553328     avg: 564791     median: 558781 (27%)     max: 582264 Points
Antutu v9 - AnTuTu v9 CPU
min: 151517     avg: 153827     median: 154008 (38%)     max: 155773 Points
min: 138027     avg: 154764     median: 162368 (40%)     max: 163897 Points
Antutu v10 - AnTuTu v10 Total Score
min: 434759     avg: 558136     median: 583142 (19%)     max: 602612 Points
Antutu v10 - AnTuTu v10 CPU
min: 149287     avg: 186409     median: 195056 (6%)     max: 200922 Points
PassMark PerformanceTest Mobile V1 - PerformanceTest Mobile V1 CPU Tests
591842 Points (78%)
min: 6225     avg: 6514     median: 6514 (1%)     max: 6803 Points
PCMark for Android - PCM f. Android Storage 2.0 random write internal
min: 33.8     avg: 38.4     median: 37.3 (25%)     max: 45.2 MB/s
PCMark for Android - PCM f. Android Storage 2.0 seq write internal
min: 121     avg: 308.5     median: 334.5 (9%)     max: 444 MB/s
PCMark for Android - PCM f. Android Storage 2.0 random read internal
min: 32.3     avg: 35.3     median: 34.9 (17%)     max: 38.9 MB/s
PCMark for Android - PCM f. Android Storage 2.0 seq read internal
min: 478     avg: 482.8     median: 484 (13%)     max: 485 MB/s
PCMark for Android - PCM f. Android Storage 2.0 score
min: 12748     avg: 17192     median: 17384 (8%)     max: 20032 Points
min: 30076     avg: 30829     median: 30828.5 (14%)     max: 31581 Points
PCMark for Android - PCM f. Android Work Score 3.0
min: 11259     avg: 12707     median: 13214 (49%)     max: 13488 Points
min: 11662     avg: 13225     median: 12820 (47%)     max: 15194 Points
PCMark for Android - PCM f. Android Computer Vision
6971 Points (37%)
PCMark for Android - PCM f. Android Work Score 2.0
11690 Points (76%)
min: 730     avg: 741     median: 732 (27%)     max: 760 Points
Power Consumption - Geekbench 5.5 Power Consumption 150cd *
min: 5.62     avg: 6.2     median: 6 (3%)     max: 7.1 Watt
min: 4.05     avg: 4.6     median: 4.4 (2%)     max: 5.36 Watt
Power Consumption - Idle Power Consumption 150cd 1min *
min: 1.084     avg: 1.7     median: 1.5 (2%)     max: 2.42 Watt
min: 0     avg: 0.9     median: 1.1 (1%)     max: 1.58 Watt

Average Benchmarks Samsung Exynos 1380 → 100% n=16

Average Benchmarks Qualcomm Snapdragon 778G+ 5G → 99% n=16

- Range of benchmark values for this graphics card
red legend - Average benchmark values for this graphics card
* Smaller numbers mean a higher performance
1 This benchmark is not used for the average calculation

Add one or more devices and compare

In the following list you can select (and also search for) devices that should be added to the comparison. You can select more than one device.

restrict list:
v1.33
log 29. 00:45:33

#0 ran 0s before starting gpusingle class +0s ... 0s

#1 checking url part for id 15010 +0s ... 0s

#2 checking url part for id 14526 +0s ... 0s

#3 redirected to Ajax server, took 1753742733s time from redirect:0 +0s ... 0s

#4 did not recreate cache, as it is less than 5 days old! Created at Mon, 28 Jul 2025 05:17:35 +0200 +0s ... 0s

#5 composed specs +0.006s ... 0.006s

#6 did output specs +0s ... 0.006s

#7 getting avg benchmarks for device 15010 +0.001s ... 0.006s

#8 got single benchmarks 15010 +0.006s ... 0.012s

#9 getting avg benchmarks for device 14526 +0.001s ... 0.013s

#10 got single benchmarks 14526 +0.005s ... 0.018s

#11 got avg benchmarks for devices +0s ... 0.018s

#12 min, max, avg, median took s +0.025s ... 0.043s

#13 return log +0s ... 0.043s

Please share our article, every link counts!
Mail Logo
> Expert Reviews and News on Laptops, Smartphones and Tech Innovations > Benchmarks / Tech > Processor Comparison - Head 2 Head
Redaktion, 2017-09- 8 (Update: 2023-07- 1)