Notebookcheck Logo

Amlogic AML8726-MX vs HiSilicon Kirin 650

Amlogic AML8726-MX

► remove from comparison

The Amlogic AML8726-M is a cheap SoC (System on a Chip) for Android tablets and smartphones. It integrates two ARM Cortex-A9 cores (max. 1,5 GHz) with SIMD extensions and an ARM Mali-400 graphics card. Furthermore, the chip supports hardware decoding of 1080p videos according to Amlogic.

HiSilicon Kirin 650

► remove from comparison  Kirin 650

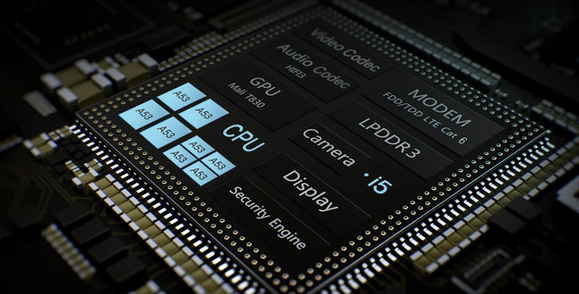
The HiSilicon Kirin 650 is an ARM-based octa-core SoC for mid-range smartphones and tablets. It was announced early 2016 and features eight ARM Cortex-A53 cores. Four cores can be clocked with up to 1.7 GHz (power saving cores) and four with up to 2 GHz (performance cores). Furthermore, a ARM Mali-T830 MP2 graphics card (at 600 MHz with 40.8 GFLOPS), a 64-Bit LPDDR3 memory controller and a dual-sim capable LTE Cat. 6 (max. 300 MBit/s and GSM, WCDMA, UMTS, HSPA+) radio are integrated in the SoC.

The processor performance can be compared with the older Kirin 930 and therefore sufficient for daily usage as browsing and non demanding apps. High-end SoCs with Cortex-A57 or A72 cores however should be noticeably faster.

The SoC is produced in a modern 16nm FinFET process and is therefore very power efficient.


ModelAmlogic AML8726-MXHiSilicon Kirin 650
Series
Series: Cortex-A53
newitem compare cores
HiSilicon Kirin 9000W compare1.53 - 2.49 GHz12 / 12 cores
UNISOC Tiger T310 compare1.8 - 2 GHz4 / 4 cores
Rockchip RK3288 compare1.8 GHz4 / 4 cores
Apple A6x compare1.4 GHzcores
Apple A6 compare1 GHzcores
Apple S5 compare2 / 2 cores
HiSilicon k3v2 Hi3620 compare1.2 GHz4 / 4 cores
Rockchip RK3066 1.5 GHz compare1.5 GHz2 / 2 cores
Amlogic AML8726-MX « 1.5 GHz2 / 2 cores
Rockchip RK3168 compare1.2 GHz2 / 2 cores
Rockchip RK2918 1.2 GHz compare1.2 GHz1 / 1 cores
ARM Cortex A8 1.2 GHz compare1.2 GHz1 / 1 cores
Telechips TCC8803 1GHz compare1 GHz1 / 1 cores
Loongson 2F 900MHz compare0.9 GHz1 / 1 cores
CSR8670 compare0.08 GHzcores
ARM Cortex-M4 compare cores
HiSilicon Hi6262 compare cores
DK3.5+ST comparecores
unknown compare cores
JLQ JR510 compare1.5 - 2 GHz8 / 8 cores Cortex-A53
HiSilicon Kirin 935 compare2.2 GHz8 / 8 cores Cortex-A53
HiSilicon Kirin 659 compare2.36 GHz8 / 8 cores Cortex-A53
HiSilicon Kirin 658 compare2.35 GHz8 / 8 cores Cortex-A53
HiSilicon Kirin 655 compare2.1 GHz8 / 8 cores Cortex-A53
HiSilicon Kirin 650 « 2 GHz8 / 8 cores Cortex-A53
HiSilicon Kirin 930 compare2 GHz8 / 8 cores Cortex-A53
HiSilicon Kirin 620 compare1.2 GHz8 / 8 cores Cortex-A53
MediaTek MT8163 V/A 1.5 GHz compare1.5 GHz4 / 4 cores Cortex-A53
MediaTek MT8163 V/B 1.3 GHz compare1.3 GHz4 / 4 cores Cortex-A53
MediaTek MT8161 compare1.3 GHz4 / 4 cores Cortex-A53
Marvell Armada PXA1908 compare1.2 GHz4 / 4 cores Cortex-A53
Clock1500 MHz2000 MHz
L2 Cache512 KB
Cores / Threads2 / 28 / 8
Technology45 nm16 nm
FeaturesNEON, VFP, Cortex-A9ARMv8-ISA, Mali-T830 MP2, Dual SIM LTE (Cat. 6), LPDDR3 Memory Controller
ArchitectureARMARM
Announced
Manufacturerwww.amlogic.com
CodenameCortex-A53
iGPUARM Mali-T830 MP2 (900 MHz)

Benchmarks

3DMark - 3DMark Ice Storm Extreme Physics
11640 Points (9%)
3DMark - 3DMark Ice Storm Unlimited Physics
min: 13588     avg: 13632     median: 13632 (11%)     max: 13676 Points
3DMark - 3DMark Sling Shot Extreme (ES 3.1) Unlimited Physics
1440 Points (6%)
Geekbench 3 - Geekbench 3 64 Bit Multi-Core
min: 3768     avg: 3841     median: 3841 (6%)     max: 3914 Points
Geekbench 3 - Geekbench 3 64 Bit Single-Core
min: 883     avg: 895     median: 894.5 (13%)     max: 906 Points
Geekbench 2 - 32 Bit - Geekbench Stream
min: 267     avg: 268.5     median: 268.5 (2%)     max: 270 Points
Geekbench 2 - 32 Bit - Geekbench Memory
min: 958     avg: 963     median: 963 (9%)     max: 968 Points
Geekbench 2 - 32 Bit - Geekbench Floating Point
min: 1409     avg: 1451     median: 1450.5 (3%)     max: 1492 Points
Geekbench 2 - 32 Bit - Geekbench Integer
min: 825     avg: 840     median: 839.5 (2%)     max: 854 Points
Geekbench 2 - 32 Bit - Geekbench Total Score
min: 1000     avg: 1021     median: 1020.5 (3%)     max: 1041 Points
Linpack Android / IOS - Linpack Multi Thread
min: 63.9     avg: 86.6     median: 84.2 (3%)     max: 111.8 MFLOPS
Linpack Android / IOS - Linpack Single Thread
min: 50.7     avg: 57.9     median: 52.9 (5%)     max: 70.1 MFLOPS
Mozilla Kraken 1.1 - Kraken 1.1 Total Score *
min: 9111     avg: 9254     median: 9254 (11%)     max: 9397 ms
Sunspider - Sunspider 0.9.1 Total Score *
min: 1243     avg: 1336     median: 1252 (12%)     max: 1513 ms
Octane V2 - Octane V2 Total Score
min: 4188     avg: 4472     median: 4472 (4%)     max: 4756 Points
Vellamo 3.x - Vellamo 3.x Metal
1434 Points (38%)
Vellamo 3.x - Vellamo 3.x Multicore Beta
1965 Points (44%)
Vellamo 3.x - Vellamo 3.x Browser
3356 Points (44%)
Quadrant Standard Edition 2.0 - Quadrant Standard 2.0 Total Score
min: 3947     avg: 4055     median: 4055 (9%)     max: 4163 points
AnTuTu v3 - AnTuTu v3 CPU
min: 4082     avg: 4886     median: 4886 (32%)     max: 5690 Points
AnTuTu v6 - AnTuTu v6 Total Score
min: 50366     avg: 51755     median: 51754.5 (18%)     max: 53143 Points
PassMark PerformanceTest Mobile V1 - PerformanceTest Mobile V1 CPU Tests
142543 Points (19%)
PCMark for Android - PCM f. Android Work Score
min: 5120     avg: 5230     median: 5229.5 (26%)     max: 5339 Points

Average Benchmarks Amlogic AML8726-MX → 0% n=

Average Benchmarks HiSilicon Kirin 650 → 0% n=

- Range of benchmark values for this graphics card
- Average benchmark values for this graphics card
* Smaller numbers mean a higher performance
1 This benchmark is not used for the average calculation

Add one or more devices and compare

In the following list you can select (and also search for) devices that should be added to the comparison. You can select more than one device.

restrict list:

show all (including archived), 2024, 2023
v1.26
log 21. 12:13:11

#0 checking url part for id 3611 +0s ... 0s

#1 checking url part for id 8075 +0s ... 0s

#2 not redirecting to Ajax server +0s ... 0s

#3 did not recreate cache, as it is less than 5 days old! Created at Sun, 19 May 2024 05:35:32 +0200 +0.001s ... 0.001s

#4 composed specs +0.081s ... 0.082s

#5 did output specs +0s ... 0.082s

#6 getting avg benchmarks for device 3611 +0.003s ... 0.085s

#7 got single benchmarks 3611 +0.011s ... 0.096s

#8 getting avg benchmarks for device 8075 +0.003s ... 0.099s

#9 got single benchmarks 8075 +0.011s ... 0.109s

#10 got avg benchmarks for devices +0s ... 0.109s

#11 min, max, avg, median took s +0.06s ... 0.169s

#12 return log +0.026s ... 0.195s

Please share our article, every link counts!
> Expert Reviews and News on Laptops, Smartphones and Tech Innovations > Benchmarks / Tech > Processor Comparison - Head 2 Head
Redaktion, 2017-09- 8 (Update: 2023-07- 1)