Notebookcheck Logo

Apple A15 Bionic vs Qualcomm Snapdragon 8+ Gen 1

Apple A15 Bionic

► remove from comparison Apple A15

The Apple A15 Bionic is a System on a Chip (SoC) from Apple that is found in the iPhone 13 and iPad Mini (2021) models. It was announced late 2021 and offers 6 cores divided in 2 performance cores and four power efficiency cores. The CPU performance increases only slightly compared to the A14, but GPU (in the higher end models) offers higher gains.

The chip is manufactured in 5nm and integrates 15.8 billion transistors (compared to the 11.8 of the A14).

Qualcomm Snapdragon 8+ Gen 1

► remove from comparison Qualcomm SD 8+ Gen 1

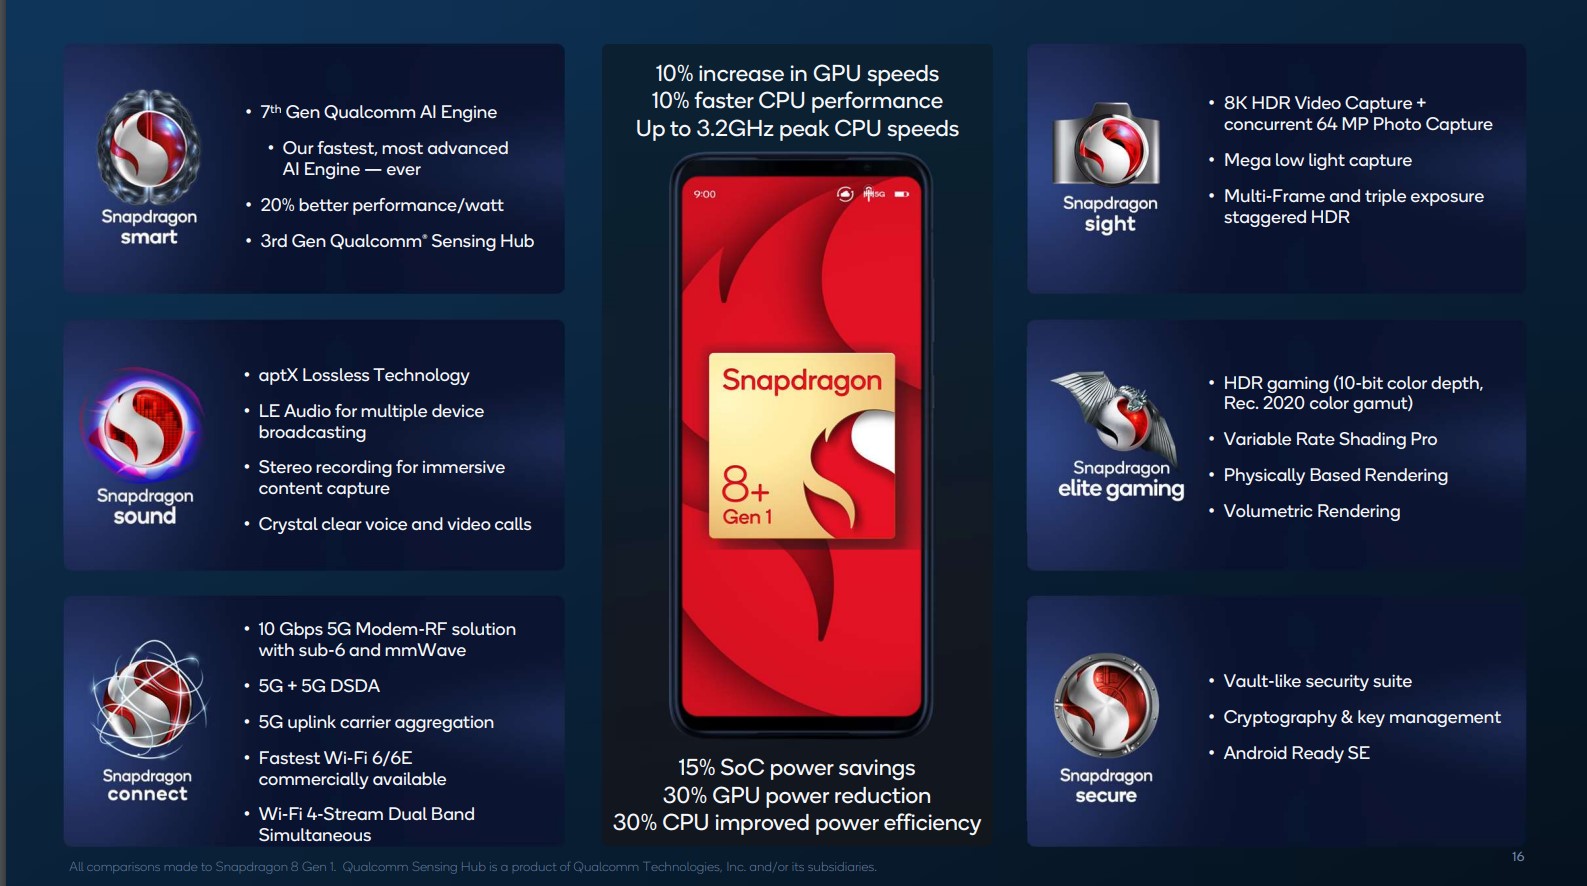
The Qualcomm Snapdragon 8+ Gen 1 Mobile Platform is a high-end SoC for smartphones that was introduced in mid 2022 and manufactured in 4 nm at TSMC. It integrates one “Prime Core” based on a ARM Cortex-X2 architecture clocked at up to 3.2 GHz. Three more performance cores are based on the Cortex-A710 but clocked up to 2.5 GHz. Furthermore, four energy saving cores are integrated that are based on the ARM Cortex-A510 architecture and clocked at up to 1.8 GHz. All cores can use the shared 6 MB level 3 cache.

Compared to the Snapdragon 8 Gen 1, the SoC is now produced in the more power efficient 4nm process at TSMC and offers higher clocked CPU and GPU cores (at a lower power consumption according to Qualcomm).

The integrated AI Engine can offer up to 4x faster AI performance thanks to the bigger Tensor engine. The 18-Bit-Spectra-ISP also saw some big improvements and is now called Snapdragon Sight.

The integrated Adreno 730 offers a 30% graphics boost compared to the previous Adreno 660.

The integrated Snapdragon X65 5G modem is also new and offers faster transfer rates (up to 10 Gbps download and 3 Gbps upload). The FastConnect 6900 offers support for the current Wifi 6E and Bluetooth 5.2.

ModelApple A15 BionicQualcomm Snapdragon 8+ Gen 1
SeriesApple Apple A-SeriesQualcomm Snapdragon 8
Series: Snapdragon 8 Cortex-X2 / A710 / A510 (Kryo) Waipio
Apple A18 Pro compare - 4 GHz6 / 6 cores
Apple A18 compare - 3.8 GHz6 / 6 cores
Apple A15 Bionic « 2.02 - 3.23 GHz6 / 6 cores32 MB L3
Apple A12 Bionic compare - 2.49 GHz6 / 6 cores
Apple A6x compare1.4 GHzcores
Apple A6 compare1 GHzcores
Qualcomm Snapdragon 8+ Gen 1 « 1.8 - 3.2 GHz8 / 8 cores6 MB L3
Qualcomm Snapdragon 8 Gen 1 compare1.8 - 3 GHz8 / 8 cores6 MB L3
Clock2020 - 3230 MHz1800 - 3200 MHz
L2 Cache16 MB
L3 Cache32 MB6 MB
Cores / Threads6 / 68 / 8
Transistors15800 Million
Technology5 nm4 nm
FeaturesARMv8 Instruction Set, Machine Learning Controller, 16-Core Neural Engine, Secure Enclave, Advanced Image Signal ProcessorAdreno 730 GPU, Spectra ISP, Hexagon, X65 5G Modem, FastConnect 6900 WiFi, LPDDR5-6400 Memory Controller
iGPUApple A15 GPU 5-CoreQualcomm Adreno 730
ArchitectureARMARM v9
Announced
CodenameCortex-X2 / A710 / A510 (Kryo) Waipio
Manufacturerwww.qualcomm.com

Benchmarks

3DMark - 3DMark Sling Shot Extreme (ES 3.1) Unlimited Physics
100%
A15 +
min: 1852     avg: 2027     median: 1913 (18%)     max: 2307 Points
3DMark - 3DMark Sling Shot (ES 3.0) Unlimited Physics
100%
A15 +
2130 Points (24%)
Geekbench 6.4 - Geekbench 6.4 Single-Core
100%
A15 +
2332 Points (58%)
min: 1530     avg: 1735     median: 1741 (43%)     max: 1854 Points
Geekbench 6.4 - Geekbench 6.4 Multi-Core
100%
A15 +
5661 Points (22%)
min: 4140     avg: 4493     median: 4584 (18%)     max: 4761 Points
Geekbench 6.0 - Geekbench 6.0 Single-Core
min: 1271     avg: 1650     median: 1771.5 (56%)     max: 1785 Points
Geekbench 6.0 - Geekbench 6.0 Multi-Core
min: 4025     avg: 4458     median: 4565 (19%)     max: 4677 Points
Geekbench 5.5 - Geekbench 5.1 - 5.5 64 Bit Single-Core
100%
A15 +
min: 1590     avg: 1723     median: 1734 (68%)     max: 1755 Points
Geekbench 5.5 - Geekbench 5.1 - 5.5 64 Bit Multi-Core
100%
A15 +
min: 4559     avg: 4755     median: 4788 (9%)     max: 4914 Points
Geekbench 4.4 - Geekbench 4.1 - 4.4 64 Bit Single-Core
min: 6968     avg: 7193     median: 7202.5 (72%)     max: 7378 Points
Geekbench 4.4 - Geekbench 4.1 - 4.4 64 Bit Multi-Core
min: 16273     avg: 17467     median: 17569.5 (18%)     max: 18976 Points
Geekbench 3 - Geekbench 3 64 Bit Multi-Core
15884 Points (25%)
Geekbench 3 - Geekbench 3 64 Bit Single-Core
6109 Points (91%)
Mozilla Kraken 1.1 - Kraken 1.1 Total Score *
100%
A15 +
min: 413.6     avg: 455.6     median: 451 (1%)     max: 507.3 ms
min: 665.3     avg: 1023     median: 908.2 (1%)     max: 1706.5 ms
Sunspider - Sunspider 1.0 Total Score *
100%
A15 +
77 ms (1%)
190.4 ms (2%)
Octane V2 - Octane V2 Total Score
100%
A15 +
min: 57143     avg: 63305     median: 64026.5 (47%)     max: 65969 Points
min: 17622     avg: 42193     median: 40372 (30%)     max: 61536 Points
WebXPRT 4 - WebXPRT 4 Score
100%
A15 +
min: 188     avg: 188.3     median: 188 (52%)     max: 189 Points
WebXPRT 3 - WebXPRT 3 Score
100%
A15 +
min: 219     avg: 254.3     median: 250 (45%)     max: 279 Points
min: 106     avg: 159.4     median: 156.5 (28%)     max: 224 Points
Antutu v9 - AnTuTu v9 Total Score
100%
A15 +
min: 722973     avg: 788523     median: 800415 (39%)     max: 832548 Points
Antutu v9 - AnTuTu v9 CPU
100%
A15 +
min: 192891     avg: 209810     median: 209802 (52%)     max: 227638 Points
Antutu v10 - AnTuTu v10 Total Score
min: 1162600     avg: 1270620     median: 1308220 (43%)     max: 1341050 Points
Antutu v10 - AnTuTu v10 CPU
min: 279154     avg: 333526     median: 359125 (11%)     max: 362299 Points
PassMark PerformanceTest Mobile V1 - PerformanceTest Mobile V1 CPU Tests
100%
1 A15 +
min: 10349     avg: 10411     median: 10410.5 (1%)     max: 10472 Points
PCMark for Android - PCM f. Android Storage 2.0 random write internal
min: 46.8     avg: 58     median: 55.5 (38%)     max: 71.6 MB/s
PCMark for Android - PCM f. Android Storage 2.0 seq write internal
min: 1222     avg: 1383     median: 1422 (40%)     max: 1504 MB/s
PCMark for Android - PCM f. Android Storage 2.0 random read internal
min: 37.6     avg: 40.3     median: 37.9 (18%)     max: 45.4 MB/s
PCMark for Android - PCM f. Android Storage 2.0 seq read internal
min: 1503     avg: 1624     median: 1588 (44%)     max: 1780 MB/s
CrossMark - CrossMark Overall
100%
A15 +
min: 1132     avg: 1156     median: 1145 (43%)     max: 1190 Points
Power Consumption - Geekbench 5.5 Power Consumption 150cd *
100%
1 A15 +
min: 4.54     avg: 4.9     median: 5 (2%)     max: 5.64 Watt
Power Consumption - Idle Power Consumption 150cd 1min *
100%
1 A15 +
min: 0     avg: 0.7     median: 0.7 (1%)     max: 1.415 Watt

Average Benchmarks Apple A15 Bionic → 100% n=14

Average Benchmarks Qualcomm Snapdragon 8+ Gen 1 → 104% n=14

- Range of benchmark values for this graphics card
red legend - Average benchmark values for this graphics card
* Smaller numbers mean a higher performance
1 This benchmark is not used for the average calculation

Add one or more devices and compare

In the following list you can select (and also search for) devices that should be added to the comparison. You can select more than one device.

restrict list:
v1.33
log 07. 15:07:22

#0 ran 0s before starting gpusingle class +0s ... 0s

#1 checking url part for id 13825 +0s ... 0s

#2 checking url part for id 14528 +0s ... 0s

#3 redirected to Ajax server, took 1754572042s time from redirect:0 +0s ... 0s

#4 did not recreate cache, as it is less than 5 days old! Created at Thu, 07 Aug 2025 05:18:16 +0200 +0s ... 0s

#5 composed specs +0.003s ... 0.003s

#6 did output specs +0s ... 0.003s

#7 getting avg benchmarks for device 13825 +0.001s ... 0.004s

#8 got single benchmarks 13825 +0.007s ... 0.011s

#9 getting avg benchmarks for device 14528 +0.001s ... 0.012s

#10 got single benchmarks 14528 +0.021s ... 0.033s

#11 got avg benchmarks for devices +0s ... 0.033s

#12 min, max, avg, median took s +0.019s ... 0.053s

#13 return log +0s ... 0.053s

Please share our article, every link counts!
Mail Logo
> Expert Reviews and News on Laptops, Smartphones and Tech Innovations > Benchmarks / Tech > Processor Comparison - Head 2 Head
Redaktion, 2017-09- 8 (Update: 2023-07- 1)