Notebookcheck Logo

Apple A14 Bionic vs Apple M1

Apple A14 Bionic

► remove from comparison Apple A14

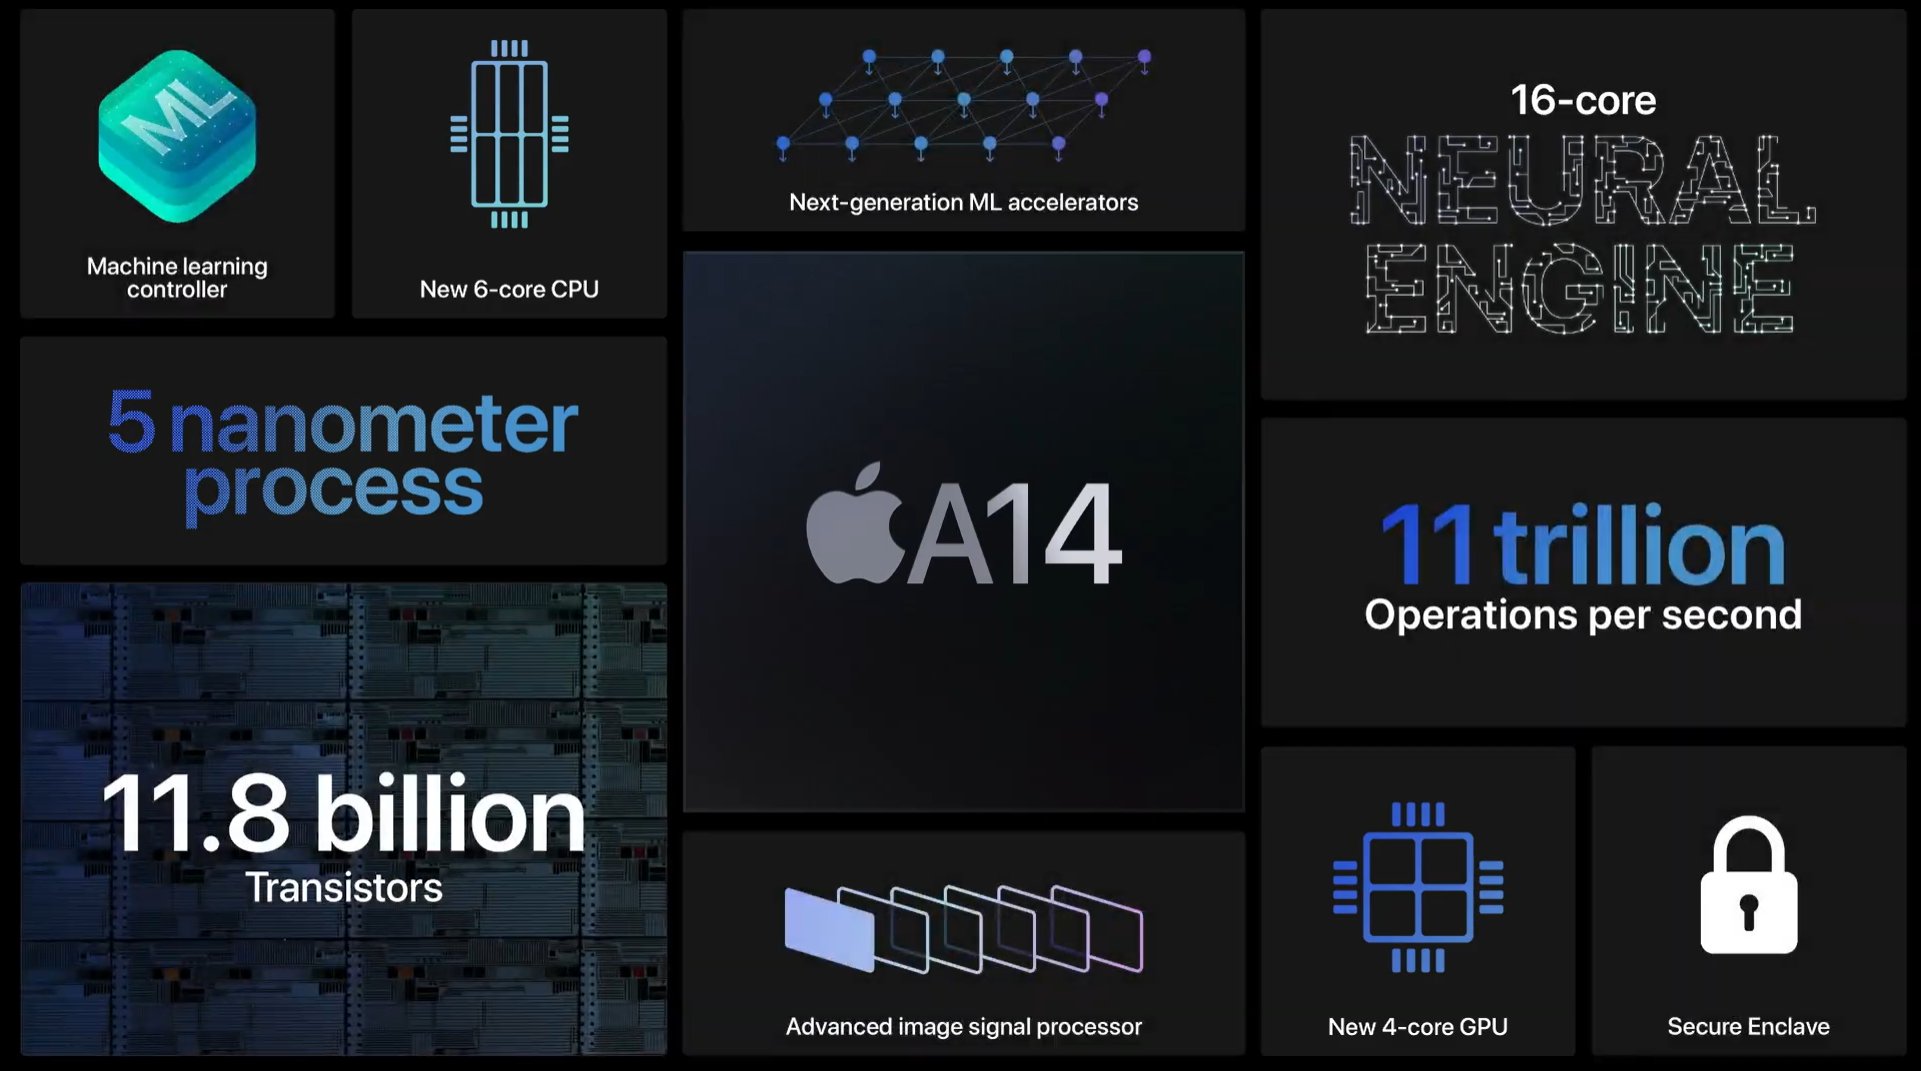
The Apple A14 Bionic is a System on a Chip (SoC) from Apple that is found in the iPhone 12 and iPad Air (2020) models. It was announced late 2020 and offers 6 cores divided in 2 performance cores (Firestorm) and four power efficiency cores (Icestorm). Apple states that the A14 offers a 40 percent higher CPU performance than the old A12 in the iPad Air 2019. That should translate to a modest gain of around 20% compared to the Apple A13. The A14 integrates a fast 4-core-GPU and a 16-core Neural Engine that is able to reach a maximum of 11 TOPS. The memory controller supports LPDDR4X and 4 or 6 GB are directly above the chip (package on package - PoP).

The chip is manufactured in 5nm and integrates 11.8 billion transistors.

Apple M1

► remove from comparison Apple M1

The Apple M1 is a System on a Chip (SoC) from Apple that is found in the late 2020 MacBook Air, MacBook Pro 13, and Mac Mini. It offers 8 cores divided in four performance cores and four power-efficiency cores. The big cores offer 192 KB instruction cache, 128 KB data cache, and 12 MB shared L2 cache. According to Apple the performance of these cores should be better than anything on the market (in late 2020). The four efficiency cores are a lot smaller and offer only 128 KB instruction cache, 64 KB data cache, and 4 MB shared cache. The efficiency cores (E cluster) clock with 600 - 2064 MHz, the performance cores (P cluster) with 600 - 3204 MHz.

The M1 is available in two TDP variants, a passive cooled 10 Watt variant for the MacBook Air and an active cooled faster variant for the MacBook Pro 13 and Mac Mini. Those should offer a better-sustained performance according to Apple.

The integrated graphics card in the M1 offers 8 cores (7 cores in the entry MacBook Air) and a peak performance of 2.6 teraflops. Apple claims that it is faster than any other iGPU at the time of announcement.

Furthermore, the SoC integrates a fast 16 core neural engine with a peak performance of 11 TOPS (for AI hardware acceleration), a secure enclave (e.g., for encryption), a unified memory architecture, Thunderbolt / USB 4 controller, an ISP, and media de- and encoders.

The Apple M1 includes 16 billion transistors (up from the 10 billion of the A12Z Bionic and therefore double the amount of a Tiger Lake-U chip like the i7-1185G7) and is manufactured in 5nm at TSMC.

ModelApple A14 BionicApple M1
CodenameFirestorm, Icestorm
SeriesApple Apple A-SeriesApple M1
Clock1800 - 3100 MHz2064 - 3220 MHz
L2 Cache12 MB16 MB
L3 Cache16 MB8 MB
Cores / Threads6 / 68 / 8
Transistors11800 Million16000 Million
Technology5 nm5 nm
FeaturesARMv8 Instruction Set, Machine Learning Controller, 16-Core Neural Engine, Secure Enclave, Advanced Image Signal ProcessorARMv8 Instruction Set
iGPUApple A14 Bionic GPUApple M1 8-Core GPU
NPU / AI11 TOPS INT8
ArchitectureARMARM
Announced
Series: M1
Apple M1 Max compare2.06 - 3.22 GHz10 / 10 cores48 MB L3
Apple M1 Pro compare2.06 - 3.22 GHz10 / 10 cores24 MB L3
Apple M1 Pro 8-Core compare2.06 - 3.22 GHz8 / 8 cores16 MB L3
Apple M1 « 2.06 - 3.22 GHz8 / 8 cores8 MB L3
L1 Cache2 MB
Chip AI11 TOPS INT8

Benchmarks

Cinebench 2024 - Cinebench 2024 CPU Single Core
100%
1 M1 +
110 Points (55%)
Cinebench 2024 - Cinebench 2024 CPU Multi Core
100%
1 M1 +
444 Points (8%)
Cinebench R23 - Cinebench R23 Multi Core
100%
1 M1 +
min: 7409     avg: 7728     median: 7800.5 (7%)     max: 7830 Points
Cinebench R23 - Cinebench R23 Single Core
100%
1 M1 +
min: 1496     avg: 1512     median: 1514.5 (62%)     max: 1520 Points
Cinebench R20 - Cinebench R20 CPU (Single Core)
100%
1 M1 +
min: 401     avg: 403     median: 402.5 (44%)     max: 406 Points
Cinebench R20 - Cinebench R20 CPU (Multi Core)
100%
1 M1 +
min: 1863     avg: 2040     median: 2093.5 (5%)     max: 2109 Points
Cinebench R15 - Cinebench R15 CPU Multi 64 Bit
100%
1 M1 +
min: 1020     avg: 1063     median: 1072 (7%)     max: 1087 Points
Cinebench R15 - Cinebench R15 CPU Single 64 Bit
100%
1 M1 +
min: 206     avg: 207.3     median: 208 (58%)     max: 208 Points
7-Zip 18.03 - 7-Zip 18.03 Multi Thread 4 runs
100%
1 M1 +
34614 MIPS (20%)
7-Zip 18.03 - 7-Zip 18.03 Single Thread 4 runs
100%
1 M1 +
5441 MIPS (64%)
Blender - Blender 3.3 Classroom CPU *
100%
1 M1 +
964 Seconds (12%)
Blender - Blender 2.79 BMW27 CPU *
100%
1 M1 +
min: 412     avg: 561     median: 561 (4%)     max: 710 Seconds
R Benchmark 2.5 - R Benchmark 2.5 *
100%
1 M1 +
0.7 sec (16%)
3DMark - 3DMark Ice Storm Unlimited Physics
100%
1 A14 +
min: 38650     avg: 39042     median: 39161.5 (31%)     max: 39194 Points
3DMark - 3DMark Sling Shot Extreme (ES 3.1) Unlimited Physics
100%
A14 +
min: 2631     avg: 2892     median: 2890 (27%)     max: 3187 Points
94%
M1 +
2711 Points (25%)
3DMark - 3DMark Sling Shot (ES 3.0) Unlimited Physics
100%
A14 +
min: 2622     avg: 2953     median: 3053 (35%)     max: 3084 Points
103%
M1 +
min: 1956     avg: 3137     median: 3136.5 (36%)     max: 4317 Points
Geekbench 6.5 - Geekbench 6.5 Single-Core
100%
A14 +
2171 Points (50%)
109%
M1 +
2363 Points (55%)
Geekbench 6.5 - Geekbench 6.5 Multi-Core
100%
A14 +
5064 Points (20%)
170%
M1 +
8622 Points (33%)
Geekbench 6.0 - Geekbench 6.0 Single-Core
100%
1 M1 +
2366 Points (75%)
Geekbench 6.0 - Geekbench 6.0 Multi-Core
100%
1 M1 +
8635 Points (35%)
Geekbench 5.5 - Geekbench 5.1 - 5.5 64 Bit Single-Core
100%
A14 +
min: 1326     avg: 1549     median: 1588.5 (53%)     max: 1604 Points
Geekbench 5.5 - Geekbench 5.1 - 5.5 64 Bit Multi-Core
100%
A14 +
min: 3476     avg: 4019     median: 4093.5 (7%)     max: 4334 Points
Mozilla Kraken 1.1 - Kraken 1.1 Total Score *
100%
A14 +
min: 459.6     avg: 476.6     median: 462.8 (1%)     max: 547 ms
Sunspider - Sunspider 1.0 Total Score *
100%
A14 +
min: 85.6     avg: 85.9     median: 85.9 (1%)     max: 86.1 ms
112%
M1 +
min: 65.2     avg: 75.9     median: 76.4 (1%)     max: 86.1 ms
Octane V2 - Octane V2 Total Score
100%
A14 +
min: 55710     avg: 58132     median: 58528 (39%)     max: 59963 Points
107%
M1 +
min: 62055     avg: 63340     median: 62589.5 (41%)     max: 66974 Points
WebXPRT 4 - WebXPRT 4 Score
100%
A14 +
147 Points (38%)
129%
M1 +
189 Points (49%)
WebXPRT 3 - WebXPRT 3 Score
100%
A14 +
min: 191     avg: 196.3     median: 193.5 (35%)     max: 214 Points
AnTuTu v8 - AnTuTu v8 UX
100%
A14 +
min: 64361     avg: 86794     median: 91444 (76%)     max: 96435 Points
115%
M1 +
min: 104389     avg: 105297     median: 105297 (88%)     max: 106205 Points
AnTuTu v8 - AnTuTu v8 MEM
100%
A14 +
min: 83561     avg: 98724     median: 98475 (79%)     max: 113467 Points
113%
M1 +
min: 110874     avg: 111266     median: 111266 (90%)     max: 111658 Points
AnTuTu v8 - AnTuTu v8 GPU
100%
A14 +
min: 211292     avg: 242531     median: 240861 (44%)     max: 264957 Points
224%
M1 +
min: 533978     avg: 539206     median: 539206 (99%)     max: 544434 Points
AnTuTu v8 - AnTuTu v8 CPU
100%
A14 +
min: 123814     avg: 152893     median: 149088 (54%)     max: 179419 Points
182%
M1 +
min: 267169     avg: 271808     median: 271808 (98%)     max: 276446 Points
AnTuTu v8 - AnTuTu v8 Total Score
100%
A14 +
min: 510245     avg: 580942     median: 569468 (55%)     max: 647374 Points
180%
M1 +
min: 1017190     avg: 1027580     median: 1027580 (99%)     max: 1037960 Points
Antutu v9 - AnTuTu v9 Total Score
100%
A14 +
min: 691084     avg: 725392     median: 708280 (34%)     max: 776812 Points
157%
M1 +
min: 1040910     avg: 1113810     median: 1113810 (54%)     max: 1186710 Points
Antutu v9 - AnTuTu v9 CPU
100%
A14 +
min: 189239     avg: 198226     median: 194080 (48%)     max: 211360 Points
131%
M1 +
min: 244643     avg: 254253     median: 254252 (63%)     max: 263862 Points
PassMark PerformanceTest Mobile V1 - PerformanceTest Mobile V1 CPU Tests
100%
1 A14 +
44785 Points (6%)
CrossMark - CrossMark Overall
100%
A14 +
min: 987     avg: 1002     median: 1000 (37%)     max: 1022 Points
128%
M1 +
min: 1266     avg: 1301     median: 1283 (48%)     max: 1355 Points
Power Consumption - Cinebench R15 Multi Power Consumption - external Monitor *
100%
1 M1 +
27.2 Watt (5%)
Power Consumption - Geekbench 5.5 Power Consumption 150cd *
100%
1 A14 +
7.3 Watt (3%)
86%
1 M1 +
min: 8.23     avg: 8.7     median: 8.5 (4%)     max: 9.49 Watt
Power Consumption - Idle Power Consumption - external Monitor *
100%
1 M1 +
3 Watt (2%)
Power Consumption - Idle Power Consumption 150cd 1min *
100%
1 A14 +
3.1 Watt (2%)
98%
1 M1 +
min: 2.29     avg: 2.9     median: 3.1 (2%)     max: 3.22 Watt
Power Consumption - Power Efficiency - Cinebench R15 Multi external Monitor
100%
1 M1 +
37.5 Points per Watt (28%)

Average Benchmarks Apple A14 Bionic → 100% n=19

Average Benchmarks Apple M1 → 136% n=19

- Range of benchmark values for this graphics card
red legend - Average benchmark values for this graphics card
* Smaller numbers mean a higher performance
1 This benchmark is not used for the average calculation

Add one or more devices and compare

In the following list you can select (and also search for) devices that should be added to the comparison. You can select more than one device.

restrict list:
v1.35
log 09. 19:06:59

#0 ran 0s before starting gpusingle class +0s ... 0s

#1 checking url part for id 12759 +0s ... 0s

#2 checking url part for id 12937 +0s ... 0s

#3 redirected to Ajax server, took 1765303619s time from redirect:0 +0s ... 0s

#4 did not recreate cache, as it is less than 5 days old! Created at Sun, 07 Dec 2025 05:18:56 +0100 +0s ... 0s

#5 composed specs +0.005s ... 0.005s

#6 did output specs +0s ... 0.005s

#7 getting avg benchmarks for device 12759 +0.001s ... 0.005s

#8 got single benchmarks 12759 +0.006s ... 0.012s

#9 getting avg benchmarks for device 12937 +0.001s ... 0.012s

#10 got single benchmarks 12937 +0.008s ... 0.02s

#11 got avg benchmarks for devices +0s ... 0.02s

#12 min, max, avg, median took s +0.036s ... 0.056s

#13 return log +0s ... 0.056s

Please share our article, every link counts!
Mail Logo
> Expert Reviews and News on Laptops, Smartphones and Tech Innovations > Benchmarks / Tech > Processor Comparison - Head 2 Head
Redaktion, 2017-09- 8 (Update: 2023-07- 1)