

AMD A10 Pro-7350B vs AMD A6-6310
AMD A10 Pro-7350B
► remove from comparison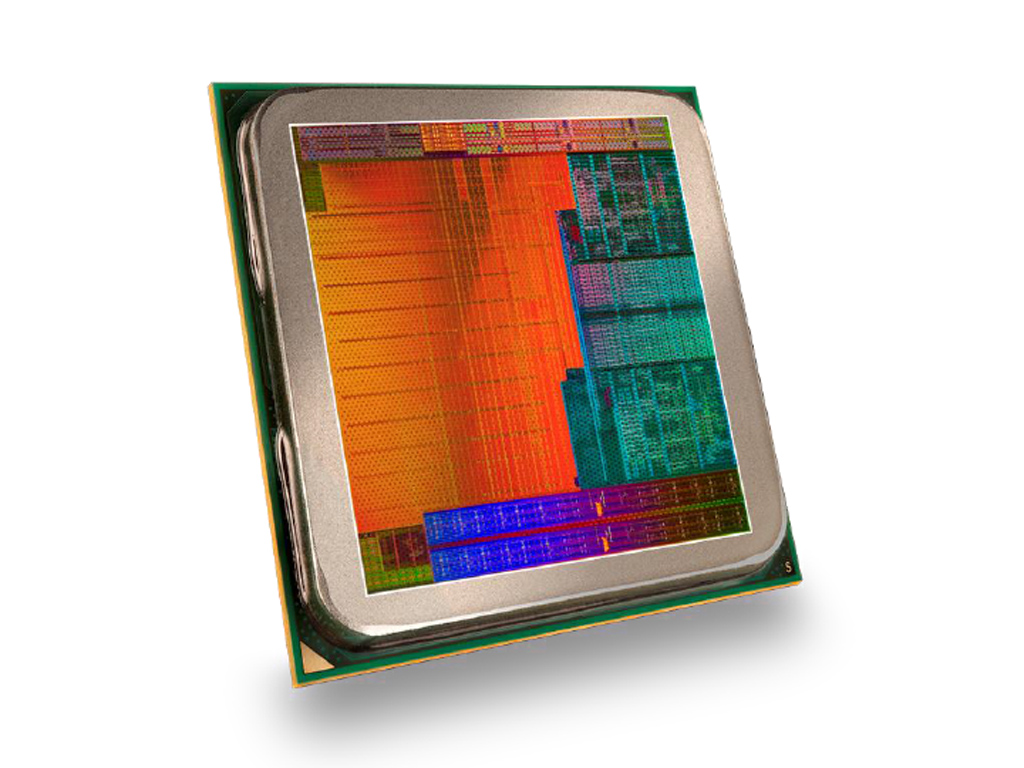
The AMD A10 Pro-7350B is a power efficient ULV (Ultra Low Voltage) quad-core processor based on the Kaveri architecture. It was revealed in June 2014 for notebooks and is manufactured by GlobalFoundries using a 28 nm SHP process. In addition to having two CPU modules for a total of four integer cores clocked at 2.1 - 3.3 GHz, the AMD chip also integrates a Radeon R6 GPU clocked at up to 553 MHz with 384 GCN shaders and a dual-channel DDR3-1600 memory controller.
Technically, the 7350B is almost identical with the consumer model FX-7500. However, AMD guarantees an especially high stability and durability for the business-oriented Pro-Series.
Architecture
Kaveri is the successor to the 2013 Richland architecture (e.g. A10-5750M). The revised CPU cores, codenamed Steamroller, represent the third generation of the module-based Bulldozer design. A number of major changes include modified decoders (now one per integer core), optimized branch prediction, and increased L1 I-cache from 64 KB to 96 KB per module. These revisions boost the performance per clock slightly over a similarly clocked Richland APU. For more details about the AMD Kaveri architecture, see our detailed analysis here:
Analysis of the AMD Kaveri Notebook Platform
Performance
According to our benchmarks (shown below), the A10 Pro-7350B offers a CPU performance level similar to the Haswell-based Intel Core i3-4100U. Overall, the 7350B will be sufficient for all daily workloads (Office, Internet browsing, multimedia) as well as light multitasking.
Graphics
The Radeon R6 (Kaveri) GPU of the A10 Pro-7350B features a core clock of up to 553 MHz and 384 shader units. Since the GPU is based on AMD's GCN 1.1 architecture, both DirectX 11.2 "Tier 2" and Mantle are supported. Furthermore, the GPU can be used for general purpose computing in various applications, such as Adobe Photoshop via the OpenCL API.
In terms of 3D performance, the GPU is almost as fast as a dedicated GeForce GT 720M and can handle many current games at low or medium settings at (W)XGA resolution.
Power Consumption
The power consumption of the entire APU is rated at 19 Watts, which is somewhat above the Haswell ULV CPUs from Intel (15 W including chipset). Nevertheless, the A10 Pro-7350B is suited for 12 - 13-inch notebooks or larger.
AMD A6-6310
► remove from comparison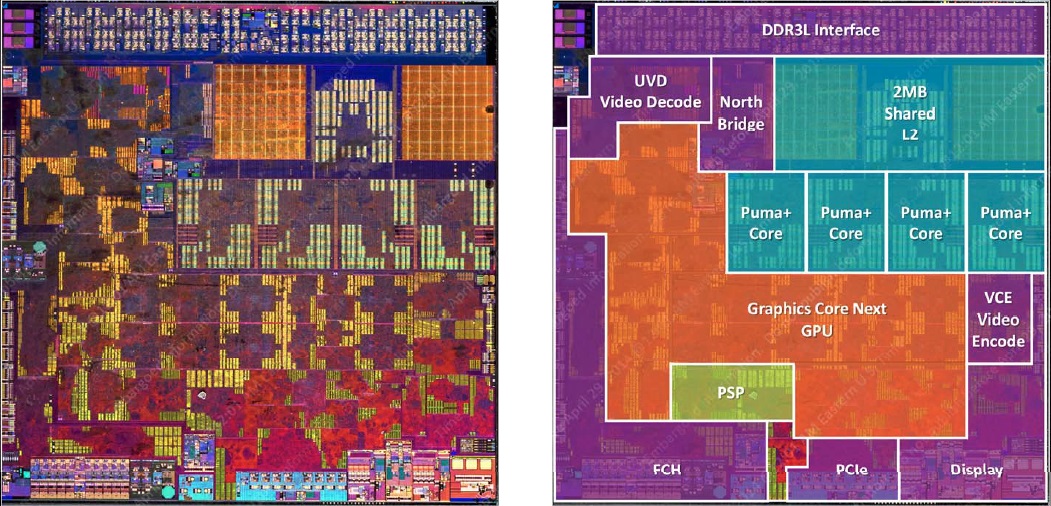
The AMD A6-6310 is a mobile quad-core SoC (codenamed "Beema") for entry-level devices and subnotebooks, which has been presented in April 2014. In addition to 4 CPU cores clocked at 1.8 - 2.4 GHz (boost clock), the 28 nanometer chip also integrates a Radeon R4 GPU, a single-channel DDR3L-1866 memory controller and the Southbridge with various I/O-ports.
Architecture
Both Beema (for notebooks) and Mullins (for tablets and compact subnotebooks, same die) are based on AMD's Puma+ architecture, which is the successor to the previous Jaguar design (Kabini and Temash APUs). Neither the performance per clock nor the feature set (including SSE up to 4.2, AVX and AES) have been modified. However, AMD managed to reduce the leakage current, enabling significantly higher (boost) clock speeds. This leads to a more responsive system and better overall performance. As its predecessor, the chip is manufactured in 28 nm, however by Globalfoundires instead of TSMC.
Performance
Thanks to its higher boost clock, the A6-6310 slightly outperforms the former A6-5200 (25 W, 2.0 GHz) in single thread tasks. The multi thread performance is quite similar and on par with Intel's Core i3-4010U. Overall, the A6-6310 should be sufficient for all daily workloads like Office, Internet browsing and multimedia.
Graphics
The SoC integrates a Radeon R4 GPU with 128 shaders, which is based on the GCN architecture and clocked at up to 800 MHz. On average, the graphics performance is comparable to Intel's HD Graphics 4200 or a dedicated Radeon HD 7470M . Only a few current games (as of 2014) are thus playable in low settings, but older and less demanding titels will run flawlessly.
Power Consumption
The power consumption of the entire SoC is rated at 15 watts. Thus, the APU is suitable for smaller subnotebooks.
| Model | AMD A10 Pro-7350B | AMD A6-6310 | ||||||||||||||||||||||||||||||||||||||||||||||||||||
| Codename | Kaveri | Beema | ||||||||||||||||||||||||||||||||||||||||||||||||||||
| Series | AMD Kaveri | AMD AMD A-Series | ||||||||||||||||||||||||||||||||||||||||||||||||||||
| Series: AMD A-Series Beema |
|
| ||||||||||||||||||||||||||||||||||||||||||||||||||||
| Clock | 2100 - 3300 MHz | 1800 - 2400 MHz | ||||||||||||||||||||||||||||||||||||||||||||||||||||
| L2 Cache | 4 MB | 2 MB | ||||||||||||||||||||||||||||||||||||||||||||||||||||
| Cores / Threads | 4 / 4 | 4 / 4 | ||||||||||||||||||||||||||||||||||||||||||||||||||||
| TDP | 19 Watt | 15 Watt | ||||||||||||||||||||||||||||||||||||||||||||||||||||
| Transistors | 2410 Million | 930 Million | ||||||||||||||||||||||||||||||||||||||||||||||||||||
| Technology | 28 nm | 28 nm | ||||||||||||||||||||||||||||||||||||||||||||||||||||
| Die Size | 245 mm2 | 107 mm2 | ||||||||||||||||||||||||||||||||||||||||||||||||||||
| Features | SSE (1, 2, 3, 3S, 4.1, 4.2, 4A), x86-64, AES, AVX, FMA, DDR3-1600 Controller | SSE (1, 2, 3, 3S, 4.1, 4.2, 4A), x86-64, AES, AVX, Single-Channel DDR3L-1866 | ||||||||||||||||||||||||||||||||||||||||||||||||||||
| iGPU | AMD Radeon R6 (Kaveri) (? - 553 MHz) | AMD Radeon R4 (Beema) (? - 800 MHz) | ||||||||||||||||||||||||||||||||||||||||||||||||||||
| Architecture | x86 | x86 | ||||||||||||||||||||||||||||||||||||||||||||||||||||
| Announced | ||||||||||||||||||||||||||||||||||||||||||||||||||||||
| Manufacturer | www.amd.com | |||||||||||||||||||||||||||||||||||||||||||||||||||||
| L1 Cache | 256 KB |

Benchmarks
Average Benchmarks AMD A10 Pro-7350B → 100% n=32
Average Benchmarks AMD A6-6310 → 99% n=32
* Smaller numbers mean a higher performance
1 This benchmark is not used for the average calculation