Notebookcheck Logo

Samsung Exynos 8895 Octa vs HiSilicon Kirin 659

Samsung Exynos 8895 Octa

► remove from comparison

The Samsung Exynos 9 8895 Octa is a System on a Chip (SoC) for smartphones and tablets. It was announced early 2017 and is one of the first SoCs that is produced in 10nm (together with the Snapdragon 835). It first appeared in the Samsung Galaxy S8 and S8 Plus and contains four Samsung M1 cores at up to 2.3 GHz and four ARM Cortex-A53 cores to save power. As a GPU it integrates the ARM Mali-G71 MP20. Furthermore, a Cat.16 5CA 1 Gbps (download) and Cat.13 2CA 150 MBps (upload) LTE modem and a LPDDR4x memory controller is integrated. The video engine is capable of en- and decoding 4K UHD 120 fps H.265, H.264 and VP9 according to Samsung.

The performance of the CPU cores seems compareable to the Snapdragon 835 and therefore it should be one of the fastest processors for Android phones in early 2017.

HiSilicon Kirin 659

► remove from comparison  Kirin 659

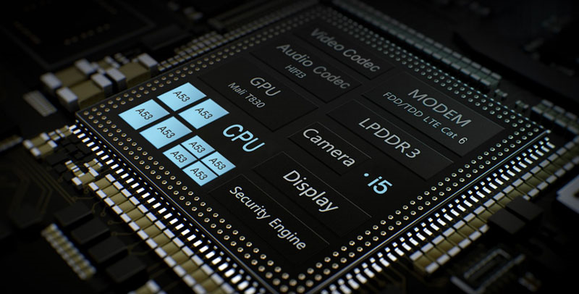
The HiSilicon Kirin 659 is an ARM-based octa-core SoC for mid-range smartphones and tablets. It was announced mid 2017 and features eight ARM Cortex-A53 cores. Four cores can be clocked with up to 1.7 GHz (power saving cores) and four with up to 2.36 GHz (performance cores). The difference to the older Kirin 650 and Kirin 655 SoCs is the higher clock speed of the performance cores (2.35 versus 2.1 and 2.0 GHz). The slightly older Kirin 658 is very similar. The 659 is in our benchmarks around 4% faster than the 658 and offers a better LTE radio (Cat. 13).

Furthermore, a ARM Mali-T830 MP2 graphics card (at >=900 MHz), a 64-Bit LPDDR3 memory controller and a dual-sim capable LTE Cat. 6 (max. 300 MBit/s and GSM, WCDMA, UMTS, HSPA+) radio are integrated in the SoC. The processor performance can be compared with the older Kirin 930 and therefore sufficient for daily usage as browsing and non demanding apps. High-end SoCs with Cortex-A57 or A72 cores however should be noticeably faster. The SoC is produced in a modern 16nm FinFET process and is therefore very power efficient.

ModelSamsung Exynos 8895 OctaHiSilicon Kirin 659
CodenameMongoose / Cortex-A53Cortex-A53
SeriesSamsung Exynos
Series: Exynos Mongoose / Cortex-A53
Samsung Exynos 8895 Octa « 2.3 GHz8 / 8 cores Mongoose / Cortex-A53
Samsung Exynos 8890 Octa compare2.6 GHz8 / 8 cores Mongoose / Cortex-A53
Clock2300 MHz2360 MHz
Cores / Threads8 / 88 / 8
Technology10 nm16 nm
FeaturesARM Mali-T880MP20 GPU , 4x Mongoose (2.3), 4x Cortex-A53 big.LITTLE, LPDDR4x Memory ControllerARMv8-ISA, Mali-T830 MP2, Dual SIM LTE (Cat. 6), LPDDR3 Memory Controller
iGPUARM Mali-G71 MP20ARM Mali-T830 MP2
ArchitectureARMARM
Announced
Manufacturerwww.samsung.com

Benchmarks

3DMark - 3DMark Ice Storm Extreme Physics
12599 Points (10%)
3DMark - 3DMark Ice Storm Unlimited Physics
min: 20892     avg: 21755     median: 21543 (17%)     max: 22829 Points
3DMark - 3DMark Sling Shot Extreme (ES 3.1) Unlimited Physics
min: 2417     avg: 2469     median: 2479 (23%)     max: 2512 Points
3DMark - 3DMark Sling Shot (ES 3.0) Unlimited Physics
min: 1816     avg: 2227     median: 2410 (28%)     max: 2454 Points
Geekbench 4.4 - Geekbench 4.1 - 4.4 64 Bit Single-Core
min: 1997     avg: 2013     median: 2015 (20%)     max: 2028 Points
Geekbench 4.4 - Geekbench 4.1 - 4.4 64 Bit Multi-Core
min: 6695     avg: 6717     median: 6711 (7%)     max: 6744 Points
Geekbench 4.0 - Geekbench 4.0 64 Bit Single-Core
min: 1952     avg: 1970     median: 1970 (22%)     max: 1988 Points
min: 887     avg: 888     median: 888 (10%)     max: 889 Points
Geekbench 4.0 - Geekbench 4.0 64 Bit Multi-Core
min: 6300     avg: 6337     median: 6337 (8%)     max: 6375 Points
min: 3438     avg: 3473     median: 3473 (5%)     max: 3508 Points
Geekbench 3 - Geekbench 3 64 Bit Multi-Core
min: 5683     avg: 5768     median: 5768 (9%)     max: 5853 Points
3508 Points (5%)
Geekbench 3 - Geekbench 3 64 Bit Single-Core
min: 1539     avg: 1541     median: 1540.5 (23%)     max: 1542 Points
876 Points (13%)
Geekbench 2 - 32 Bit - Geekbench Stream
1208 Points (6%)
968 Points (5%)
Geekbench 2 - 32 Bit - Geekbench Memory
1899 Points (13%)
2829 Points (20%)
Geekbench 2 - 32 Bit - Geekbench Floating Point
11306 Points (22%)
5944 Points (12%)
Geekbench 2 - 32 Bit - Geekbench Integer
5338 Points (11%)
3298 Points (7%)
Geekbench 2 - 32 Bit - Geekbench Total Score
6325 Points (17%)
3897 Points (10%)
Mozilla Kraken 1.1 - Kraken 1.1 Total Score *
min: 1877     avg: 2000     median: 1887 (2%)     max: 2237 ms
min: 8684     avg: 9440     median: 9271 (11%)     max: 10788 ms
Sunspider - Sunspider 1.0 Total Score *
1173 ms (13%)
Octane V2 - Octane V2 Total Score
min: 12941     avg: 13419     median: 13265 (10%)     max: 14050 Points
min: 4191     avg: 4947     median: 4980 (4%)     max: 5471 Points
WebXPRT 3 - WebXPRT 3 Score
min: 34     avg: 38.7     median: 40 (7%)     max: 42 Points
Vellamo 3.x - Vellamo 3.x Metal
min: 3407     avg: 3514     median: 3513.5 (94%)     max: 3620 Points
Vellamo 3.x - Vellamo 3.x Multicore Beta
min: 3325     avg: 3480     median: 3479.5 (77%)     max: 3634 Points
Vellamo 3.x - Vellamo 3.x Browser
min: 7270     avg: 7368     median: 7368 (97%)     max: 7466 Points
Quadrant Standard Edition 2.0 - Quadrant Standard 2.0 Total Score
43185 points (100%)
AnTuTu v6 - AnTuTu v6 Total Score
min: 165382     avg: 170421     median: 171884 (59%)     max: 173997 Points
AnTuTu v7 - AnTuTu v7 MEM
8027 Points (25%)
min: 7947     avg: 8633     median: 8430.5 (26%)     max: 9656 Points
AnTuTu v7 - AnTuTu v7 UX
43027 Points (53%)
min: 21484     avg: 23751     median: 24193.5 (30%)     max: 24268 Points
AnTuTu v7 - AnTuTu v7 GPU
77928 Points (24%)
min: 12982     avg: 13331     median: 13167.5 (4%)     max: 14340 Points
AnTuTu v7 - AnTuTu v7 CPU
72228 Points (44%)
min: 39451     avg: 41305     median: 41643.5 (25%)     max: 41874 Points
AnTuTu v7 - AnTuTu v7 Total Score
201210 Points (36%)
min: 81992     avg: 87019     median: 87511.5 (15%)     max: 89639 Points
AndEBench - AndEBench Java
1694 Iter./s (52%)
AndEBench - AndEBench Native
20418 Iter./s (67%)
PassMark PerformanceTest Mobile V1 - PerformanceTest Mobile V1 CPU Tests
238041 Points (31%)
min: 122441     avg: 127602     median: 127602 (17%)     max: 132762 Points
PCMark for Android - PCM f. Android Work 2.0 Battery Life
min: 495     avg: 518     median: 527 (10%)     max: 533 min
PCMark for Android - PCM f. Android Computer Vision
min: 2647     avg: 2687     median: 2683 (14%)     max: 2730 Points
min: 2413     avg: 2626     median: 2635 (14%)     max: 2819 Points
PCMark for Android - PCM f. Android Storage
min: 4420     avg: 4508     median: 4520 (10%)     max: 4585 Points
min: 5970     avg: 7032     median: 6957 (15%)     max: 8244 Points
PCMark for Android - PCM f. Android Work Score 2.0
min: 5096     avg: 5220     median: 5195 (34%)     max: 5370 Points
PCMark for Android - PCM f. Android Work Score
min: 5830     avg: 5983     median: 6035 (30%)     max: 6084 Points

Average Benchmarks Samsung Exynos 8895 Octa → 100% n=27

Average Benchmarks HiSilicon Kirin 659 → 67% n=27

- Range of benchmark values for this graphics card
red legend - Average benchmark values for this graphics card
* Smaller numbers mean a higher performance
1 This benchmark is not used for the average calculation

Add one or more devices and compare

In the following list you can select (and also search for) devices that should be added to the comparison. You can select more than one device.

restrict list:
v1.33
log 18. 06:15:09

#0 ran 0s before starting gpusingle class +0s ... 0s

#1 checking url part for id 8590 +0s ... 0s

#2 checking url part for id 9252 +0s ... 0s

#3 redirected to Ajax server, took 1755490509s time from redirect:0 +0s ... 0s

#4 did not recreate cache, as it is less than 5 days old! Created at Sat, 16 Aug 2025 05:18:17 +0200 +0s ... 0s

#5 composed specs +0.004s ... 0.004s

#6 did output specs +0s ... 0.004s

#7 getting avg benchmarks for device 8590 +0.001s ... 0.004s

#8 got single benchmarks 8590 +0.005s ... 0.009s

#9 getting avg benchmarks for device 9252 +0.001s ... 0.01s

#10 got single benchmarks 9252 +0.009s ... 0.019s

#11 got avg benchmarks for devices +0s ... 0.019s

#12 min, max, avg, median took s +0.024s ... 0.043s

#13 return log +0s ... 0.043s

Please share our article, every link counts!
Mail Logo
> Expert Reviews and News on Laptops, Smartphones and Tech Innovations > Benchmarks / Tech > Processor Comparison - Head 2 Head
Redaktion, 2017-09- 8 (Update: 2023-07- 1)