Qualcomm Snapdragon 400 MSM8928 vs Apple S5 vs unknown
Qualcomm Snapdragon 400 MSM8928 ► remove from comparison
The Qualcomm Snapdragon 400 MSM8928 is an entry-level ARM-SoC for Android smartphones and tablets. It offers four Cortex-A7 cores clocked at up to 1.6 GHz (Quad-Core) as well as an Adreno 305 graphics card. Furthermore, a HSPA+/LTE radio is integrated in the SoC, which is manufactured in a 28-nanometer LP process.
Apple S5 ► remove from comparison
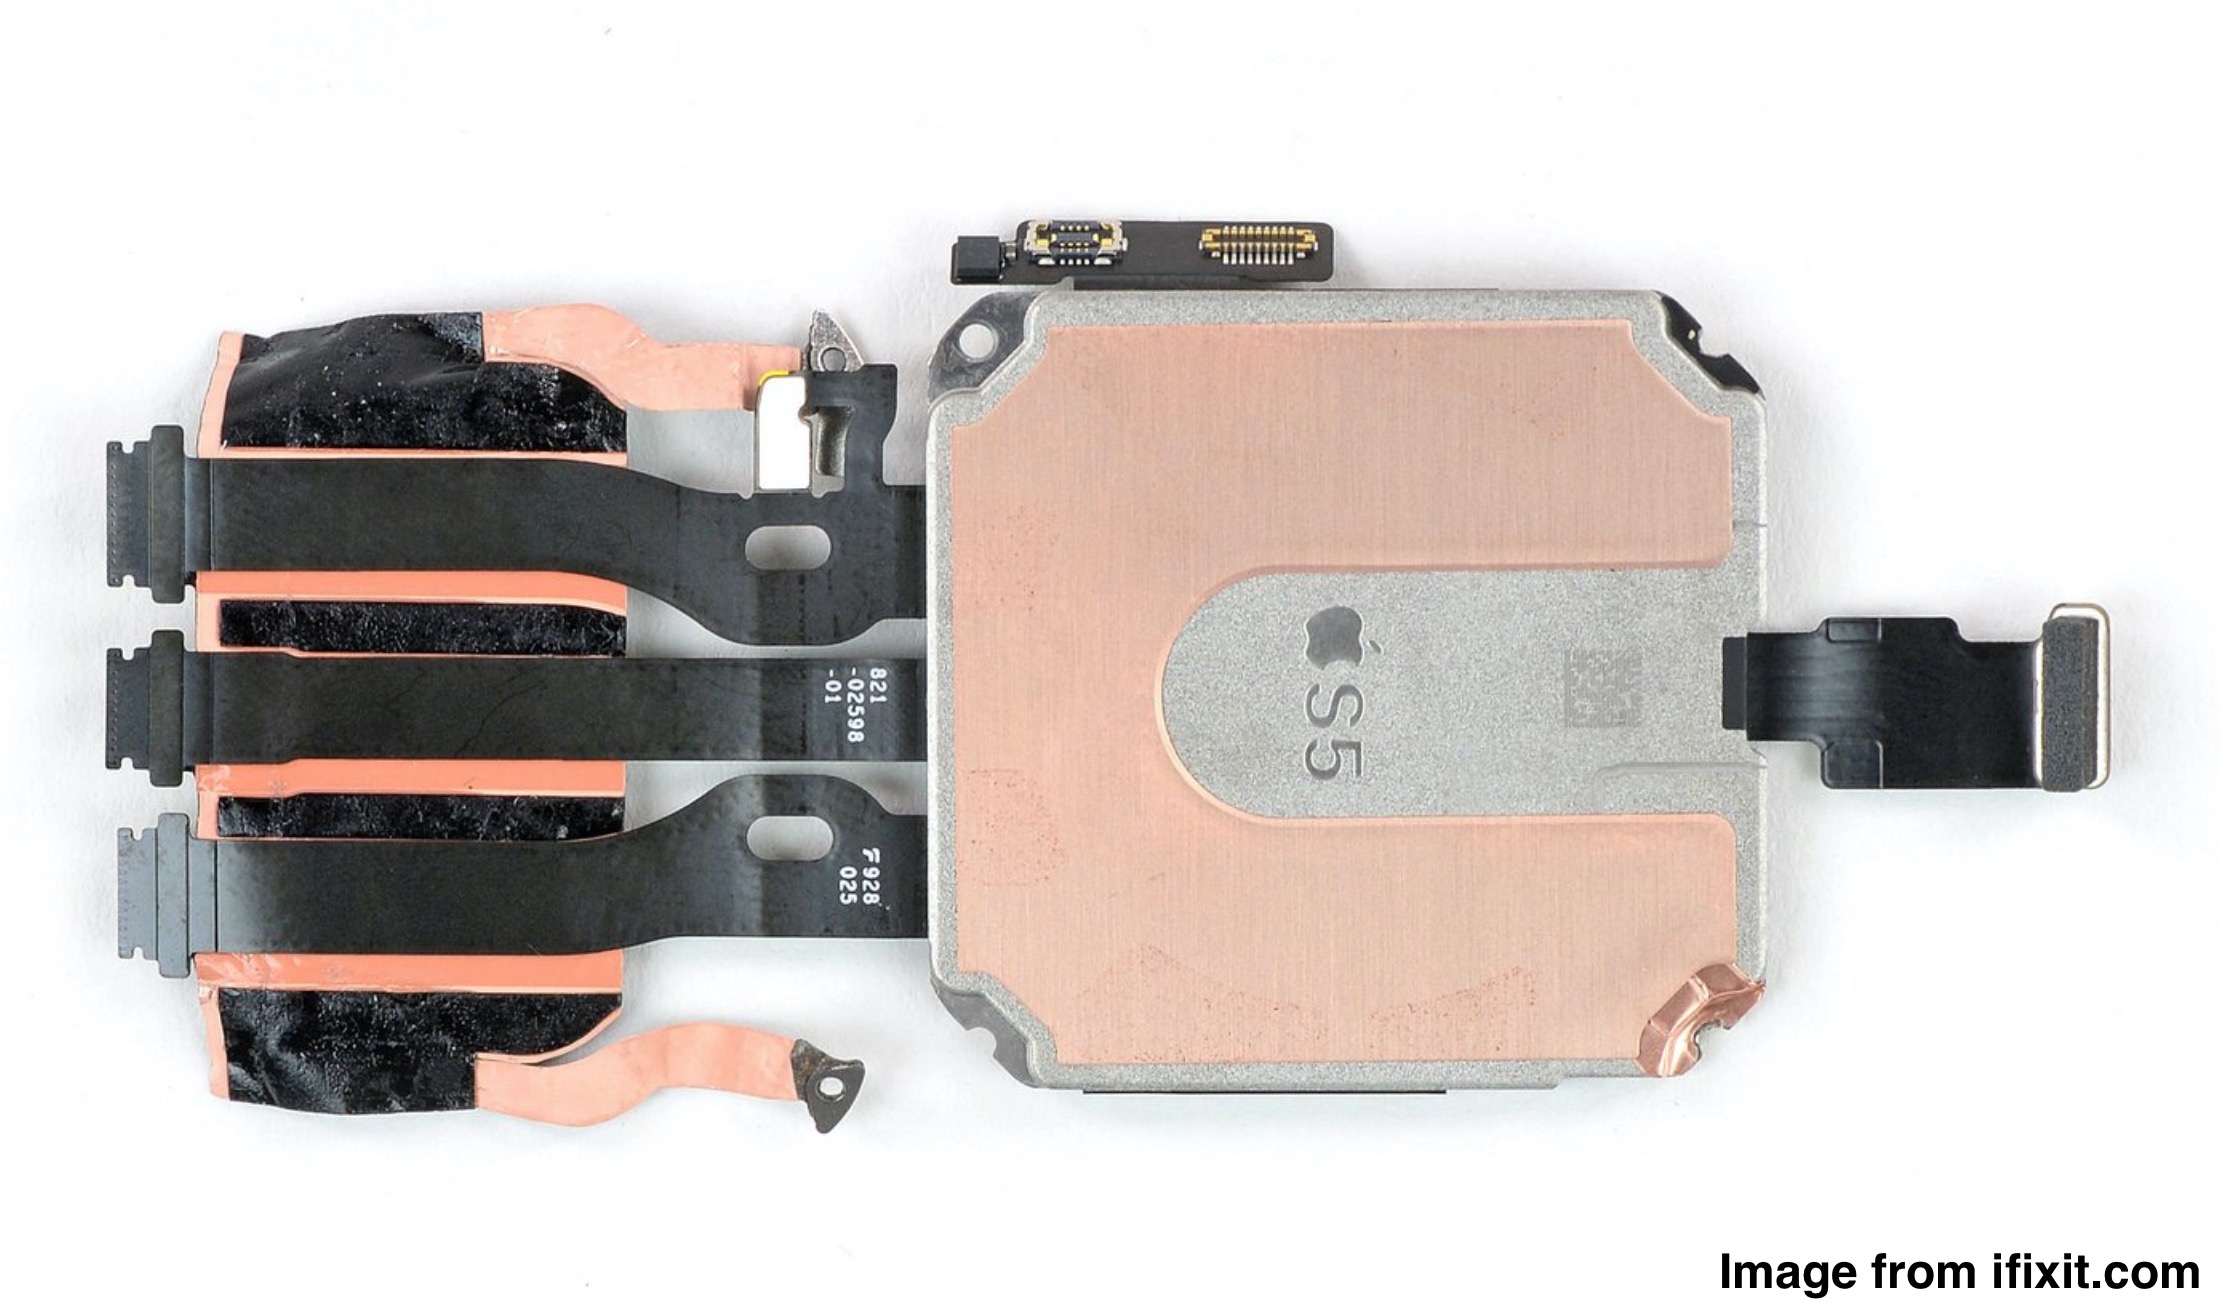
The Apple S5 is a 64-Bit dual core processor for the Apple Watch Series 5 (40 and 44mm). It integrates a GPU, 32 GB flash memory, Bluetooth 5.0, 1 GB RAM, 802.11 b/g/n 2.4 GHz WiFi and satellite positioning (GPS, GLONASS, Galileo, QZSS).
Model Qualcomm Snapdragon 400 MSM8928 Apple S5 unknown Series Qualcomm Snapdragon Apple Codename ARMv7 Series: Clock 1600 MHz Cores / Threads 4 / 4 2 / 2 Technology 28 nm Features Adreno 305 GPU, LPDDR2/3 Memory Controller, GSM/UMTS/WCDMA/LTE iGPU Qualcomm Adreno 305 Architecture ARM x86 Announced Manufacturer www.qualcomm.com
Benchmarks Cinebench R15 - Cinebench R15 CPU Multi 64 Bit
min: 1029 avg: 1038 median: 1038 (7%) max: 1047 Points
Model CPU GPU RAM Value Apple MacBook Pro 15 2019 i7 555X unknown unknown Win10 1029 Apple MacBook Pro 15 2019 i7 555X unknown unknown macOS 1047
3DMark - 3DMark Ice Storm Physics
min: 7756 avg: 8177 median: 8177 (7%) max: 8598 Points
3DMark - 3DMark Ice Storm Extreme Physics
min: 7704 avg: 8386 median: 8696 (7%) max: 8759 Points
3DMark - 3DMark Ice Storm Unlimited Physics
min: 7913 avg: 8927 median: 9016 (8%) max: 9761 Points
37732 Points (32%)
Model CPU GPU RAM Value Apple MacBook Pro 15 2019 i7 555X unknown unknown 37732
3DMark - 3DMark Cloud Gate Physics
8923 Points (23%)
Model CPU GPU RAM Value Apple MacBook Pro 15 2019 i7 555X unknown unknown 8923
3DMark - 3DMark Time Spy CPU
5039 Points (21%)
Model CPU GPU RAM Value Apple MacBook Pro 15 2019 i7 555X unknown unknown 5039
3DMark - 3DMark Sling Shot Extreme (ES 3.1) Unlimited Physics
min: 3612 avg: 4808 median: 4807.5 (57%) max: 6003 Points
Model CPU GPU RAM Value Vivo V40 SE 5G unknown unknown 8 GB 3612 Huawei Pura 70 Ultra unknown unknown 16 GB 6003
3DMark - 3DMark Sling Shot (ES 3.0) Unlimited Physics
785 Points (9%)
Geekbench 6.2 - Geekbench 6.2 Single-Core
min: 920 avg: 1183 median: 1183 (32%) max: 1446 Points
Model CPU GPU RAM Value Vivo V40 SE 5G unknown unknown 8 GB 920 Huawei Pura 70 Ultra unknown unknown 16 GB 1446
Geekbench 6.2 - Geekbench 6.2 Multi-Core
min: 2252 avg: 3368 median: 3368 (13%) max: 4484 Points
Model CPU GPU RAM Value Vivo V40 SE 5G unknown unknown 8 GB 2252 Huawei Pura 70 Ultra unknown unknown 16 GB 4484
Geekbench 5.5 - Geekbench 5.1 - 5.4 64 Bit Single-Core
min: 687 avg: 887 median: 887 (37%) max: 1087 Points
Model CPU GPU RAM Value Vivo V40 SE 5G unknown unknown 8 GB 687 Huawei Pura 70 Ultra unknown unknown 16 GB 1087
Geekbench 5.5 - Geekbench 5.1 - 5.4 64 Bit Multi-Core
min: 2071 avg: 3146 median: 3146 (6%) max: 4221 Points
Model CPU GPU RAM Value Vivo V40 SE 5G unknown unknown 8 GB 2071 Huawei Pura 70 Ultra unknown unknown 16 GB 4221
Geekbench 4.4 - Geekbench 4.1 - 4.4 64 Bit Single-Core
min: 3175 avg: 4274 median: 4788 (48%) max: 4860 Points
Model CPU GPU RAM Value Vivo V40 SE 5G unknown unknown 8 GB 3175 Huawei Pura 70 Ultra unknown unknown 16 GB 4788 Huawei Pura 70 Ultra unknown unknown Performance Mode 16 GB 4860
Geekbench 4.4 - Geekbench 4.1 - 4.4 64 Bit Multi-Core
min: 8143 avg: 12683 median: 14710 (16%) max: 15196 Points
Model CPU GPU RAM Value Vivo V40 SE 5G unknown unknown 8 GB 8143 Huawei Pura 70 Ultra unknown unknown 16 GB 14710 Huawei Pura 70 Ultra unknown unknown Performance Mode 16 GB 15196
Geekbench 4.0 - Geekbench 4.0 64 Bit Single-Core
441 Points (6%)
Geekbench 4.0 - Geekbench 4.0 64 Bit Multi-Core
1100 Points (3%)
Geekbench 3 - Geekbench 3 32 Bit Multi-Core
min: 1109 avg: 1309 median: 1338 (2%) max: 1451 Points
Geekbench 3 - Geekbench 3 32 Bit Single-Core
min: 338 avg: 393.3 median: 398.5 (8%) max: 438 Points
Linpack Android / IOS - Linpack Multi Thread
min: 150.1 avg: 221.7 median: 249.9 (8%) max: 265 MFLOPS
13 MFLOPS (0%)
Model CPU GPU RAM Value Archos Arnova 10 unknown unknown 12.95
Linpack Android / IOS - Linpack Single Thread
min: 67.9 avg: 87.9 median: 97.7 (10%) max: 98 MFLOPS
12.8 MFLOPS (1%)
Model CPU GPU RAM Value Archos Arnova 10 unknown unknown 12.8
Mozilla Kraken 1.1 - Kraken 1.1 Total Score *
min: 12714 avg: 14100 median: 13858 (16%) max: 15968 ms
min: 779.1 avg: 5662 median: 1253.9 (1%) max: 14953 ms
Model CPU GPU RAM Value Huawei Pura 70 Ultra unknown unknown Chrome 125 16 GB 779.1 Vivo V40 SE 5G unknown unknown Chrome 125 8 GB 1253.9 PocketBook Era Color unknown unknown 1 GB 14953
Sunspider - Sunspider 1.0 Total Score *
min: 1207 avg: 1429 median: 1404.5 (15%) max: 1701 ms
min: 2014 avg: 2022 median: 2022 (22%) max: 2030 ms
Sunspider - Sunspider 0.9.1 Total Score *
1529 ms (14%)
7004 ms (66%)
Model CPU GPU RAM Value Archos Arnova 10 unknown unknown 7004
Octane V2 - Octane V2 Total Score
min: 1894 avg: 2330 median: 2335 (2%) max: 2755 Points
min: 2672 avg: 21642 median: 17303 (16%) max: 49290 Points
Model CPU GPU RAM Value PocketBook InkPad Color 3 unknown unknown PocketBook Browser 1 GB 2672 PocketBook Era Color unknown unknown 1 GB 2753 Vivo V40 SE 5G unknown unknown Chrome 125 8 GB 31853 Huawei Pura 70 Ultra unknown unknown Chrome 125 16 GB 49290
WebXPRT 4 - WebXPRT 4 Score
0 Points (0%)
Model CPU GPU RAM Value Vivo V40 SE 5G unknown unknown 8 GB Huawei Pura 70 Ultra unknown unknown 16 GB
WebXPRT 3 - WebXPRT 3 Score
0 Points (0%)
Model CPU GPU RAM Value Vivo V40 SE 5G unknown unknown 8 GB Huawei Pura 70 Ultra unknown unknown 16 GB
Vellamo 3.x - Vellamo 3.x Metal
771 Points (21%)
Vellamo 3.x - Vellamo 3.x Multicore Beta
1248 Points (28%)
Vellamo 3.x - Vellamo 3.x Browser
1881 Points (25%)
Quadrant Standard Edition 2.0 - Quadrant Standard 2.0 Total Score
min: 9699 avg: 9949 median: 9948.5 (23%) max: 10198 points
AnTuTu v4 - AnTuTu v4 Total Score
17354 Points (40%)
AnTuTu v5 - AnTuTu v5 Total Score
19444 Points (20%)
AnTuTu v6 - AnTuTu v6 Total Score
24799 Points (8%)
AndEBench - AndEBench Java
min: 290 avg: 341 median: 341 (10%) max: 392 Iter./s
AndEBench - AndEBench Native
min: 5540 avg: 6590 median: 6590 (22%) max: 7640 Iter./s
PassMark PerformanceTest Mobile V1 - PerformanceTest Mobile V1 CPU Tests
min: 7044 avg: 7929 median: 7929 (1%) max: 8814 Points
PCMark for Android - PCM f. Android Work Score
2383 Points (12%)
PCMark for Android - PCM f. Android Storage 2.0 random write internal
37 MB/s (27%)
Model CPU GPU RAM Value Vivo V40 SE 5G unknown unknown 3.0.4061 8 GB 37
PCMark for Android - PCM f. Android Storage 2.0 seq write internal
587 MB/s (18%)
Model CPU GPU RAM Value Vivo V40 SE 5G unknown unknown 3.0.4061 8 GB 587
PCMark for Android - PCM f. Android Storage 2.0 random read internal
18.7 MB/s (23%)
Model CPU GPU RAM Value Vivo V40 SE 5G unknown unknown 3.0.4061 8 GB 18.7
PCMark for Android - PCM f. Android Storage 2.0 seq read internal
712 MB/s (20%)
Model CPU GPU RAM Value Vivo V40 SE 5G unknown unknown 3.0.4061 8 GB 712
PCMark for Android - PCM f. Android Storage 2.0 score
21410 Points (34%)
Model CPU GPU RAM Value Vivo V40 SE 5G unknown unknown 3.0.4061 8 GB 21410
PCMark for Android - PCM f. Android Work Score 3.0
13575 Points (63%)
Model CPU GPU RAM Value Huawei Pura 70 Ultra unknown unknown 16 GB 13575
CrossMark - CrossMark Overall
min: 598 avg: 815 median: 814.5 (31%) max: 1031 Points
Model CPU GPU RAM Value Vivo V40 SE 5G unknown unknown 8 GB 598 Huawei Pura 70 Ultra unknown unknown 16 GB 1031
Average Benchmarks Qualcomm Snapdragon 400 MSM8928 → 0% n= Average Benchmarks Apple S5 → 0% n= Average Benchmarks unknown → 0% n=
- Range of benchmark values for this graphics card
- Average benchmark values for this graphics card
* Smaller numbers mean a higher performance
1 This benchmark is not used for the average calculation
v1.27
log 17. 16:13:59
#0 checking url part for id 6034 +0s ... 0s
#1 checking url part for id 11530 +0s ... 0s
#2 checking url part for id 1859 +0s ... 0s
#3 not redirecting to Ajax server +0s ... 0s
#4 did not recreate cache, as it is less than 5 days old! Created at Sun, 16 Jun 2024 05:37:17 +0200 +0.001s ... 0.001s
#5 composed specs +0.084s ... 0.085s
#6 did output specs +0s ... 0.085s
#7 getting avg benchmarks for device 6034 +0.003s ... 0.088s
#8 got single benchmarks 6034 +0.014s ... 0.102s
#9 getting avg benchmarks for device 11530 +0.003s ... 0.105s
#10 got single benchmarks 11530 +0.006s ... 0.111s
#11 getting avg benchmarks for device 1859 +0.003s ... 0.114s
#12 got single benchmarks 1859 +0.409s ... 0.523s
#13 got avg benchmarks for devices +0s ... 0.523s
#14 No cached benchmark found, getting uncached values +0.045s ... 0.568s
#15 No cached benchmark found, getting uncached values +0.018s ... 0.586s
#16 No cached benchmark found, getting uncached values +0.002s ... 0.588s
#17 No cached benchmark found, getting uncached values +0.035s ... 0.623s
#18 No cached benchmark found, getting uncached values +0.002s ... 0.625s
#19 No cached benchmark found, getting uncached values +0.012s ... 0.637s
#20 No cached benchmark found, getting uncached values +0.008s ... 0.645s
#21 min, max, avg, median took s +0.014s ... 0.659s
#22 return log +0s ... 0.659s
Please share our article, every link counts!
Redaktion, 2017-09- 8 (Update: 2023-07- 1)
 Deutsch
 English
 Español
 Français
 Italiano
 Nederlands
 Polski
 Português
 Русский
 Türkçe
 Svenska
 Chinese
 Magyar