Notebookcheck Logo

Qualcomm Snapdragon 400 APQ8026 vs Apple S5 vs HiSilicon k3v2 Hi3620

Qualcomm Snapdragon 400 APQ8026

► remove from comparison Qualcomm 400 APQ8026

The Qualcomm Snapdragon 400 APQ8026 is an entry-level ARM-SoC for Android smartphones and smartwatches. It integrates four Cortex-A7 cores at up to 1.2 GHz (Quad-Core) and a Adreno 305 graphics card at 450 MHz. Furthermore, Bluetooth 4.0 is integrated in the SoC.

Apple S5

► remove from comparison Apple S5

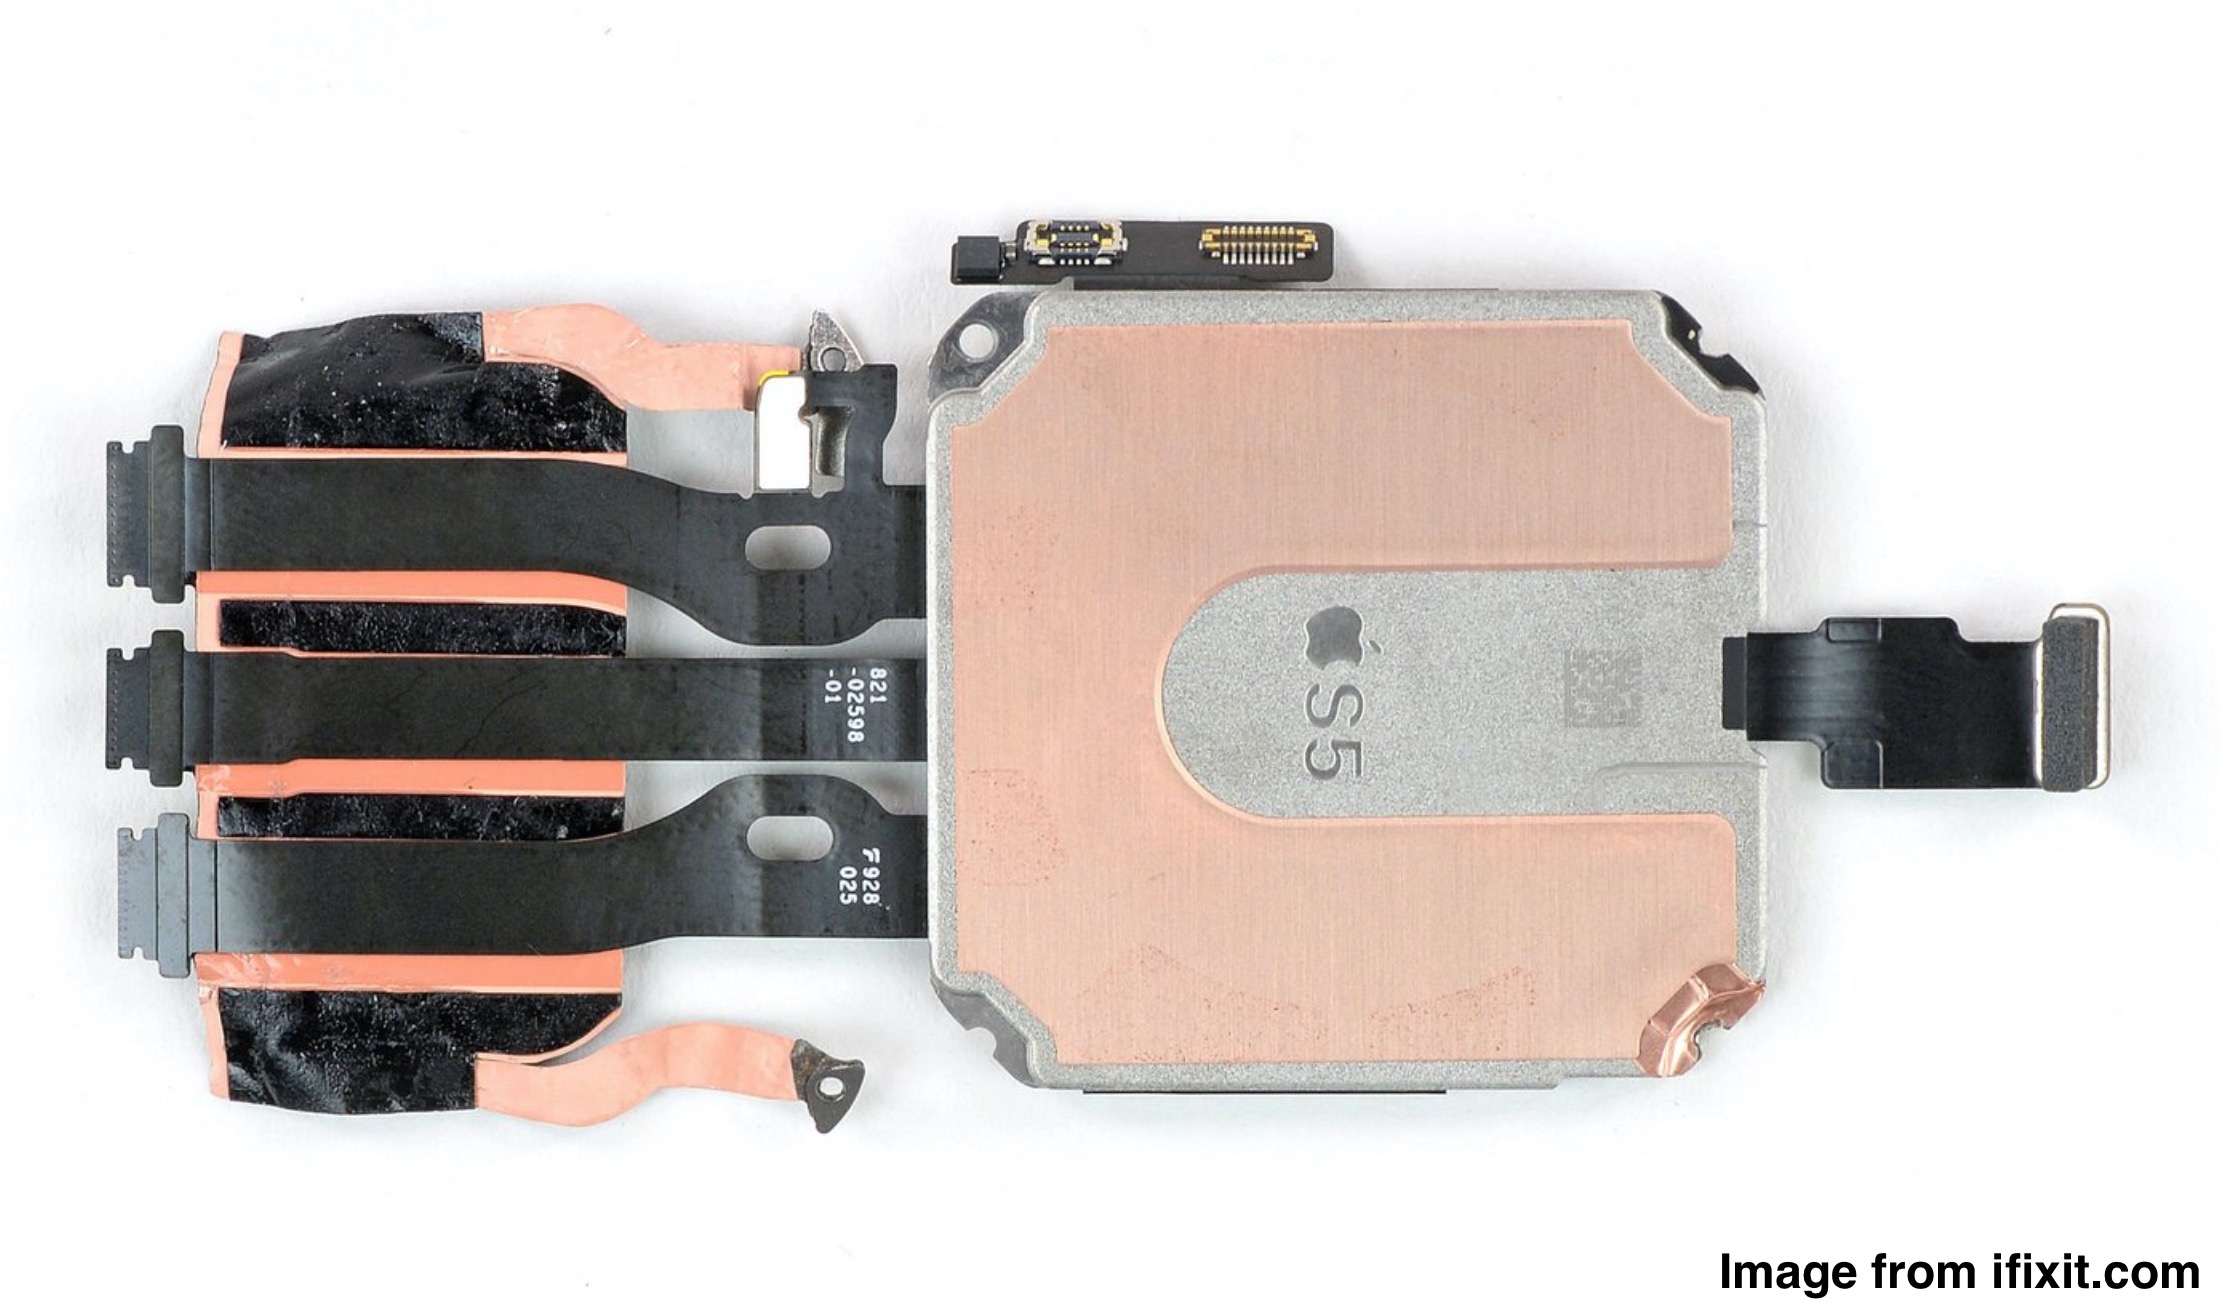
The Apple S5 is a 64-Bit dual core processor for the Apple Watch Series 5 (40 and 44mm). It integrates a GPU, 32 GB flash memory, Bluetooth 5.0, 1 GB RAM, 802.11 b/g/n 2.4 GHz WiFi and satellite positioning (GPS, GLONASS, Galileo, QZSS).

HiSilicon k3v2 Hi3620

► remove from comparison

Coretex A9 Quad-Core - max 1.5 GHz, im Huawei Mediapad 10 FHD mit 1.2 GHz

ModelQualcomm Snapdragon 400 APQ8026Apple S5HiSilicon k3v2 Hi3620
SeriesQualcomm SnapdragonApple
CodenameARMv7
Series:
Qualcomm Snapdragon S4 Pro APQ8064A1.5 GHz4 / 4 cores ARMv7
Qualcomm Snapdragon 400 MSM89281.6 GHz4 / 4 cores ARMv7
Qualcomm Snapdragon 400 APQ80281.6 GHz4 / 4 cores ARMv7
Qualcomm Snapdragon S4 Pro MSM8960T1.7 GHz2 / 2 cores ARMv7
Qualcomm Snapdragon 400 8930AB1.7 GHz2 / 2 cores ARMv7
Qualcomm Snapdragon S4 Plus APQ8060A1.5 GHz2 / 2 cores ARMv7
Qualcomm Snapdragon S4 Plus MSM89601.5 GHz2 / 2 cores ARMv7
Qualcomm Snapdragon S4 Plus MSM8260A1.7 GHz2 / 2 cores ARMv7
Qualcomm Snapdragon 400 MSM89261.2 GHz4 / 4 cores ARMv7
Qualcomm Snapdragon 400 MSM82261.2 GHz4 / 4 cores ARMv7
Qualcomm Snapdragon 400 APQ8026 « 1.2 GHz4 / 4 cores ARMv7
Qualcomm Snapdragon S4 Plus MSM89301.2 GHz2 / 2 cores ARMv7
Qualcomm Snapdragon S4 Plus MSM82301.2 GHz2 / 2 cores ARMv7
Qualcomm Snapdragon S4 Plus MSM82271 GHz2 / 2 cores ARMv7
Qualcomm Snapdragon S3 MSM86601.7 GHz2 / 2 cores ARMv7
Qualcomm Snapdragon S3 MSM82601.5 GHz2 / 2 cores ARMv7
Qualcomm Snapdragon S1 QSD82501 GHz1 / 1 cores ARMv7
HiSilicon Kirin 9000W1.53 - 2.49 GHz12 / 12 cores
UNISOC Tiger T3101.8 - 2 GHz4 / 4 cores
Rockchip RK32881.8 GHz4 / 4 cores
Apple A6x1.4 GHzcores
Apple A61 GHzcores
Apple S5 « 2 / 2 cores
HiSilicon k3v2 Hi36201.2 GHz4 / 4 cores
Rockchip RK3066 1.5 GHz1.5 GHz2 / 2 cores
Amlogic AML8726-MX1.5 GHz2 / 2 cores
Rockchip RK31681.2 GHz2 / 2 cores
Rockchip RK2918 1.2 GHz1.2 GHz1 / 1 cores
ARM Cortex A8 1.2 GHz1.2 GHz1 / 1 cores
Telechips TCC8803 1GHz1 GHz1 / 1 cores
Loongson 2F 900MHz0.9 GHz1 / 1 cores
CSR86700.08 GHzcores
ARM Cortex-M4 cores
HiSilicon Hi6262 cores
DK3.5+STcores
unknown cores
HiSilicon Kirin 9000W1.53 - 2.49 GHz12 / 12 cores
UNISOC Tiger T3101.8 - 2 GHz4 / 4 cores
Rockchip RK32881.8 GHz4 / 4 cores
Apple A6x1.4 GHzcores
Apple A61 GHzcores
Apple S52 / 2 cores
HiSilicon k3v2 Hi3620 « 1.2 GHz4 / 4 cores
Rockchip RK3066 1.5 GHz1.5 GHz2 / 2 cores
Amlogic AML8726-MX1.5 GHz2 / 2 cores
Rockchip RK31681.2 GHz2 / 2 cores
Rockchip RK2918 1.2 GHz1.2 GHz1 / 1 cores
ARM Cortex A8 1.2 GHz1.2 GHz1 / 1 cores
Telechips TCC8803 1GHz1 GHz1 / 1 cores
Loongson 2F 900MHz0.9 GHz1 / 1 cores
CSR86700.08 GHzcores
ARM Cortex-M4 cores
HiSilicon Hi6262 cores
DK3.5+STcores
unknown cores
Clock1200 MHz1200 MHz
Cores / Threads4 / 42 / 24 / 4
Technology28 nm40 nm
FeaturesBluetooth 4.0ARMv7
iGPUQualcomm Adreno 305 (450 MHz)
ArchitectureARMARM
Announced
Manufacturerwww.qualcomm.com

Benchmarks

3DMark - 3DMark Ice Storm Physics
6749 Points (5%)
min: 3209     avg: 4477     median: 4894 (4%)     max: 5167 Points
3DMark - 3DMark Ice Storm Extreme Physics
6667 Points (5%)
min: 5354     avg: 5357     median: 5357 (4%)     max: 5360 Points
3DMark - 3DMark Ice Storm Unlimited Physics
7226 Points (6%)
Geekbench 3 - Geekbench 3 32 Bit Multi-Core
1075 Points (2%)
1094 Points (2%)
Geekbench 3 - Geekbench 3 32 Bit Single-Core
327 Points (6%)
327 Points (6%)
Geekbench 2 - 32 Bit - Geekbench Stream
272 Points (2%)
min: 439     avg: 489.9     median: 500 (4%)     max: 547 Points
Geekbench 2 - 32 Bit - Geekbench Memory
1192 Points (11%)
min: 940     avg: 1187     median: 1218 (11%)     max: 1290 Points
Geekbench 2 - 32 Bit - Geekbench Floating Point
1803 Points (4%)
min: 1793     avg: 2360     median: 2351 (5%)     max: 2731 Points
Geekbench 2 - 32 Bit - Geekbench Integer
1093 Points (2%)
min: 1000     avg: 1317     median: 1275 (3%)     max: 1591 Points
Geekbench 2 - 32 Bit - Geekbench Total Score
1279 Points (3%)
min: 1209     avg: 1573     median: 1557 (4%)     max: 1819 Points
Linpack Android / IOS - Linpack Multi Thread
242.3 MFLOPS (8%)
min: 92.3     avg: 133.3     median: 138.1 (5%)     max: 151.8 MFLOPS
Linpack Android / IOS - Linpack Single Thread
85.2 MFLOPS (8%)
min: 37.8     avg: 44.2     median: 46.6 (5%)     max: 48.71 MFLOPS
Mozilla Kraken 1.1 - Kraken 1.1 Total Score *
16134 ms (19%)
26477 ms (31%)
Sunspider - Sunspider 1.0 Total Score *
1137 ms (12%)
89%
S5 +
min: 2014     avg: 2022     median: 2022 (22%)     max: 2030 ms
min: 856     avg: 2197     median: 1610 (18%)     max: 4026 ms
Sunspider - Sunspider 0.9.1 Total Score *
1157 ms (11%)
min: 1522     avg: 1643     median: 1540 (15%)     max: 2080 ms
Octane V2 - Octane V2 Total Score
1810 Points (2%)
Vellamo 3.x - Vellamo 3.x Metal
755 Points (20%)
Vellamo 3.x - Vellamo 3.x Multicore Beta
1152 Points (26%)
Vellamo 3.x - Vellamo 3.x Browser
1546 Points (20%)
Quadrant Standard Edition 2.0 - Quadrant Standard 2.0 Total Score
8236 points (19%)
min: 4404     avg: 4736     median: 4736 (11%)     max: 5068 points
AnTuTu v3 - AnTuTu v3 CPU
min: 4820     avg: 5667     median: 5662 (37%)     max: 6713 Points
AnTuTu v4 - AnTuTu v4 Total Score
17735 Points (41%)
14434 Points (34%)
AnTuTu v5 - AnTuTu v5 Total Score
17247 Points (17%)
AndEBench - AndEBench Java
308 Iter./s (9%)
min: 92     avg: 191     median: 191 (6%)     max: 290 Iter./s
AndEBench - AndEBench Native
6098 Iter./s (20%)
min: 8740     avg: 8897     median: 8897 (29%)     max: 9054 Iter./s
PassMark PerformanceTest Mobile V1 - PerformanceTest Mobile V1 CPU Tests
6717 Points (1%)
min: 8223     avg: 8737     median: 8678 (1%)     max: 9118 Points

Average Benchmarks Qualcomm Snapdragon 400 APQ8026 → 100% n=1

Average Benchmarks Apple S5 → 89% n=1

Average Benchmarks HiSilicon k3v2 Hi3620 → 94% n=1

- Range of benchmark values for this graphics card
- Average benchmark values for this graphics card
* Smaller numbers mean a higher performance
1 This benchmark is not used for the average calculation

v1.26
log 18. 07:37:35

#0 checking url part for id 6436 +0s ... 0s

#1 checking url part for id 11530 +0s ... 0s

#2 checking url part for id 3613 +0s ... 0s

#3 not redirecting to Ajax server +0s ... 0s

#4 did not recreate cache, as it is less than 5 days old! Created at Fri, 17 May 2024 11:21:47 +0200 +0.001s ... 0.001s

#5 composed specs +0.099s ... 0.1s

#6 did output specs +0s ... 0.1s

#7 getting avg benchmarks for device 6436 +0.003s ... 0.103s

#8 got single benchmarks 6436 +0.013s ... 0.116s

#9 getting avg benchmarks for device 11530 +0.003s ... 0.119s

#10 got single benchmarks 11530 +0.007s ... 0.126s

#11 getting avg benchmarks for device 3613 +0.003s ... 0.129s

#12 got single benchmarks 3613 +0.018s ... 0.147s

#13 got avg benchmarks for devices +0s ... 0.147s

#14 min, max, avg, median took s +0.12s ... 0.267s

#15 return log +0s ... 0.267s

Please share our article, every link counts!
> Expert Reviews and News on Laptops, Smartphones and Tech Innovations > Benchmarks / Tech > Processor Comparison - Head 2 Head
Redaktion, 2017-09- 8 (Update: 2023-07- 1)