Notebookcheck Logo

unknown vs Marvell PXA986 vs Amlogic AML8726-MX

Marvell PXA986

► remove from comparison Marvell Technology Group PXA986

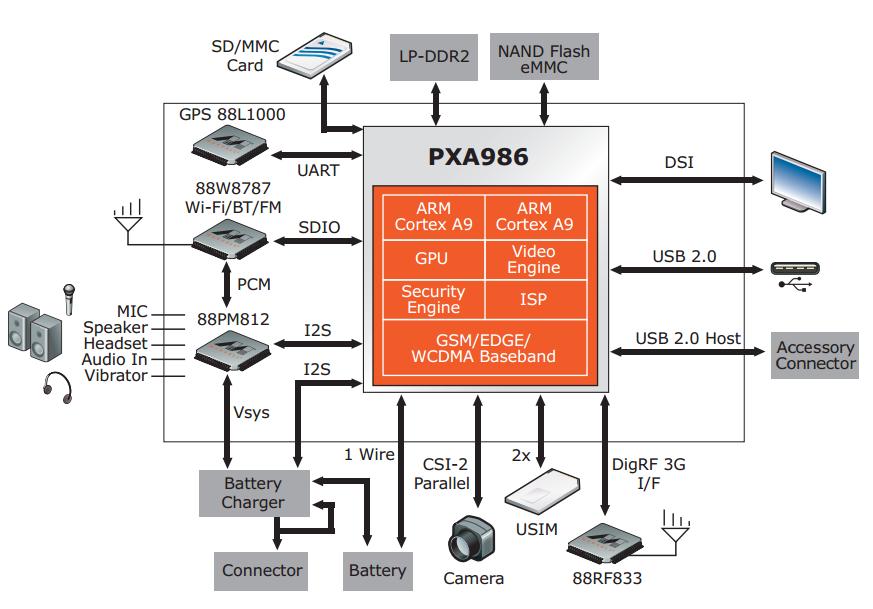
The Marvell PXA986 is an ARM based dual-core SoC for smartphones and tablets (mostly Android based). It contains two Cortex-A9 CPU cores usually clocked around 1.2 GHz and a Vivante GC1000 graphics card. The integrated video processor is able to handle 720p30 content in H.263, H.264 BP and MPEG4 SP encoding. Furthermore, a GSM/EDGE/WCDMA/HSDPA radio is included in the chip.

Amlogic AML8726-MX

► remove from comparison

The Amlogic AML8726-M is a cheap SoC (System on a Chip) for Android tablets and smartphones. It integrates two ARM Cortex-A9 cores (max. 1,5 GHz) with SIMD extensions and an ARM Mali-400 graphics card. Furthermore, the chip supports hardware decoding of 1080p videos according to Amlogic.

ModelunknownMarvell PXA986Amlogic AML8726-MX
Series Marvell Technology Group
Series:
HiSilicon Kirin 9000W1.53 - 2.49 GHz12 / 12 cores
UNISOC Tiger T3101.8 - 2 GHz4 / 4 cores
Rockchip RK32881.8 GHz4 / 4 cores
Apple A6x1.4 GHzcores
Apple A61 GHzcores
Apple S52 / 2 cores
HiSilicon k3v2 Hi36201.2 GHz4 / 4 cores
Rockchip RK3066 1.5 GHz1.5 GHz2 / 2 cores
Amlogic AML8726-MX1.5 GHz2 / 2 cores
Rockchip RK31681.2 GHz2 / 2 cores
Rockchip RK2918 1.2 GHz1.2 GHz1 / 1 cores
ARM Cortex A8 1.2 GHz1.2 GHz1 / 1 cores
Telechips TCC8803 1GHz1 GHz1 / 1 cores
Loongson 2F 900MHz0.9 GHz1 / 1 cores
CSR86700.08 GHzcores
ARM Cortex-M4 cores
HiSilicon Hi6262 cores
DK3.5+STcores
unknown «  cores
HiSilicon Kirin 910T1.8 GHz4 / 4 cores Cortex-A9
Rockchip RK31881.8 GHz4 / 4 cores Cortex-A9
HiSilicon Kirin 9101.6 GHz4 / 4 cores Cortex-A9
Renesas MP52321.5 GHz2 / 2 cores Cortex-A9
Broadcom BCM21664T1.2 GHz2 / 2 cores Cortex-A9
Marvell PXA986 « 1.2 GHz2 / 2 cores Cortex-A9
NXP i.MX 6SLL1 GHz1 / 1 cores Cortex-A9
WonderMedia PRIZM WM89501 GHz1 / 1 cores Cortex-A9
HiSilicon Kirin 9000W1.53 - 2.49 GHz12 / 12 cores
UNISOC Tiger T3101.8 - 2 GHz4 / 4 cores
Rockchip RK32881.8 GHz4 / 4 cores
Apple A6x1.4 GHzcores
Apple A61 GHzcores
Apple S52 / 2 cores
HiSilicon k3v2 Hi36201.2 GHz4 / 4 cores
Rockchip RK3066 1.5 GHz1.5 GHz2 / 2 cores
Amlogic AML8726-MX « 1.5 GHz2 / 2 cores
Rockchip RK31681.2 GHz2 / 2 cores
Rockchip RK2918 1.2 GHz1.2 GHz1 / 1 cores
ARM Cortex A8 1.2 GHz1.2 GHz1 / 1 cores
Telechips TCC8803 1GHz1 GHz1 / 1 cores
Loongson 2F 900MHz0.9 GHz1 / 1 cores
CSR86700.08 GHzcores
ARM Cortex-M4 cores
HiSilicon Hi6262 cores
DK3.5+STcores
unknown cores
Architecturex86ARMARM
CodenameCortex-A9
Clock1200 MHz1500 MHz
Cores / Threads2 / 22 / 2
Technology45 nm45 nm
Announced
Manufacturerwww.marvell.comwww.amlogic.com
L2 Cache512 KB
FeaturesNEON, VFP, Cortex-A9

Benchmarks

Cinebench R15 - Cinebench R15 CPU Multi 64 Bit
100%
1 unknown +
min: 1029     avg: 1038     median: 1038 (7%)     max: 1047 Points
3DMark - 3DMark Ice Storm Physics
100%
1 PXA986 +
min: 2623     avg: 2874     median: 2740 (2%)     max: 3258 Points
3DMark - 3DMark Ice Storm Extreme Physics
100%
1 PXA986 +
min: 2709     avg: 2985     median: 2985 (2%)     max: 3261 Points
3DMark - 3DMark Ice Storm Unlimited Physics
100%
1 unknown +
37732 Points (32%)
10%
1 PXA986 +
3675 Points (3%)
3DMark - 3DMark Cloud Gate Physics
100%
1 unknown +
8923 Points (23%)
3DMark - 3DMark Time Spy CPU
100%
1 unknown +
5039 Points (21%)
Geekbench 3 - Geekbench 3 32 Bit Multi-Core
100%
1 PXA986 +
min: 631     avg: 647     median: 646.5 (1%)     max: 662 Points
Geekbench 3 - Geekbench 3 32 Bit Single-Core
100%
1 PXA986 +
min: 376     avg: 379.5     median: 379.5 (7%)     max: 383 Points
Geekbench 2 - 32 Bit - Geekbench Stream
100%
1 PXA986 +
min: 437     avg: 439.5     median: 439.5 (4%)     max: 442 Points
min: 267     avg: 268.5     median: 268.5 (2%)     max: 270 Points
Geekbench 2 - 32 Bit - Geekbench Memory
100%
1 PXA986 +
min: 1337     avg: 1448     median: 1448 (13%)     max: 1559 Points
min: 958     avg: 963     median: 963 (9%)     max: 968 Points
Geekbench 2 - 32 Bit - Geekbench Floating Point
100%
1 PXA986 +
min: 1275     avg: 1284     median: 1284 (3%)     max: 1293 Points
min: 1409     avg: 1451     median: 1450.5 (3%)     max: 1492 Points
Geekbench 2 - 32 Bit - Geekbench Integer
100%
1 PXA986 +
min: 709     avg: 720     median: 720 (1%)     max: 731 Points
min: 825     avg: 840     median: 839.5 (2%)     max: 854 Points
Geekbench 2 - 32 Bit - Geekbench Total Score
100%
1 PXA986 +
min: 1005     avg: 1035     median: 1034.5 (3%)     max: 1064 Points
min: 1000     avg: 1021     median: 1020.5 (3%)     max: 1041 Points
Linpack Android / IOS - Linpack Multi Thread
13 MFLOPS (0%)
min: 73.7     avg: 74.3     median: 74 (3%)     max: 75.3 MFLOPS
min: 63.9     avg: 86.6     median: 84.2 (3%)     max: 111.8 MFLOPS
Linpack Android / IOS - Linpack Single Thread
12.8 MFLOPS (1%)
min: 39.83     avg: 41.6     median: 41.4 (4%)     max: 43.69 MFLOPS
min: 50.7     avg: 57.9     median: 52.9 (5%)     max: 70.1 MFLOPS
Mozilla Kraken 1.1 - Kraken 1.1 Total Score *
100%
1 PXA986 +
min: 23941     avg: 25315     median: 25315 (30%)     max: 26689 ms
Sunspider - Sunspider 0.9.1 Total Score *
7004 ms (66%)
min: 1453     avg: 1531     median: 1530.5 (15%)     max: 1608 ms
min: 1243     avg: 1336     median: 1252 (12%)     max: 1513 ms
Sunspider - Sunspider 1.0 Total Score *
100%
1 PXA986 +
min: 1428     avg: 1608     median: 1624 (18%)     max: 1771 ms
Octane V2 - Octane V2 Total Score
100%
1 unknown +
2672 Points (2%)
54%
1 PXA986 +
1448 Points (1%)
Quadrant Standard Edition 2.0 - Quadrant Standard 2.0 Total Score
100%
1 PXA986 +
min: 3257     avg: 3515     median: 3514.5 (8%)     max: 3772 points
min: 3947     avg: 4055     median: 4055 (9%)     max: 4163 points
AnTuTu v3 - AnTuTu v3 CPU
100%
1 PXA986 +
2945 Points (19%)
min: 4082     avg: 4886     median: 4886 (32%)     max: 5690 Points
AnTuTu v4 - AnTuTu v4 Total Score
100%
1 PXA986 +
min: 11051     avg: 11392     median: 11392 (26%)     max: 11733 Points
AndEBench - AndEBench Java
100%
1 PXA986 +
min: 137     avg: 160     median: 159 (5%)     max: 184 Iter./s
AndEBench - AndEBench Native
100%
1 PXA986 +
min: 4077     avg: 4208     median: 4266 (14%)     max: 4281 Iter./s
PassMark PerformanceTest Mobile V1 - PerformanceTest Mobile V1 CPU Tests
100%
1 PXA986 +
min: 3273     avg: 3820     median: 3976 (1%)     max: 4210 Points

Average Benchmarks unknown → 100% n=3

Average Benchmarks Marvell PXA986 → 383% n=3

Average Benchmarks Amlogic AML8726-MX → 442% n=3

- Range of benchmark values for this graphics card
- Average benchmark values for this graphics card
* Smaller numbers mean a higher performance
1 This benchmark is not used for the average calculation

v1.26
log 28. 05:48:53

#0 checking url part for id 1859 +0s ... 0s

#1 checking url part for id 4461 +0s ... 0s

#2 checking url part for id 3611 +0s ... 0s

#3 not redirecting to Ajax server +0s ... 0s

#4 did not recreate cache, as it is less than 5 days old! Created at Sun, 28 Apr 2024 05:39:51 +0200 +0.001s ... 0.001s

#5 composed specs +0.136s ... 0.137s

#6 did output specs +0s ... 0.137s

#7 getting avg benchmarks for device 1859 +0.003s ... 0.14s

#8 got single benchmarks 1859 +0.56s ... 0.7s

#9 getting avg benchmarks for device 4461 +0.003s ... 0.703s

#10 got single benchmarks 4461 +0.013s ... 0.715s

#11 getting avg benchmarks for device 3611 +0.003s ... 0.719s

#12 got single benchmarks 3611 +0.014s ... 0.732s

#13 got avg benchmarks for devices +0s ... 0.732s

#14 min, max, avg, median took s +0.14s ... 0.872s

#15 return log +0s ... 0.872s

Please share our article, every link counts!
> Expert Reviews and News on Laptops, Smartphones and Tech Innovations > Benchmarks / Tech > Processor Comparison - Head 2 Head
Redaktion, 2017-09- 8 (Update: 2023-07- 1)