 Deutsch
 English
 Español
 Français
 Italiano
 Nederlands
 Polski
 Português
 Русский
 Türkçe
 Svenska
 Chinese
 Magyar
Laptop, Smartphone, and Tablet Comparison
On this page you are able to compare test data and specifications from our reviews. Select a model using our search, the search box below or the compare link in our reviews (below the specs).
Asus VivoBook 15X OLED M3504YAAsus VivoBook 15X OLED M3504 Laptop Review: Capable daily driver with AMD Ryzen Barcelo-R and OLED by Vaidyanathan Subramaniam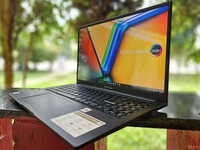 | ||||||||||||||||||||||||||
#297 AMD Ryzen 5 7530U #441 AMD Radeon RX Vega 7 16384 MB 512 GB SSD 15.60-inch 1920x1080 1700 g 359.7 x 232 x 17.9 50 Wh 750 Euro | ||||||||||||||||||||||||||
SpecificationsAsus VivoBook 15X OLED M3504YA Processor AMD Ryzen 5 7530U 6 x 2 - 4.5 GHz, 42 W PL2 / Short Burst, 37.5 W PL1 / Sustained, Barcelo-U Refresh Graphics adapter AMD Radeon RX Vega 7, AMD Adrenalin 22.20.44.37-230215a-388528C-Asus Memory 16 GB , 8 GB Soldered + 8 GB SO-DIMM DDR4-3200 Timings: 22-22-22-52 Display 15.60 inch 16:9, 1920 x 1080 pixel 141 PPI, Samsung ATNA56YX03-0, OLED, VESA-Certified Display HDR True Black 600, glossy: yes, HDR, 60 Hz Mainboard AMD Promontory/Bixby FCH Storage Micron 2400 MTFDKBA512QFM, 512 GB , 428 GB free Soundcard AMD Zen - Audio Processor - HD Audio Controller Connections 1 USB 2.0, 3 USB 3.0 / 3.1 Gen1, USB-C Power Delivery (PD), 1 HDMI, Audio Connections: 3.5 mm Combo Audio Jack, 1 Fingerprint Reader Networking MediaTek Wi-Fi 6E MT7902 (a/b/g/n = Wi-Fi 4/ac = Wi-Fi 5/ax = Wi-Fi 6/ Wi-Fi 6E 6 GHz), Bluetooth 5.3 Size height x width x depth (in mm): 17.9 x 359.7 x 232 ( = 0.7 x 14.16 x 9.13 in) Battery 50 Wh Lithium-Ion, 3S1P, 3-cell Charging fast charging / Quickcharge Operating System Microsoft Windows 11 Home Camera Webcam: 720p HD 3DNR, Privacy Shutter Primary Camera: 0.9 MPix Additional features Speakers: Stereo Speakers, DTS Audio Processing, Keyboard: Chiclet, Keyboard Light: yes, MyAsus, 12 Months Warranty Weight 1.7 kg ( = 59.97 oz / 3.75 pounds) ( = 0 oz / 0 pounds) Price 750 EUR
| ||||||||||||||||||||||||||
Samsung ATNA56YX03-0 tested with X-Rite i1Basic Pro 3 Maximum: 389 cd/m² (Nits) Average: 381.1 cd/m² Minimum: 4.9 cd/m²Brightness Distribution: 97 % Center on Battery: 378 cd/m² Contrast: ∞:1 (Black: 0 cd/m²) ΔE Color 2.91 | 0.5-29.43 Ø5, calibrated: 2.08 ΔE Greyscale 3.1 | 0.57-98 Ø5.3 96.3% AdobeRGB 1998 (Argyll 2.2.0 3D) 99.9% sRGB (Argyll 2.2.0 3D) 99.7% Display P3 (Argyll 2.2.0 3D) Gamma: 2.14 | ||||||||||||||||||||||||||
ERROR no Specs ID specified in element or header and also no heat ID found in element
| ||||||||||||||||||||||||||
Noise Level
| ||||||||||||||||||||||||||
Power Consumption
| ||||||||||||||||||||||||||
Asus VivoBook 15X OLED M3504YA
-
06/08/2023 v7
Multimedia - Weighted Average
| ||||||||||||||||||||||||||
| ||||||||||||||||||||||||||
AS SSD Copy Game MB/s: 1232.57 MB/s | ||||||||||||||||||||||||||
AS SSD Copy Program MB/s: 601.72 MB/s | ||||||||||||||||||||||||||
AS SSD Copy ISO MB/s: 1474.69 MB/s | ||||||||||||||||||||||||||
AS SSD Score Total: 3060 Points | ||||||||||||||||||||||||||
AS SSD Score Write: 1257 Points | ||||||||||||||||||||||||||
AS SSD Score Read: 1241 Points | ||||||||||||||||||||||||||
AS SSD Access Time Write: 0.116 ms* | ||||||||||||||||||||||||||
AS SSD Access Time Read: 0.15 ms* | ||||||||||||||||||||||||||
AS SSD 4K-64 Write: 1002.8 MB/s | ||||||||||||||||||||||||||
AS SSD 4K-64 Read: 921.08 MB/s | ||||||||||||||||||||||||||
AS SSD 4K Write: 130.89 MB/s | ||||||||||||||||||||||||||
AS SSD 4K Read: 39.67 MB/s | ||||||||||||||||||||||||||
AS SSD Seq Write: 1233.15 MB/s | ||||||||||||||||||||||||||
AS SSD Seq Read: 2801.51 MB/s | ||||||||||||||||||||||||||
Cinebench R15 CPU Single 64Bit: 237 Points | ||||||||||||||||||||||||||
Cinebench R15 CPU Multi 64Bit: 1541 Points | ||||||||||||||||||||||||||
Cinebench R15 Ref. Match 64Bit: 97.9 % | ||||||||||||||||||||||||||
Cinebench R15 OpenGL 64Bit: 117.7 fps | ||||||||||||||||||||||||||
3DMark 11 Performance Combined: 3948 Points | ||||||||||||||||||||||||||
3DMark 11 Performance Physics: 12485 Points | ||||||||||||||||||||||||||
3DMark 11 Performance GPU: 5739 Points | ||||||||||||||||||||||||||
3DMark 11 Performance: 5951 Points | ||||||||||||||||||||||||||
3DMark Wild Life Extreme Unlimited: 1993 Points | ||||||||||||||||||||||||||
3DMark Wild Life Extreme: 2088 Points | ||||||||||||||||||||||||||
3DMark Wild Life Unlimited Score: 7075 Points | ||||||||||||||||||||||||||
3DMark Wild Life Score: 7025 Points | ||||||||||||||||||||||||||
3DMark Night Raid CPU Score: 10470 Points | ||||||||||||||||||||||||||
3DMark Night Raid Graphics Score: 15052 Points | ||||||||||||||||||||||||||
3DMark Night Raid Score: 14124 Points | ||||||||||||||||||||||||||
3DMark Time Spy CPU: 5887 Points | ||||||||||||||||||||||||||
3DMark Time Spy Graphics: 1156 Points | ||||||||||||||||||||||||||
3DMark Time Spy Score: 1314 Points | ||||||||||||||||||||||||||
3DMark Fire Strike Ultra Combined: 355 Points | ||||||||||||||||||||||||||
3DMark Fire Strike Ultra Physics: 19004 Points | ||||||||||||||||||||||||||
3DMark Fire Strike Ultra Graphics: 689 Points | ||||||||||||||||||||||||||
3DMark Fire Strike Ultra Score: 725 Points | ||||||||||||||||||||||||||
3DMark Fire Strike Extreme Combined: 600 Points | ||||||||||||||||||||||||||
3DMark Fire Strike Extreme Physics: 20237 Points | ||||||||||||||||||||||||||
3DMark Fire Strike Extreme Graphics: 1469 Points | ||||||||||||||||||||||||||
3DMark Fire Strike Extreme Score: 1460 Points | ||||||||||||||||||||||||||
3DMark Fire Strike Combined: 1126 Points | ||||||||||||||||||||||||||
3DMark Fire Strike Physics: 19946 Points | ||||||||||||||||||||||||||
3DMark Fire Strike Graphics: 3553 Points | ||||||||||||||||||||||||||
3DMark Fire Strike Score: 3252 Points | ||||||||||||||||||||||||||
3DMark Sky Diver Physics: 15674 Points | ||||||||||||||||||||||||||
3DMark Sky Diver Graphics: 11767 Points | ||||||||||||||||||||||||||
3DMark Sky Diver Score: 12111 Points | ||||||||||||||||||||||||||
3DMark Cloud Gate Standard Physics: 12903 Points | ||||||||||||||||||||||||||
3DMark Cloud Gate Standard Graphics: 28466 Points | ||||||||||||||||||||||||||
3DMark Cloud Gate Standard Score: 22448 Points | ||||||||||||||||||||||||||
3DMark Ice Storm Unlimited Physics: 87410 Points | ||||||||||||||||||||||||||
3DMark Ice Storm Unlimited Graphics Score: 286859 Points | ||||||||||||||||||||||||||
3DMark Ice Storm Unlimited Score: 190343 Points | ||||||||||||||||||||||||||
3DMark Ice Storm Extreme Physics: 84092 Points | ||||||||||||||||||||||||||
3DMark Ice Storm Extreme Graphics: 130476 Points | ||||||||||||||||||||||||||
3DMark Ice Storm Extreme Score: 116229 Points | ||||||||||||||||||||||||||
3DMark Ice Storm Standard Physics: 81747 Points | ||||||||||||||||||||||||||
3DMark Ice Storm Standard Graphics: 214992 Points | ||||||||||||||||||||||||||
3DMark Ice Storm Standard Score: 157825 Points | ||||||||||||||||||||||||||
Mozilla Kraken 1.1 Total: 614 ms* | ||||||||||||||||||||||||||
CrystalDiskMark 5.2 / 6 Write 4K: 122.6 MB/s | ||||||||||||||||||||||||||
CrystalDiskMark 5.2 / 6 Read 4K: 39.72 MB/s | ||||||||||||||||||||||||||
CrystalDiskMark 5.2 / 6 Write Seq: 1608 MB/s | ||||||||||||||||||||||||||
CrystalDiskMark 5.2 / 6 Read Seq: 1642 MB/s | ||||||||||||||||||||||||||
CrystalDiskMark 5.2 / 6 Write 4K Q32T1: 471.9 MB/s | ||||||||||||||||||||||||||
CrystalDiskMark 5.2 / 6 Read 4K Q32T1: 415.4 MB/s | ||||||||||||||||||||||||||
CrystalDiskMark 5.2 / 6 Write Seq Q32T1: 1777 MB/s | ||||||||||||||||||||||||||
CrystalDiskMark 5.2 / 6 Read Seq Q32T1: 3354 MB/s | ||||||||||||||||||||||||||
CrystalDiskMark 5.2 / 6 Write 4K Q8T8: 1755.2 MB/s | ||||||||||||||||||||||||||
CrystalDiskMark 5.2 / 6 Read 4K Q8T8: 1218 MB/s | ||||||||||||||||||||||||||
AIDA64 Memory Write: 36241 MB/s | ||||||||||||||||||||||||||
AIDA64 Memory Read: 40094 MB/s | ||||||||||||||||||||||||||
AIDA64 FP32 Ray-Trace: 10607 KRay/s | ||||||||||||||||||||||||||
AIDA64 FPU Julia: 67786 Points | ||||||||||||||||||||||||||
AIDA64 CPU SHA3: 2305 MB/s | ||||||||||||||||||||||||||
AIDA64 CPU Queen: 76198 Points | ||||||||||||||||||||||||||
AIDA64 FPU SinJulia: 9248 Points | ||||||||||||||||||||||||||
AIDA64 FPU Mandel: 37325 Points | ||||||||||||||||||||||||||
AIDA64 CPU AES: 92360 MB/s | ||||||||||||||||||||||||||
AIDA64 CPU ZLib: 597 MB/s | ||||||||||||||||||||||||||
AIDA64 FP64 Ray-Trace: 5452 KRay/s | ||||||||||||||||||||||||||
AIDA64 CPU PhotoWorxx: 15444 MPixel/s | ||||||||||||||||||||||||||
AIDA64 Memory Latency: 94.4 ns* | ||||||||||||||||||||||||||
AIDA64 Memory Copy: 34720 MB/s | ||||||||||||||||||||||||||
WebXPRT 3 Overall: 268 Points | ||||||||||||||||||||||||||
Basemark GPU 1.2 Vulkan Medium Offscreen : 104.6 fps | ||||||||||||||||||||||||||
DiskSpd 4k q1 t1 write: 121.2 MB/s | ||||||||||||||||||||||||||
DiskSpd 4k q1 t1 read: 31.8 MB/s | ||||||||||||||||||||||||||
DiskSpd 4k q32 t16 write: 449 MB/s | ||||||||||||||||||||||||||
DiskSpd 4k q32 t16 read: 1034 MB/s | ||||||||||||||||||||||||||
DiskSpd seq write: 1628 MB/s | ||||||||||||||||||||||||||
DiskSpd seq read: 1934 MB/s | ||||||||||||||||||||||||||
DiskSpd seq q8 t1 write: 1745 MB/s | ||||||||||||||||||||||||||
DiskSpd seq q8 t1 read: 3342 MB/s | ||||||||||||||||||||||||||
DiskSpd loop seq q8 t1 read: 3355 MB/s | ||||||||||||||||||||||||||
Cinebench R20 CPU (Single Core): 574 Points | ||||||||||||||||||||||||||
Cinebench R20 CPU (Multi Core): 3614 Points | ||||||||||||||||||||||||||
V-Ray Benchmark Next 4.10 GPU: 54 mpaths | ||||||||||||||||||||||||||
V-Ray Benchmark Next 4.10 CPU: 9292 ksamples | ||||||||||||||||||||||||||
Geekbench 5.5 OpenCL Score: 14978 | ||||||||||||||||||||||||||
Geekbench 5.5 Vulkan Score: 17342 | ||||||||||||||||||||||||||
Geekbench 5.5 Multi-Core: 6390 | ||||||||||||||||||||||||||
Geekbench 5.5 Single-Core: 1498 | ||||||||||||||||||||||||||
DPC Latencies / LatencyMon interrupt to process latency (max), Web, Youtube, Prime95: 658.1 μs* | ||||||||||||||||||||||||||
Cinebench R23 Single Core: 1470 Points | ||||||||||||||||||||||||||
Cinebench R23 Multi Core: 9233 Points | ||||||||||||||||||||||||||
CrossMark Responsiveness: 1096 Points | ||||||||||||||||||||||||||
CrossMark Creativity: 1390 Points | ||||||||||||||||||||||||||
CrossMark Productivity: 1370 Points | ||||||||||||||||||||||||||
CrossMark Overall: 1336 Points | ||||||||||||||||||||||||||
WebXPRT 4 Overall: 214 Points | ||||||||||||||||||||||||||
GPUScore: Sacred Path Official: 14.3 fps | ||||||||||||||||||||||||||
Geekbench 6.0 GPU Vulkan: 14571 | ||||||||||||||||||||||||||
Geekbench 6.0 GPU OpenCL: 15229 | ||||||||||||||||||||||||||
Geekbench 6.0 Multi-Core: 6580 | ||||||||||||||||||||||||||
Geekbench 6.0 Single-Core: 1887 | ||||||||||||||||||||||||||
LibreOffice 20 Documents To PDF: 53.5 s* | ||||||||||||||||||||||||||
PCMark 8 Work Score Accelerated v2: 5791 Points | ||||||||||||||||||||||||||
PCMark 8 Home Score Accelerated v2: 4946 Points | ||||||||||||||||||||||||||
PCMark 10 Digital Content Creation: 6061 Points | ||||||||||||||||||||||||||
PCMark 10 Productivity: 9967 Points | ||||||||||||||||||||||||||
PCMark 10 Essentials: 10754 Points | ||||||||||||||||||||||||||
PCMark 10 Score: 6209 Points | ||||||||||||||||||||||||||
Blender v3.3 Classroom HIP/AMD: 683 Seconds* | ||||||||||||||||||||||||||
Blender v3.3 Classroom CPU: 618 Seconds* | ||||||||||||||||||||||||||
Blender v2.79 BMW27 CPU: 348 Seconds* | ||||||||||||||||||||||||||
7-Zip 18.03 7z b 4: 40888 MIPS | ||||||||||||||||||||||||||
7-Zip 18.03 7z b 4 -mmt1: 5544 MIPS | ||||||||||||||||||||||||||
HWBOT x265 Benchmark v2.2 4k Preset: 10.8 fps | ||||||||||||||||||||||||||
R Benchmark 2.5 Overall mean: 0.515 sec* | ||||||||||||||||||||||||||
Youtube 2160p60 CPU Load: 15 % | ||||||||||||||||||||||||||
GTA V Highest Settings possible: 11.2 fps | ||||||||||||||||||||||||||
GTA V High/On (Advanced Graphics Off): 26 fps | ||||||||||||||||||||||||||
GTA V Normal/Off: 65.9 fps | ||||||||||||||||||||||||||
GTA V Normal/Off: 95.3 fps | ||||||||||||||||||||||||||
GTA V Lowest Settings possible: 64.1 fps | ||||||||||||||||||||||||||
GTA V Lowest Settings possible: 107.7 fps | ||||||||||||||||||||||||||
Final Fantasy XV Benchmark High Quality: 12.6 fps | ||||||||||||||||||||||||||
Final Fantasy XV Benchmark Standard Quality: 17.7 fps | ||||||||||||||||||||||||||
Final Fantasy XV Benchmark Lite Quality: 35.2 fps | ||||||||||||||||||||||||||
X-Plane 11.11 high (fps_test=3): 29.1 fps | ||||||||||||||||||||||||||
X-Plane 11.11 med (fps_test=2): 32.8 fps | ||||||||||||||||||||||||||
X-Plane 11.11 low (fps_test=1): 42.6 fps | ||||||||||||||||||||||||||
Far Cry 5 Ultra Preset: 18 fps | ||||||||||||||||||||||||||
Far Cry 5 High Preset: 18 fps | ||||||||||||||||||||||||||
Far Cry 5 Medium Preset: 20 fps | ||||||||||||||||||||||||||
Far Cry 5 Low Preset: 22 fps | ||||||||||||||||||||||||||
Far Cry 5 Low Preset: 46 fps | ||||||||||||||||||||||||||
Strange Brigade ultra: 22.4 fps | ||||||||||||||||||||||||||
Strange Brigade high: 26.1 fps | ||||||||||||||||||||||||||
Strange Brigade medium: 31.2 fps | ||||||||||||||||||||||||||
Strange Brigade lowest: 81.5 fps | ||||||||||||||||||||||||||
F1 22 Ultra High Preset: 17.5 fps | ||||||||||||||||||||||||||
F1 22 High Preset: 24.2 fps | ||||||||||||||||||||||||||
F1 22 Medium Preset: 31.2 fps | ||||||||||||||||||||||||||
F1 22 Low Preset: 35 fps | ||||||||||||||||||||||||||
F1 22 Ultra Low Preset: 66.6 fps | ||||||||||||||||||||||||||
The Witcher 3 Ultra Graphics & Postprocessing (HBAO+): 13.6 fps | ||||||||||||||||||||||||||
The Witcher 3 High Graphics & Postprocessing (Nvidia HairWorks Off): 20.9 fps | ||||||||||||||||||||||||||
The Witcher 3 Medium Graphics & Postprocessing: 41.6 fps | ||||||||||||||||||||||||||
The Witcher 3 Medium Graphics & Postprocessing: 24.5 fps | ||||||||||||||||||||||||||
The Witcher 3 Low Graphics & Postprocessing: 65.9 fps | ||||||||||||||||||||||||||
Dota 2 Reborn ultra (3/3) best looking: 47.1 fps | ||||||||||||||||||||||||||
Dota 2 Reborn high (2/3): 50.7 fps | ||||||||||||||||||||||||||
Dota 2 Reborn med (1/3): 93.3 fps | ||||||||||||||||||||||||||
Dota 2 Reborn min (0/3) fastest: 116.8 fps | ||||||||||||||||||||||||||
Battery Runtime WiFi Websurfing: 597 min | ||||||||||||||||||||||||||
Battery Runtime WiFi Websurfing max. Brightness: 402 min | ||||||||||||||||||||||||||
Response Times Response Time Grey 50% / Grey 80%: 4.8 ms* | ||||||||||||||||||||||||||
Response Times Response Time Black / White: 20 ms* | ||||||||||||||||||||||||||
Response Times PWM Frequency: 60 Hz | ||||||||||||||||||||||||||
Emissions Fan Noise The Witcher 3 ultra: 47.1 dB(A) | ||||||||||||||||||||||||||
Emissions Fan Noise: 46.5 dB(A) | ||||||||||||||||||||||||||
Loudspeakers Pink Noise: 75.4 dB(A) | ||||||||||||||||||||||||||
Networking iperf3 transmit AXE11000 6GHz: 960 MBit/s | ||||||||||||||||||||||||||
Networking iperf3 receive AXE11000 6GHz: 987 MBit/s | ||||||||||||||||||||||||||
Networking iperf3 receive AXE11000: 924 MBit/s | ||||||||||||||||||||||||||
Networking iperf3 transmit AXE11000: 940 MBit/s | ||||||||||||||||||||||||||
Power Consumption Witcher 3 ultra Efficiency (external Monitor): 0.3778 fps per Watt | ||||||||||||||||||||||||||
Power Consumption Cinebench R23 Single Power Efficiency - external Monitor: 62.6 Points per Watt | ||||||||||||||||||||||||||
Power Consumption Cinebench R23 Multi Power Efficiency - external Monitor: 179.6 Points per Watt | ||||||||||||||||||||||||||
Power Consumption Cinebench R23 Single (external Monitor): 23.5 Watt* | ||||||||||||||||||||||||||
Power Consumption Cinebench R23 Multi (external Monitor): 51.4 Watt* | ||||||||||||||||||||||||||
Power Consumption Idle 1min (external Monitor): 3.43 Watt* | ||||||||||||||||||||||||||
Power Consumption Witcher 3 ultra Efficiency: 0.3542 fps per Watt | ||||||||||||||||||||||||||
Power Consumption Cinebench R15 Multi Efficiency (external Monitor): 28.8 Points per Watt | ||||||||||||||||||||||||||
Power Consumption Prime95 28.10 and Furmark 1.25: 45.4 Watt* | ||||||||||||||||||||||||||
Power Consumption 3DMark06 Return To Proxycon: 40.9 Watt* | ||||||||||||||||||||||||||
Power Consumption Witcher 3 ultra: 38.4 Watt* | ||||||||||||||||||||||||||
Power Consumption Prime95 V2810 Stress (external Monitor): 51.6 Watt* | ||||||||||||||||||||||||||
Power Consumption Cinebench R15 Multi (external Monitor): 53.6 Watt* | ||||||||||||||||||||||||||
Power Consumption Cinebench R20 Multi (external Monitor): 40.8 Watt* | ||||||||||||||||||||||||||
Power Consumption Cinebench R20 Single (external Monitor): 23.5 Watt* | ||||||||||||||||||||||||||
Power Consumption FurMark 1.19 GPU Stress Test (external Monitor): 35.5 Watt* | ||||||||||||||||||||||||||
Power Consumption The Witcher 3 ultra (external Monitor): 36 Watt* | ||||||||||||||||||||||||||
Camera Testchart perfect light: 0 | ||||||||||||||||||||||||||
Camera ColorChecker Passport perfect light DeltaE: 13.65 DeltaE* | ||||||||||||||||||||||||||
Display Display P3 Coverage: 99.7 % | ||||||||||||||||||||||||||
Display sRGB Coverage: 99.9 % | ||||||||||||||||||||||||||
Display AdobeRGB 1998 Coverage: 96.3 % | ||||||||||||||||||||||||||

Console
log 23. 02:18:15
#0 before search +0s ... 0s
#1 after search +0s ... 0s
#2 added compareJS +0s ... 0s
#3 looking up spec 337810 +0s ... 0s
#4 more than one entry found +0.002s ... 0.003s
#5 VivoBook 15X OLED M3504YA for array +0.469s ... 0.472s
#6 return log +0s ... 0.472s