Nvidia GeForce GTX 280M Review
Minimize me.
Just announced, already reviewed by Notebookcheck. In this article we present you an in depth review of the new high end mobile graphics card, the Nvidia GeForce GTX 280M and compare its performance to the AMD Mobility Radeon HD 4870.
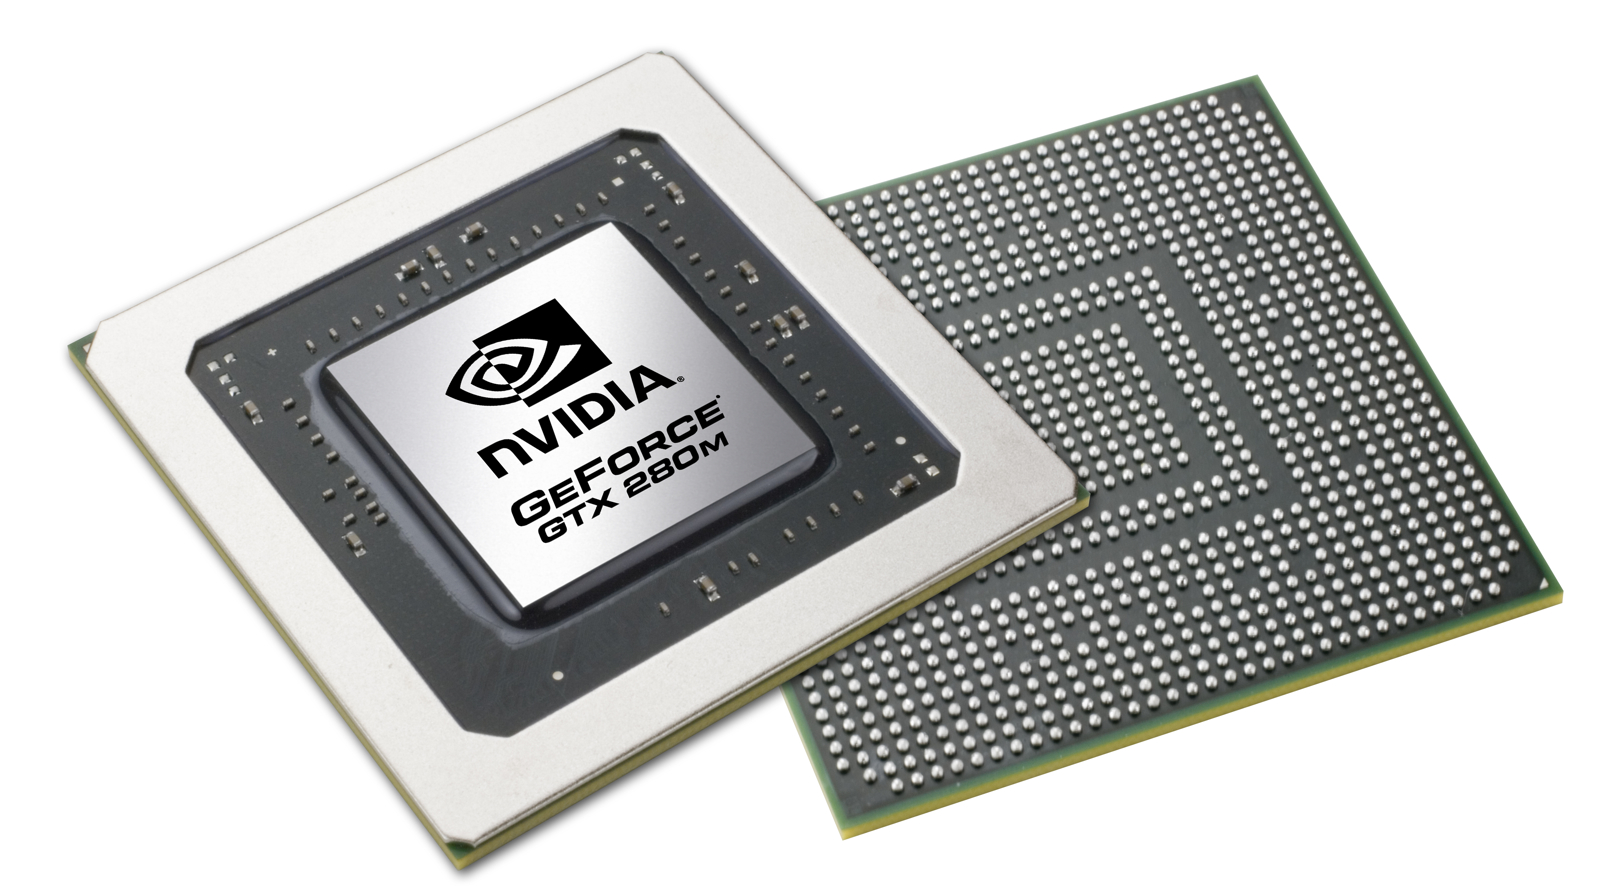
On time for the opening of the 2009 Cebit, Nvidia presents its new high-end graphics adapter for laptops. The top model of the new 100M and 200M models is the Nvidia GeForce GTX 280M. Although the name suggests it, the card does not stem from the desktop GeForce GTX 280 chip, but is based on the 55nm G92b core and therefore related to the GeForce 9800 GTX+ desktop card (GTX 250). Compared to the old 9800M GTX card, the new 280M features a higher clock rate and all 128 shader cores of the G92 architecture.
In detail the following changes can be found compared to the 9800M GTX:
- More render pipelines of the G92 are enabled (128 like the Quadro FX 3700M)
- 17 to 19% higher clock rates (585/1463/950 versus 500/1250/800 = +17%/+17%/19%) when using a MXM 3 card (MXM 2 is limited to 800 MHz memory bus)
- Refined 55nm process (instead of the 65nm process of the 9800M GTX)
- Still the same maximum thermal dissipation power (TDP) of 75 Watt
- And therefore a better performance / watt ratio
- Faster Hybrid Power Switching (below one second versus 7 seconds)
As the older cards the new 100M and 200M cards also feature the PureVideo HD engine to decode HD videos with a low CPU usage (BD Live support). Furthermore, CUDA and PhysX can be used with the GPUs too (and they are fast enough to be used with games like Mirrors Edge).
In addition to the GeForce GTX 280M, Nvidia also presented two other enthusiasm graphic cards. The GeForce GTX 260M is a 55nm version of the 9800M GTX with higher clock rates (and the same power consumption). The GeForce GTS 160M is a 55nm 9800 GTS with the power consumption of the 9800M GS (and can therefore also be fit in 15" laptops).
| GeForce GTX 280M | GeForce GTX 260M | GeForce GTS 160M | |
|---|---|---|---|
| CUDA Processor Cores | 128 | 112 | 64 |
| Core Clock (MHz) | 585 | 550 | 600 |
| Processor Clock (MHz) | 1463 | 1375 | 1500 |
| Memory Clock (MHz) | 950 | 950 | 800 |
| Memory Interface | 256 Bit | 256 Bit | 256 Bit |
| Framebuffer | 1 GB | 1 GB | 1 GB |
| Gigaflops | 562 | 462 | 288 |
For our review, we were able to use the following test platform:
- Clevo M980NU 18.4“ barebone (pre-production sample)
- Nvidia GeForce GTX 280M with 1024 GDDR 3 (585/1463/950) in an MXM 3.0 slot (pre-production sample)
- Intel Core 2 Duo X9100 3.1 GHz CPU
- 2048 MB DDR3
- 320 GB 5400 U/min HDD
- Vista 64 Bit
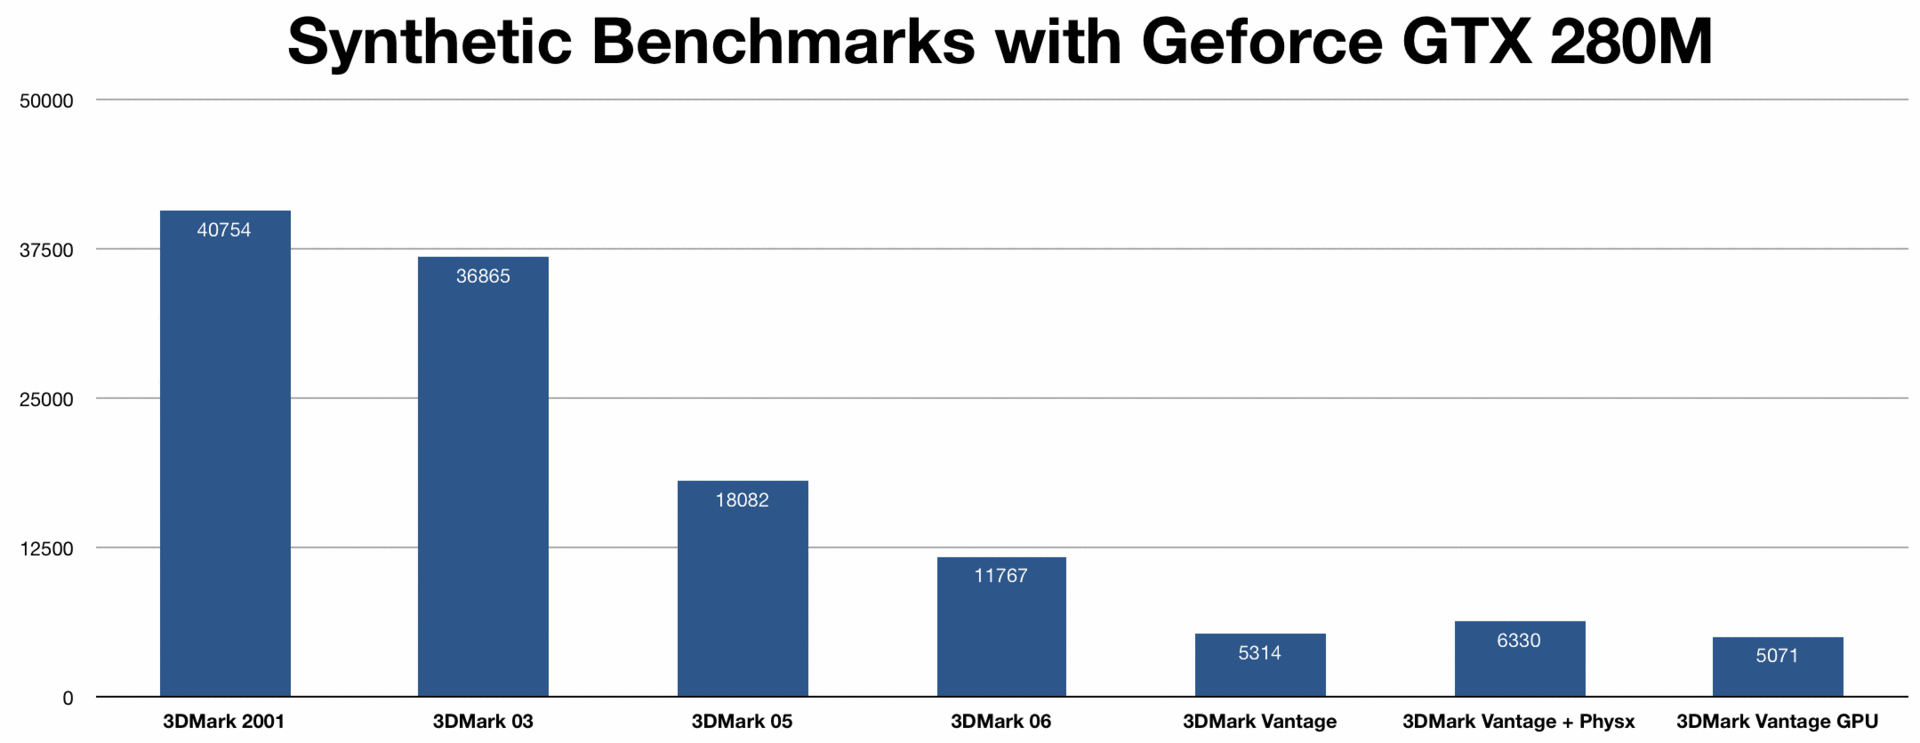
Synthetic Benchmarks
As a first step we conducted some tests with the synthetic benchmark suites from Futuremark and Cinebench. For comparison purpose we used a desktop HD 4850 graphic card and reduced its clock rate to the level of an ATI Mobility Radeon HD 4870 with GDDR3. The system hosting this card was a Core 2 Duo E6600 (2.4 GHz), 4 GB RAM and Vista 64 Bit.
The HD4870 scarcely won the comparison in the 3DMark benchmarks from Futuremark. Only in 3DMark Vantage, the GeForce GTX 280M with enabled PhysX support for the GPU clearly won the comparison. Nonetheless, this total score in Vantage is questionable, because PhysX support only affects the CPU score and increases this score from 6200 points to 25000. Without PhysX, the Vantage score clearly remains behind the simulated HD 4850.
The OpenGL test of Cinebench R10 also preferred the mobile HD 4870 over the GTX 280M. However, the Open GL performance often depends on the installed drivers (for example some mobile drivers stem from the Quadro line and are therefore performing much better).
So, in the first round of the synthetic benchmarks (which are only to some extent significant), the GeForce GTX 280M scarcely lost against the 800 shader monster from AMD.
Gaming Benchmarks
Much more interesting and more meaningful are the benchmarks of actual games. Therefore, we looked at some older and a lot of recent games and evaluated the graphic cards by running the integrated benchmarks and / or recording a real game using the FRAPS tool.


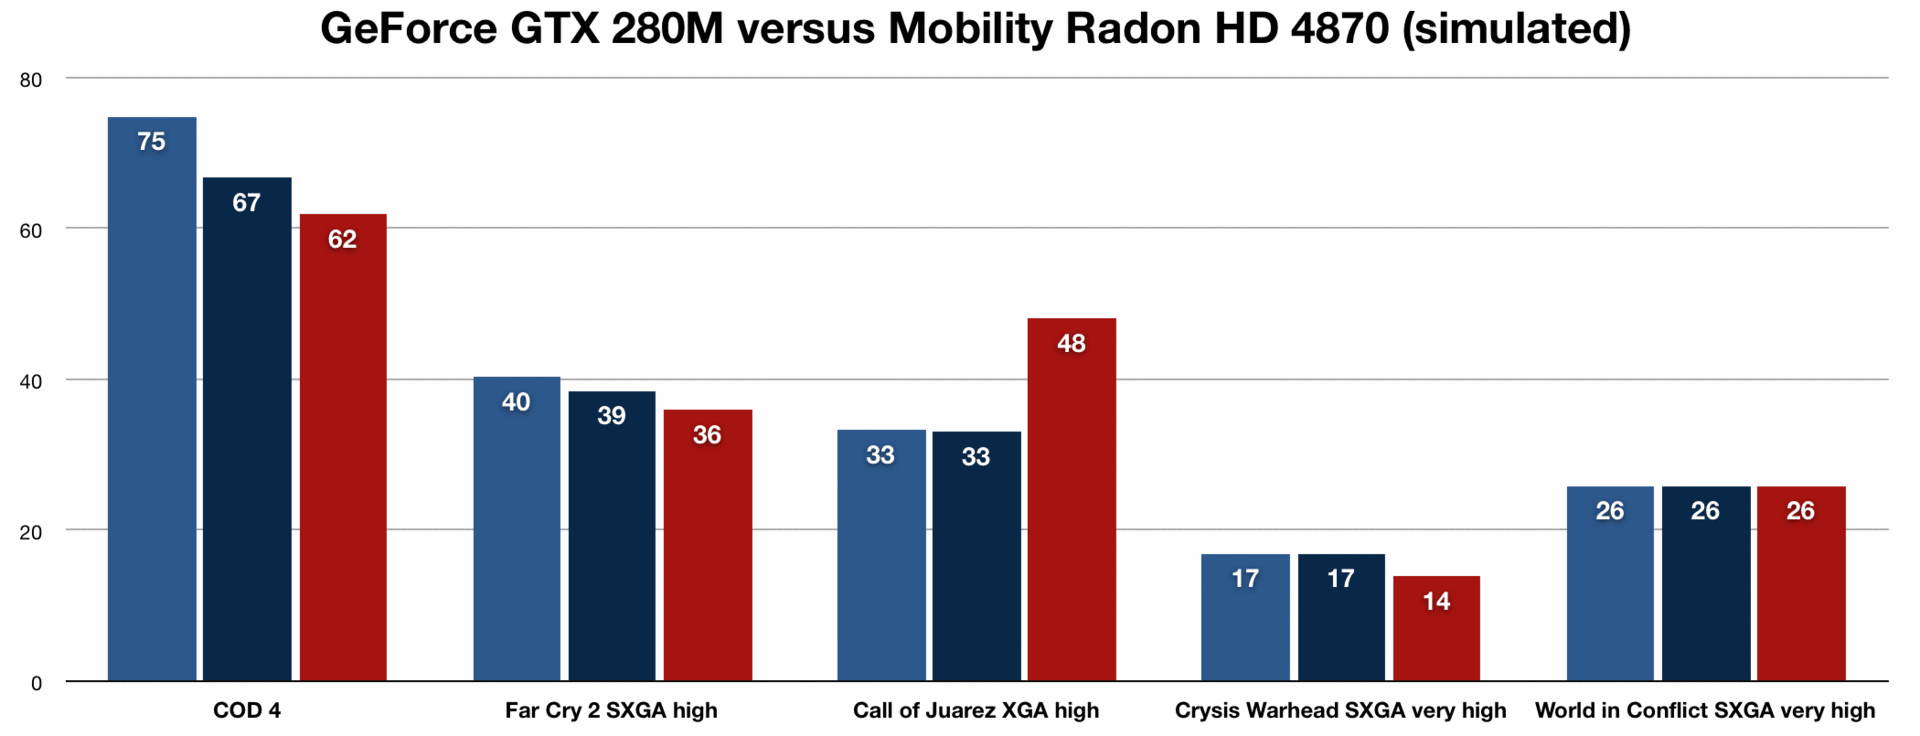
In Call of Duty 4 on 1280x1024 – high – the GTX 280M demonstrated its performance, for the very first time. With an average of 67 or rather 75 fps (2.1 to 3 GHz CPU), the nVIDIA Flagship won against the 62 fps of the simulated HD 4850 (with the 2.4 GHz CPU). – 1:0 for nVIDIA.
Next, we examined the older but graphically challenging World of Conflict with the integrated benchmark. On highest detail level and SXGA resolution, both cards achieved 21 fps at an average. – Drawn – 2:1
As a next step, we started the Call of Juarez DirectX 10 demo benchmark on XGA and high details with 4x anti aliasing. Here, AMD with 48 versus 33 fps achieved a clear victory. Still the demo benchmark is rumored to be tailored for ATI cards and does not really represent the game's performance. However - 2:2 - it remains suspenseful.
Supreme Commander – Forged Alliance is an important long term game of the strategy genre because of its extensive multi-player battles. The exigent benchmark shows scenes of a gigantic battle of 4 parties. The Mobility Radeon HD 4870 with the 2.4 GHz CPU clearly won against the GTX 280M with 3.1 GHz CPU with some frames advance. - Point for ATI 2:3
In Crysis, the GTX 280M won in lower details and resolutions. But on very high settings on SXGA, which with the game cannot be played smoothly, the HD 4870 won with a single frame advance. In total, nVIDIA can be declared as the winner of the Crysis battle (due to the clearly higher frame rates in “high”). – 3:3 drawn again.
Also the successor of Crysis, Crysis Warhead, made it in our benchmark comparison. The slightly enhanced engine of Crysis worked somewhat better with the nVIDIA graphic card. As a consequence, the GTX 280M gained one more point. – 4:3 advantage for nVIDIA.
Also Far Cry 2 has been tested with both cards. The results showed a clearly better performance of the nVIDIA high-end laptop-graphic card. – 5:3 for nVIDIA.
The benchmarks of the quite old games Half Life 2 and Doom 3 were won by AMD with some advance. Nevertheless, as both GPUs convinced with frame rates of more than 100 fps, this is less important and probably also a consequence of a lack of driver optimization (or the pre-production level of our test sample). The old 9800M GTX for example achieved considerably better values (which cannot be explained otherwise). It is also noticeable that the 280M only got 38 images per second in F.E.A.R. – 5:4 for nVIDIA.
Up to now a real ATI Mobility Radeon HD 4870 (X2) has only been tested by PC Tuning (two HD 4870 in crossfire mode in an Asus W90 laptop, but also pre-production). We tried to reproduce some of tests they mentioned on full-HD with the single GTX 280M. The purpose was to compare the performance. The other hardware equipment was comparable (W90 with a to 2.9 GHz overclocked Core 2 Duo and 6 GB RAM).
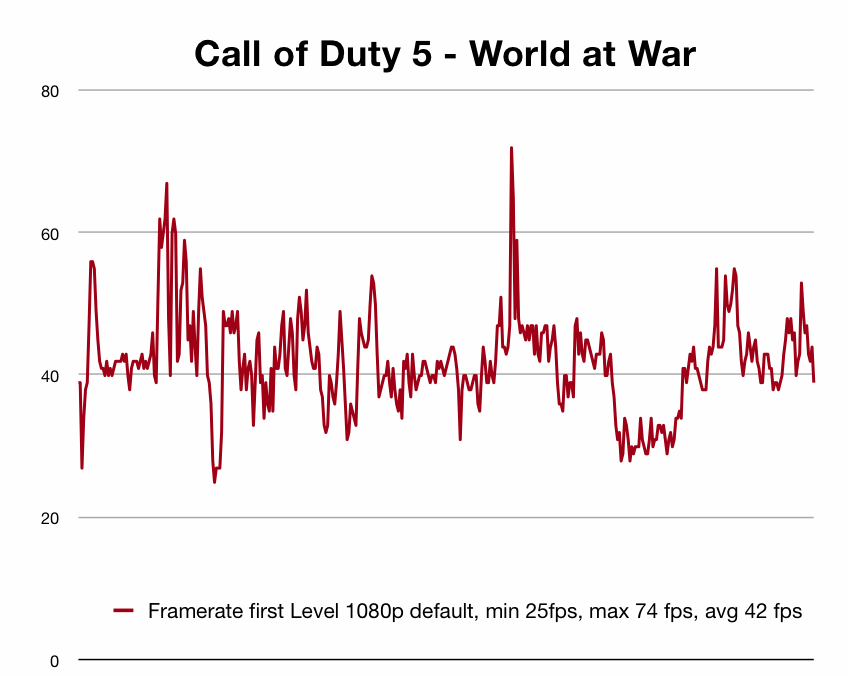
In Call of Duty 5, we achieved a similar performance with the single GeForce 280M. Even, the average frame rate was considerably higher.
Also in Far Cry 2 (we played the intro sequence of the game, which corresponds to the frame rates later in the game), the GTX 280M resulted a similar performance.
In the end, we tried to reproduce the test with Race Driver Grid. The first race of the full version accomplished almost the same result as PC Tuning recorded for the HD 4870 X2 in their test.
Though the results of PC Tuning cannot directly be compared with our results, it is noteworthy, that the single GeForce GTX 280M appears to perform similar as two HD 4870 (X2) in the Asus laptop.
To summarize, the nVIDIA GeForce GTX 280M wins the overall comparison with small advance. Yet, it is unsure, whether the ATI Mobility Radeon HD 4870 with faster GDDR5 is able to turn the tables. Up to now, no notebook with GDDR5 has been announced and due to the lower chip frequency, the benefit of GDDR5 for the HD 4870 remains questionable.
Gaming Impressions
In addition to comparing benchmarks, we examined some current games regarding the performance of the GTX 280M.
Burn Out Paradise ran in native screen resolution of 1920x1080 with highest details and 8x Anti Aliasing fluently with constant 60 fps (maximum upper limit of Burn Out Paradise). Only the shadow option SSAO must be deactivated. If this option is activated, the game stutters even in 1024x768 (although 40 fps are recorded by FRAPS).
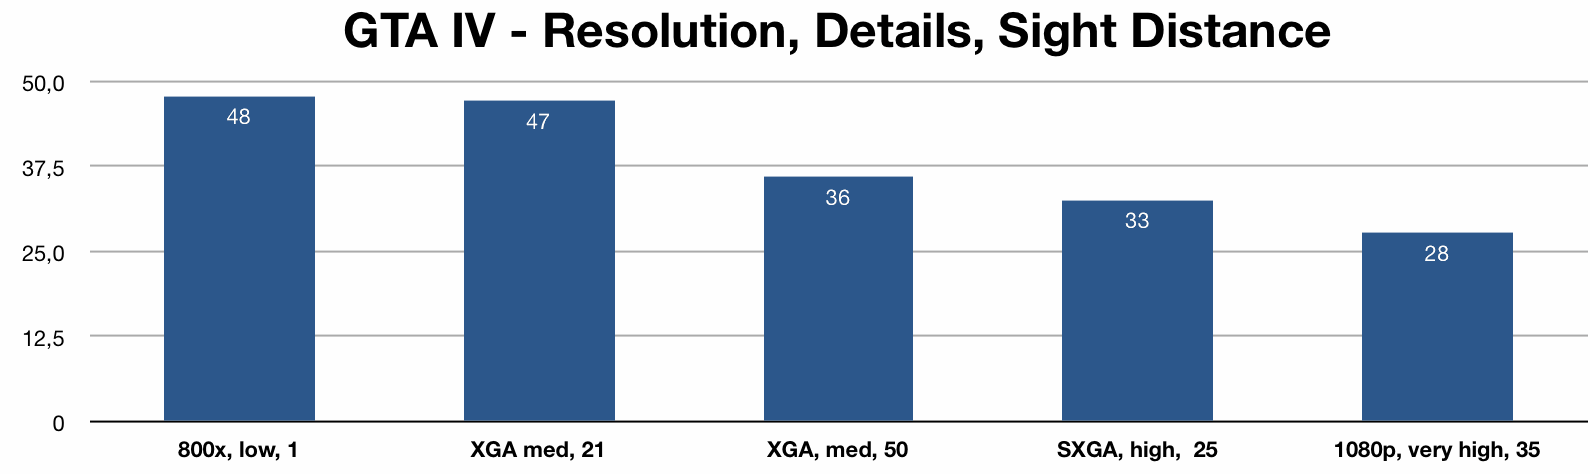
We evaluated the newest Grand Theft – GTA IV on different settings. Regrettably, on native display resolution of 1920p and high details, no smooth gaming pleasure was achieved (only 22 fps in average). A fluent representation could only be achieved on 1024x768, medium details and 21 distance of sight. 33 images per second were sufficient for an acceptable gaming pleasure – not really a good result for our high-end test sample. Partially, the result can be derived from the Dual-Core CPU of the reviewed sample as GTA 4 profits from quad core CPUs.
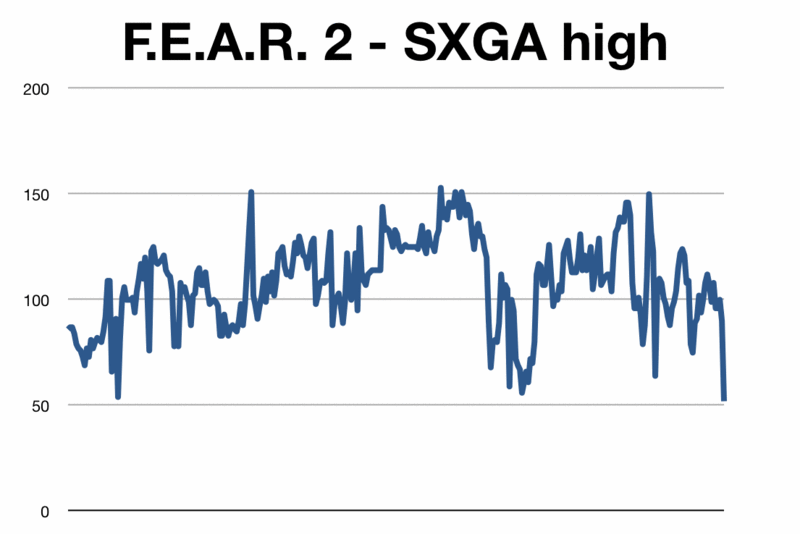
In the brand new horror shooter F.E.A.R. 2 the results looked much better. It ran eminently well with 93 images by second on highest details.
At last, we started the OpenGL multiplayer-shooter Enemy Territory Quake Wars. In a training game with bots, we recorded an average of 57 fps with 1920x1080 and maximum details. Due to the 44 fps (minimum), the game was playable fluently without lags.
Compared to desktop graphic cards
Directly compared to the desktop graphic cards, the GeForce GTX 280M is positioned somewhat below the higher clocked GeForce 9800 GTX+ (GTX 250), which also is based on the 55nm G92b core.
Conclusion

Evolution – so the GeForce GTX 280M can be described best. Though its new promising name, the new high-end GPU is similar to the old GeForce 9800M GTX and Quadro FX 3700M. Due to the smaller 55nm production process, nVIDIA achieved a clearly better performance to Watt ratio.
Regarding the benchmarks, the GTX looses the comparison versus the mobile HD 4870 in synthetic benchmarks. In real games, the GTX 280M appears to be the better pick (sometimes even better than the 4870 X2). Most actual games can be played on high details and the GTX 280M only has to give up in performance killers like GTA4. Therefore, the GeForce GTX 280M climbs the throne of our benchmark list for single GPUs.
A further advantage of the GTX 280M are the driver updates that can be downloaded from nVIDIA's homepage and, at moment, the CUDA software and PhysX support.
Laptop reviews with GeForce 280M GTX and further benchmarks are available at NVidia GeForce 280M GTX.
Run Benchmarks in Detail
Nvidia GeForce GTX 280M |
HD 4870 |
||
| Benchmark | 3,1 GHz CPU |
2,1 GHz CPU |
2,4 GHz CPU |
| 3DMark 2001 | 40754 | ||
| 3DMark 03 | 36865 | ||
| 3DMark 05 | 18082 | 14594 | |
| 3DMark 06 | 11767 | 10183 | |
| 3DMark Vantage | 5314 | 4860 | 5336 |
| 3DMark Vantage + Physx | 6330 | ||
| 3DMark Vantage GPU | 5071 | 5070 | |
| Cinebench OpenGL | 5072 | ||
| GTA 4, XGA, med, 50, 8 | 36,16 | ||
| GTA 4, 180p, very high, 35, 100, 1 | 28,01 | ||
| GTA 4, 800x600, low, 1 | 48,05 | ||
| GTA 4, XGA, med, 21, 10, 50, 8 | 47,3 | ||
| GTA 4, 1280x1024, high, 25, 100, | 32,74 | ||
| Cod 4, 1280x1024, 4xaa, alles on | 75 | 66,9 | 62? |
| Far Cry 2 640 low | 97,5 | 72,5 | |
| Far Cry 2 XGA high | 62,1 | 43,5 | |
| Far Cry 2 SXGA very high | 40,4 | 38,6 | 36,1 |
| Call of Juarez high XGA 4xAA | 33,4 | 33,2 | 48,2 |
| Crysis Warhead 800x600, low | 76 | 49 | |
| Crysis Warhead XGA, very high | 21 | 17 | |
| Crysis Warhead SXGA, very high | 17 | 17 | 14 |
| Crysis Warhead 1080p, very high | 12 | 12 | |
| WIC 800, very low | 176 | 110 | |
| WIC XGA, high | 46 | 34 | |
| WIC XGA, med | 77 | 51 | |
| WIC SXGA very hig | 26 | 26 | 26 |
| Supcom XGA, high, 2xAA | 45,4 | 50 | |
| HL2 Lost Coast XGA high | 143,7 | 109,5 | 165 |
| Crysis XGA GPU low | 105,7 | 68,6 | |
| Crysis XGA GPU med | 66,5 | 41,8 | |
| Crysis XGA GPU high | 44,7 | 33,6 | |
| Crysis SXGA GPU very high | 20,4 | 21,64 | |
| Doom3 low | 161 | ||
| Doom3 ultra | 160 | ||
| Doom3 ultra 1280x1024 16xAA | 36 | ||
| Burn Out Paradise 1920x1200 high | 60 | ||
| Fear 2 Demo SXGA high | 94 | ||
| ET Quake Wars 1080p ultra | 57 | ||
