Notebookcheck Logo

Intel Atom N455 vs Rockchip RK2918 1.2 GHz vs HiSilicon Kirin 9000W

Intel Atom N455

► remove from comparison Intel N455

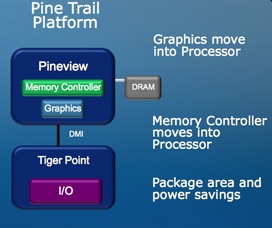
The Intel Atom N455 is a small and cheap entry level CPU for Netbooks and small laptops. In the package is an integrated memory controller for DDR3 main memory (the difference to the Atom N450) and the GMA 3150 graphics card

The performance of the whole system (Atom N455 and integrated GMA 3150) is only sufficient for basic tasks like surfing the web, or office working. HD video, video cutting, advanced photo editing, multitasking and of course gaming may overstrain the GPU and CPU. Compared to the previous Atom generation, the performance gain is only marginally above a similar clocked Atom N280 / GMA 950.

An advantage of the combination, is the small overall power consumption of the CPU, GPU and memory controller (only 6.5 Watt TDP). Intel states 20% power reduction and 60% package reduction. Therefore, the chip is ideally used in small Netbooks, MIDs, and thin laptops. Compared to the Z500 series combined with the US15W chipset (2.4+2.3 W), the power consumption is similar.

Rockchip RK2918 1.2 GHz

► remove from comparison

HiSilicon Kirin 9000W

► remove from comparison  Kirin 9000W

The HiSilicon Kirin 9000W is an SoC that can be used in smartphones and tablets based on Android and was first installed in the Huawei MatePad Pro 13.2.

Huawei does not reveal any information about the SoC. The little information that is available comes from benchmarks and system analysis tools. The CPU consists of three clusters with a total of 12 cores. The power-saving cluster has four ARM Cortex-A510 cores, each operating at up to 1,530 MHz, while six other cores use unspecified cores from HiSilicon (0x0D42) and clock at up to 2,150 MHz. The third cluster contains two HiSilicon cores (0x0D02), each with a maximum clock speed of 2,487 MHz. The performance cores could possibly be based on the TaiShan V120 architecture (as in the Kirin 9000S).

The single-core performance is correspondingly mixed, but the multi-core performance is at the level of a high-end SoC from 2022 due to the numerous cores.

A Maleoon 910 by HiSilicon is integrated as the graphics unit, similar to the 9000S (where it was clocked with up to 750MHz).

Nothing concrete is known about the manufacturing process or the architecture. The SoC will probably be manufactured in 7 nm at SMIC.

ModelIntel Atom N455Rockchip RK2918 1.2 GHzHiSilicon Kirin 9000W
SeriesIntel Atom
CodenamePinetrail
Series:
Intel Atom D5251.8 GHz2 / 4 cores
Intel Atom N455 « 1.66 GHz1 / 2 cores
Intel Atom N4501.66 GHz1 / 2 cores
Intel Atom N4351.33 GHz1 / 2 cores
newitem cores
HiSilicon Kirin 9000W1.53 - 2.49 GHz12 / 12 cores
UNISOC Tiger T3101.8 - 2 GHz4 / 4 cores
Rockchip RK32881.8 GHz4 / 4 cores
Apple A6x1.4 GHzcores
Apple A61 GHzcores
Apple S52 / 2 cores
HiSilicon k3v2 Hi36201.2 GHz4 / 4 cores
Rockchip RK3066 1.5 GHz1.5 GHz2 / 2 cores
Amlogic AML8726-MX1.5 GHz2 / 2 cores
Rockchip RK31681.2 GHz2 / 2 cores
Rockchip RK2918 1.2 GHz « 1.2 GHz1 / 1 cores
ARM Cortex A8 1.2 GHz1.2 GHz1 / 1 cores
Telechips TCC8803 1GHz1 GHz1 / 1 cores
Loongson 2F 900MHz0.9 GHz1 / 1 cores
CSR86700.08 GHzcores
ARM Cortex-M4 cores
HiSilicon Hi6262 cores
DK3.5+STcores
unknown cores
newitem cores
HiSilicon Kirin 9000W « 1.53 - 2.49 GHz12 / 12 cores
UNISOC Tiger T3101.8 - 2 GHz4 / 4 cores
Rockchip RK32881.8 GHz4 / 4 cores
Apple A6x1.4 GHzcores
Apple A61 GHzcores
Apple S52 / 2 cores
HiSilicon k3v2 Hi36201.2 GHz4 / 4 cores
Rockchip RK3066 1.5 GHz1.5 GHz2 / 2 cores
Amlogic AML8726-MX1.5 GHz2 / 2 cores
Rockchip RK31681.2 GHz2 / 2 cores
Rockchip RK2918 1.2 GHz1.2 GHz1 / 1 cores
ARM Cortex A8 1.2 GHz1.2 GHz1 / 1 cores
Telechips TCC8803 1GHz1 GHz1 / 1 cores
Loongson 2F 900MHz0.9 GHz1 / 1 cores
CSR86700.08 GHzcores
ARM Cortex-M4 cores
HiSilicon Hi6262 cores
DK3.5+STcores
unknown cores
Clock1660 MHz1200 MHz1530 - 2490 MHz
FSB533
L2 Cache512 KB
Cores / Threads1 / 21 / 112 / 12
2 x 2.5 GHz
6 x 2.2 GHz
4 x 1.5 GHz ARM Cortex-A510
TDP6.5 Watt
Technology45 nm55 nm7 nm
max. Temp.100 °C
SocketFCBGA559
Featuresintegrated DDR3 memory controller, integrated GMA 3150 GPU, HyperthreadingVivante GC800, DDR1-3 memory controller, hardware video en- and decoder
Architecturex86ARMARM
$64 U.S.
Announced
iGPUVivante GC800HiSilicon Maleoon 910

Benchmarks

Cinebench R10 - Cinebench R10 Rend. Single (32bit)
100%
1 N455 +
min: 509     avg: 547     median: 564 (3%)     max: 568 Points
Cinebench R10 - Cinebench R10 Rend. Multi (32bit)
100%
1 N455 +
min: 840     avg: 856     median: 863 (1%)     max: 866 Points
wPrime 2.10 - wPrime 2.0 1024m *
100%
1 N455 +
min: 3712     avg: 3751     median: 3750.5 (44%)     max: 3789 s
wPrime 2.10 - wPrime 2.0 32m *
100%
1 N455 +
min: 118     avg: 119.5     median: 119.5 (24%)     max: 121 s
3DMark 06 - CPU - 3DMark 06 - CPU
100%
1 N455 +
min: 445     avg: 476.7     median: 490 (1%)     max: 495 Points
Super Pi mod 1.5 XS 1M - Super Pi mod 1.5 XS 1M *
100%
1 N455 +
min: 92     avg: 94     median: 95 (21%)     max: 95 s
Super Pi mod 1.5 XS 2M - Super Pi mod 1.5 XS 2M *
100%
1 N455 +
min: 202     avg: 213.7     median: 207 (9%)     max: 232 s
Super Pi Mod 1.5 XS 32M - Super Pi mod 1.5 XS 32M *
100%
1 N455 +
min: 4417     avg: 4523     median: 4533 (20%)     max: 4618 s
SiSoft Sandra Dhrystone (MIPS) - SiSoft Sandra Dhrystone (MIPS)
100%
1 N455 +
min: 4196     avg: 4197     median: 4198 (2%)     max: 4198 MIPS
SiSoft Sandra Whetstone (MFLOPS) - SiSoft Sandra Whetstone (MFLOPS)
100%
1 N455 +
min: 3505     avg: 3506     median: 3506 (3%)     max: 3506 MFLOPS
PCMark 05 - PCMark 05 - Standard
100%
1 N455 +
min: 1261     avg: 1317     median: 1266 (3%)     max: 1423 Points
Windows 7 Experience Index - Win7 CPU
100%
1 N455 +
min: 2.3     avg: 2.3     median: 2.3 (29%)     max: 2.4 Points
3DMark - 3DMark Sling Shot Extreme (ES 3.1) Unlimited Physics
5690 Points (67%)
3DMark - 3DMark Sling Shot (ES 3.0) Unlimited Physics
5614 Points (64%)
Geekbench 6.2 - Geekbench 6.2 Single-Core
1174 Points (32%)
Geekbench 6.2 - Geekbench 6.2 Multi-Core
4088 Points (16%)
Geekbench 5.5 - Geekbench 5.1 - 5.4 64 Bit Single-Core
867 Points (37%)
Geekbench 5.5 - Geekbench 5.1 - 5.4 64 Bit Multi-Core
3878 Points (7%)
Geekbench 4.4 - Geekbench 4.1 - 4.4 64 Bit Single-Core
4712 Points (47%)
Geekbench 4.4 - Geekbench 4.1 - 4.4 64 Bit Multi-Core
13978 Points (15%)
Linpack Android / IOS - Linpack Single Thread
14.3 MFLOPS (1%)
Mozilla Kraken 1.1 - Kraken 1.1 Total Score *
1202 ms (1%)
Sunspider - Sunspider 1.0 Total Score *
203.8 ms (2%)
Octane V2 - Octane V2 Total Score
33982 Points (31%)
WebXPRT 4 - WebXPRT 4 Score
99 Points (28%)
Quadrant Standard Edition 2.0 - Quadrant Standard 2.0 Total Score
1249 points (3%)
Antutu v9 - AnTuTu v9 Total Score
655341 Points (40%)
Antutu v9 - AnTuTu v9 CPU
182634 Points (50%)
PCMark for Android - PCM f. Android Storage 2.0 random write internal
110.5 MB/s (81%)
PCMark for Android - PCM f. Android Storage 2.0 seq write internal
1435 MB/s (44%)
PCMark for Android - PCM f. Android Storage 2.0 random read internal
63.2 MB/s (78%)
PCMark for Android - PCM f. Android Storage 2.0 seq read internal
1522 MB/s (42%)
PCMark for Android - PCM f. Android Storage 2.0 score
45015 Points (71%)
PCMark for Android - PCM f. Android Work Score 3.0
10620 Points (49%)
CrossMark - CrossMark Overall
834 Points (32%)
Power Consumption - Geekbench 5.5 Power Consumption 150cd *
8.2 Watt (4%)
Power Consumption - Idle Power Consumption 150cd 1min *
4.2 Watt (5%)

Average Benchmarks Intel Atom N455 → 0% n=

Average Benchmarks Rockchip RK2918 1.2 GHz → 0% n=

Average Benchmarks HiSilicon Kirin 9000W → 0% n=

- Range of benchmark values for this graphics card
- Average benchmark values for this graphics card
* Smaller numbers mean a higher performance
1 This benchmark is not used for the average calculation

v1.26
log 27. 23:18:16

#0 checking url part for id 602 +0s ... 0s

#1 checking url part for id 3317 +0s ... 0s

#2 checking url part for id 17388 +0s ... 0s

#3 not redirecting to Ajax server +0s ... 0s

#4 did not recreate cache, as it is less than 5 days old! Created at Sat, 25 May 2024 05:38:31 +0200 +0.001s ... 0.001s

#5 composed specs +0.089s ... 0.09s

#6 did output specs +0s ... 0.09s

#7 getting avg benchmarks for device 602 +0.003s ... 0.093s

#8 got single benchmarks 602 +0.045s ... 0.138s

#9 getting avg benchmarks for device 3317 +0.003s ... 0.14s

#10 got single benchmarks 3317 +0.005s ... 0.146s

#11 getting avg benchmarks for device 17388 +0.003s ... 0.148s

#12 got single benchmarks 17388 +0.007s ... 0.155s

#13 got avg benchmarks for devices +0s ... 0.155s

#14 min, max, avg, median took s +0.09s ... 0.246s

#15 return log +0s ... 0.246s

Please share our article, every link counts!
> Expert Reviews and News on Laptops, Smartphones and Tech Innovations > Benchmarks / Tech > Processor Comparison - Head 2 Head
Redaktion, 2017-09- 8 (Update: 2023-07- 1)