Microsoft released its fourth quarter and full year earnings results recently. While the company's net income remains huge at US$4.97 billion, the company had to admit they were facing difficulties because of the declining PC market. Perhaps more important to its investors, Microsoft also admitted to a US$900 million “charge related to Surface RT inventory adjustments”.
It comes as little surprise that the RT is not performing very well. Reviewers and the public both have been near unanimous in their dislike of the comparatively expensive device. Still, it is curious that Microsoft would have stockpiled such a huge inventory of the unpopular tablet.
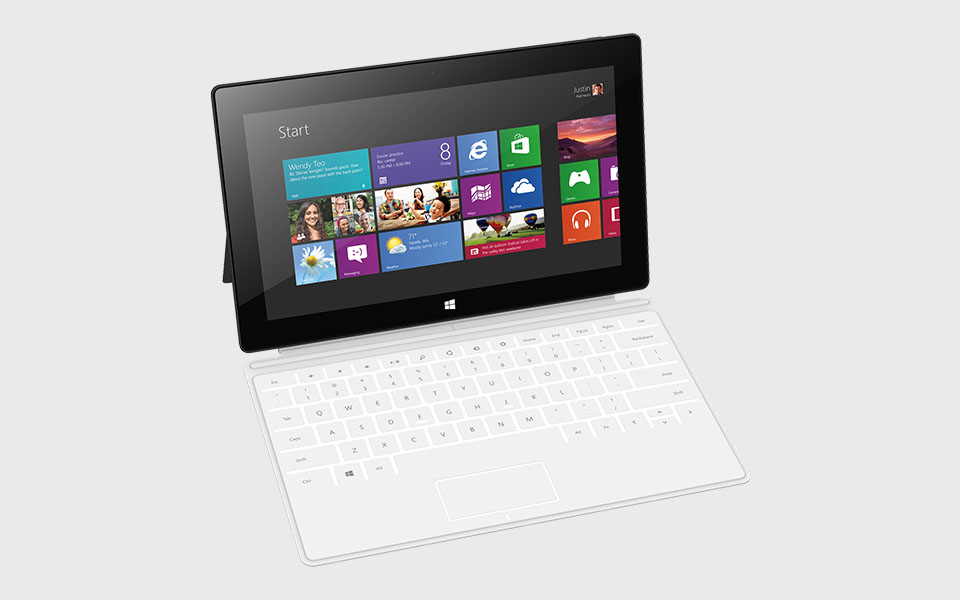
The Surface RT has been marketed as a productivity device, and while good on paper, the limited scope of the product makes it a hard sell in its price range. This is in part due to a still relatively barren Windows App store, but mostly to its high price (US$499) and expensive add-on keyboards (US$119-129). The situation is made worse still by the new lower prices of full Windows 8 devices, compatible with all legacy Windows apps, launched by other electronic manufacturers (such as the Acer Iconia W3 starting at US$379 and US$80 for the keyboard).
The American company also shot themselves in the foot when they extended the offer of free Microsoft Office to all 10-inch and smaller Windows 8 tablets, since Home and Student 2013 was one of the few advantages the RT had over its competition.
Microsoft tried to rectify the situation first by offering a free keyboard-cover with an RT, then by just cutting the price to US$350 (but removing the bundled cover), but the fact remains that there are less expensive or similarly priced choices available that can do more. Perhaps some kind of turn around could be achieved if the cover were included at the new lower price, though that may not leave much of a profit margin.
Despite the setback, Microsoft has reaffirmed its confidence in the RT tablet and OS and information has leaked that a refresh of the device is coming in the next year.
Press Release
Microsoft Reports Fourth-Quarter and Full-Year Results
Results reflect ongoing strength in enterprise offset by a challenging consumer PC market.
REDMOND, Wash. — July 18, 2013 — Microsoft Corp. today announced quarterly revenue of $19.90 billion for the quarter ended June 30, 2013. Operating income, net income, and diluted earnings per share for the quarter were $6.07 billion, $4.97 billion, and $0.59 per share. These financial results include a $900 million charge, or a $0.07 per share impact, related to Surface RT inventory adjustments.
In addition, these financial results reflect the recognition of $782 million of previously deferred revenue related to the Office Upgrade Offer. All growth comparisons relate to the corresponding period in the last fiscal year.
The following table reconciles these financial results reported in accordance with generally accepted accounting principles (GAAP) to non-GAAP financial results. We have provided this non-GAAP financial information to aid investors in better understanding the company’s performance.
| Three Months Ended June 30, | Percentage Change | ||||||
(In millions, except per share amounts and percentages) | Revenue | Operating income | Diluted EPS | Revenue | Operating income | Diluted EPS | ||
2012 As reported (GAAP) | $18,059 | $192 | ($0.06) | | | | ||
Goodwill impairment | | $6,193 | $0.73 | | | | ||
Windows Upgrade Offer | $540 | $540 | $0.06 | | | | ||
2012 As adjusted (non-GAAP) | $18,599 | $6,925 | $0.73 | | | | ||
2013 As reported (GAAP) | $19,896 | $6,073 | $0.59 | 10% | * | * | ||
Office Upgrade Offer | ($782) | ($782) | ($0.07) | | | | ||
2013 As adjusted (non-GAAP) | $19,114 | $5,291 | $0.52 | 3% | (24)% | (29)% | ||
*Not meaningful
“While our fourth quarter results were impacted by the decline in the PC market, we continue to see strong demand for our enterprise and cloud offerings, resulting in a record unearned revenue balance this quarter. We also saw increasing consumer demand for services like Office 365, Outlook.com, Skype, and Xbox LIVE,” said Amy Hood, chief financial officer at Microsoft. “While we have work ahead of us, we are making the focused investments needed to deliver on long-term growth opportunities like cloud services.”
“We are working hard to deliver compelling new devices and high value experiences from Microsoft and our partners in the coming months, including new Windows 8.1 tablets and PCs,” said Steve Ballmer, chief executive officer at Microsoft. “Our new products and the strategic realignment we announced last week position us well for long-term success, as we focus our energy and resources on creating a family of devices and services for individuals and businesses that empower people around the globe at home, at work and on the go, for the activities they value the most.”
For Microsoft’s fiscal year 2013, the company’s revenue, operating income, and diluted earnings per share were $77.85 billion, $26.76 billion, and $2.58 per share. These financial results include a $900 million charge, or a $0.07 per share impact, related to Surface RT inventory adjustments. In addition, these financial results reflect the recognition of $540 million of previously deferred revenue related to the Windows Upgrade Offer, and a $733 million expense related to the European Commission fine.
| Twelve Months Ended June 30, | Percentage Change | ||||||
(In millions, except per share amounts and percentages) | Revenue | Operating income | Diluted EPS | Revenue | Operating income | Diluted EPS | ||
2012 As reported (GAAP) | $73,723 | $21,763 | $2.00 | | | | ||
Goodwill impairment | | $6,193 | $0.73 | | | | ||
Windows Upgrade Offer | $540 | $540 | $0.06 | | | | ||
2012 As adjusted (non-GAAP) | $74,263 | $28,496 | $2.78 | | | | ||
2013 As reported (GAAP) | $77,849 | $26,764 | $2.58 | 6% | 23% | 29% | ||
Windows Upgrade Offer | ($540) | ($540) | ($0.05) | | | | ||
European Commission fine | | $733 | $0.09 | | | | ||
2013 As adjusted (non-GAAP) | $77,309 | $26,957 | $2.62 | 4% | (5)% | (6)% | ||
*Totals do not foot due to rounding
Microsoft Business Division revenue grew 14% for the fourth quarter and 3% for the full year. Adjusting for the recognition of previously deferred revenue related to the Office Upgrade Offer, Microsoft Business Division non-GAAP revenue increased 2% for the fourth quarter. Office 365 is now on a $1.5 billion annual revenue run rate.
Server & Tools revenue grew 9% for the fourth quarter and 9% for the full year, driven by double-digit percentage revenue growth in SQL Server and System Center.
Windows Division revenue grew 6% for the fourth quarter and 5% for the full year. Excluding the impact of the prior year Windows Upgrade Offer revenue deferral, Windows Division non-GAAP revenue decreased 6% for the fourth quarter and 1% for the full year. In June, Microsoft released the public preview of Windows 8.1 which will be made available to OEMs in August.
Online Services Division revenue grew 9% for the fourth quarter and 12% for the full year, driven by an increase in revenue per search and volume. Bing organic U.S. search market share was 17.9% for the month of June 2013, up 230 basis points from the prior year period.
Entertainment and Devices Division grew 8% for the fourth quarter and 6% for the full year. During the quarter, transactional revenue within Xbox LIVE grew nearly 20%, and we unveiled our next-generation gaming and entertainment console, Xbox One.
“We continue to see strong demand for our enterprise products and services, with more and more customers making long-term commitments to the Microsoft platform,” said Kevin Turner, chief operating officer at Microsoft. “The growing adoption of our cloud services, including Office 365, Windows Azure and Dynamics CRM, continues to demonstrate our leadership position in the cloud.”
Operating Expense Outlook
Microsoft is revising operating expense guidance downward to $31.3 billion to $31.9 billion for the full fiscal year ending June 30, 2014.
Webcast Details
Amy Hood, executive vice president and chief financial officer, Frank Brod, chief accounting officer, and Chris Suh, general manager of Investor Relations, will host a conference call and webcast at 2:30 p.m. PDT (5:30 p.m. EDT) today to discuss details of the company’s performance for the quarter and certain forward-looking information. The session may be accessed at http://www.microsoft.com/investor. The webcast will be available for replay through the close of business on July 18, 2014.
About Microsoft
Founded in 1975, Microsoft (Nasdaq “MSFT”) is the worldwide leader in software, services and solutions that help people and businesses realize their full potential.
Forward-Looking Statements
Statements in this release that are “forward-looking statements” are based on current expectations and assumptions that are subject to risks and uncertainties. Actual results could differ materially because of factors such as:
intense competition in all of Microsoft’s markets;
execution and competitive risks associated with our devices and services strategy;
significant investments in new products and services that may not be profitable;
Microsoft’s continued ability to protect its intellectual property rights;
claims that Microsoft has infringed the intellectual property rights of others;
the possibility of unauthorized disclosure of significant portions of Microsoft’s source code;
cyber-attacks and security vulnerabilities in Microsoft products that could reduce revenue or lead to liability;
improper disclosure of personal data that could result in liability and harm to Microsoft’s reputation;
outages, data losses, and disruptions of our online services if we fail to maintain an adequate operations infrastructure;
government litigation and regulation that may limit how Microsoft designs and markets its products;
Microsoft’s ability to attract and retain talented employees;
delays in product development and related product release schedules;
unfavorable changes in general economic or market conditions, disruption of our partner networks or sales channels, or the availability of credit that affect demand for Microsoft’s products and services or the value of our investment portfolio;
adverse results in legal disputes;
unanticipated tax liabilities;
quality or supply problems in Microsoft’s consumer hardware or other vertically integrated hardware and software products;
impairment of goodwill, fixed assets, inventory or amortizable intangible assets causing a charge to earnings;
exposure to increased economic and regulatory uncertainties from operating a global business;
geopolitical conditions, natural disaster, cyber-attack or other catastrophic events disrupting Microsoft’s business; and
acquisitions, joint ventures, and strategic alliances that adversely affect the business.
For further information regarding risks and uncertainties associated with Microsoft’s business, please refer to the “Management’s Discussion and Analysis of Financial Condition and Results of Operations” and “Risk Factors” sections of Microsoft’s SEC filings, including, but not limited to, its annual report on Form 10-K and quarterly reports on Form 10-Q, copies of which may be obtained by contacting Microsoft’s Investor Relations department at (800) 285-7772 or at Microsoft’s Investor Relations website at http://www.microsoft.com/investor.
All information in this release is as of July 18, 2013. The company undertakes no duty to update any forward-looking statement to conform the statement to actual results or changes in the company’s expectations.
For more information, press only:
Rapid Response Team, Waggener Edstrom Worldwide, (503) 443-7070, rrt@waggeneredstrom.com
For more information, financial analysts and investors only:
Chris Suh, general manager, Investor Relations, (425) 706-4400
Note to editors: For more information, news and perspectives from Microsoft, please visit the Microsoft News Center at http://www.microsoft.com/news/. Web links, telephone numbers, and titles were correct at time of publication, but may since have changed. Shareholder and financial information, as well as today’s 2:30 p.m. PDT conference call with investors and analysts, is available at http://www.microsoft.com/investor.
|
|
|
|
|
|
| |||||||
|
|
|
|
|
|
|
| ||||||
INCOME STATEMENTS | |||||||||||||
(In millions, except per share amounts)(Unaudited) | |||||||||||||
|
|
|
|
|
|
|
| ||||||
| Three Months Ended June 30, |
| Twelve Months Ended June 30, | ||||||||||
|
| ||||||||||||
| 2013 |
| 2012 |
| 2013 |
| 2012 | ||||||
Revenue | $ 19,896 |
| $18,059 |
| $ 77,849 |
| $73,723 | ||||||
Cost of revenue | 5,602 |
| 4,163 |
| 20,249 |
| 17,530 | ||||||
Gross profit | 14,294 |
| 13,896 |
| 57,600 |
| 56,193 | ||||||
Operating expenses: |
|
|
|
|
|
|
| ||||||
Research and development | 2,783 |
| 2,594 |
| 10,411 |
| 9,811 | ||||||
Sales and marketing | 4,228 |
| 3,781 |
| 15,276 |
| 13,857 | ||||||
General and administrative | 1,210 |
| 1,136 |
| 5,149 |
| 4,569 | ||||||
Goodwill impairment | 0 |
| 6,193 |
| 0 |
| 6,193 | ||||||
Total operating expenses | 8,221 |
| 13,704 |
| 30,836 |
| 34,430 | ||||||
Operating income | 6,073 |
| 192 |
| 26,764 |
| 21,763 | ||||||
Other income | 72 |
| 167 |
| 288 |
| 504 | ||||||
Income before income taxes | 6,145 |
| 359 |
| 27,052 |
| 22,267 | ||||||
Provision for income taxes | 1,180 |
| 851 |
| 5,189 |
| 5,289 | ||||||
Net income (loss) | $ 4,965 |
| $ (492) |
| $ 21,863 |
| $16,978 | ||||||
|
|
|
|
|
|
|
| ||||||
Earnings (loss) per share: |
|
|
|
|
|
|
| ||||||
Basic | $ 0.59 |
| $ (0.06) |
| $ 2.61 |
| $ 2.02 | ||||||
Diluted | $ 0.59 |
| $ (0.06) |
| $ 2.58 |
| $ 2.00 | ||||||
Weighted average shares outstanding: |
|
|
|
|
|
| |||||||
Basic | 8,345 |
| 8,388 |
| 8,375 |
| 8,396 | ||||||
Diluted | 8,442 |
| 8,388 |
| 8,470 |
| 8,506 | ||||||
Cash dividends declared per | $ 0.23 |
| $ 0.20 |
| $ 0.92 |
| $ 0.80 | ||||||
MICROSOFT CORPORATION |
|
|
|
|
|
|
| ||||||
|
|
|
|
|
|
|
| ||||||
COMPREHENSIVE INCOME STATEMENTS | |||||||||||||
(In millions)(Unaudited) | |||||||||||||
|
|
|
|
|
|
|
| ||||||
| Three Months Ended June 30, |
| Twelve Months Ended June 30, | ||||||||||
|
| ||||||||||||
| 2013 |
| 2012 |
| 2013 |
| 2012 | ||||||
Net income (loss) | $ 4,965 |
| $ (492) |
| $ 21,863 |
| $16,978 | ||||||
Other comprehensive income (loss): |
|
|
|
|
|
| |||||||
Net unrealized gains (losses) on | (7) |
| 63 |
| (26) |
| 255 | ||||||
Net unrealized gains (losses) on | (381) |
| 161 |
| 363 |
| (390) | ||||||
Translation adjustments and | (74) |
| (134) |
| (16) |
| (306) | ||||||
Other comprehensive income | (462) |
| 90 |
| 321 |
| (441) | ||||||
Comprehensive income (loss) | $ 4,503 |
| $ (402) |
| $ 22,184 |
| $16,537 | ||||||
MICROSOFT CORPORATION |
|
|
| |||||||
|
|
|
| |||||||
BALANCE SHEETS | ||||||||||
(In millions)(Unaudited) | ||||||||||
|
|
|
| |||||||
| June 30, 2013 |
| June 30, 2012 | |||||||
Assets |
|
|
| |||||||
Current assets: |
|
|
| |||||||
Cash and cash equivalents | $ 3,804 |
| $ 6,938 | |||||||
Short-term investments (including securities | 73,218 |
| 56,102 | |||||||
Total cash, cash equivalents, and short-term | 77,022 |
| 63,040 | |||||||
Accounts receivable, net of allowance for doubtful | 17,486 |
| 15,780 | |||||||
Inventories | 1,938 |
| 1,137 | |||||||
Deferred income taxes | 1,632 |
| 2,035 | |||||||
Other | 3,388 |
| 3,092 | |||||||
Total current assets | 101,466 |
| 85,084 | |||||||
Property and equipment, net of accumulated | 9,991 |
| 8,269 | |||||||
Equity and other investments | 10,844 |
| 9,776 | |||||||
Goodwill | 14,655 |
| 13,452 | |||||||
Intangible assets, net | 3,083 |
| 3,170 | |||||||
Other long-term assets | 2,392 |
| 1,520 | |||||||
Total assets | $ 142,431 |
| $ 121,271 | |||||||
|
|
|
| |||||||
Liabilities and stockholders' equity |
|
|
| |||||||
Current liabilities: |
|
|
| |||||||
Accounts payable | $ 4,828 |
| $ 4,175 | |||||||
Current portion of long-term debt | 2,999 |
| 1,231 | |||||||
Accrued compensation | 4,117 |
| 3,875 | |||||||
Income taxes | 592 |
| 789 | |||||||
Short-term unearned revenue | 20,639 |
| 18,653 | |||||||
Securities lending payable | 645 |
| 814 | |||||||
Other | 3,597 |
| 3,151 | |||||||
Total current liabilities | 37,417 |
| 32,688 | |||||||
Long-term debt | 12,601 |
| 10,713 | |||||||
Long-term unearned revenue | 1,760 |
| 1,406 | |||||||
Deferred income taxes | 1,709 |
| 1,893 | |||||||
Other long-term liabilities | 10,000 |
| 8,208 | |||||||
Total liabilities | 63,487 |
| 54,908 | |||||||
Commitments and contingencies |
|
|
| |||||||
Stockholders' equity: |
|
|
| |||||||
Common stock and paid-in capital - shares | 67,306 |
| 65,797 | |||||||
Retained earnings (deficit) | 9,895 |
| (856) | |||||||
Accumulated other comprehensive income | 1,743 |
| 1,422 | |||||||
Total stockholders' equity | 78,944 |
| 66,363 | |||||||
Total liabilities and stockholders' equity | $ 142,431 |
| $ 121,271 | |||||||
|
|
|
|
|
|
| ||||
CASH FLOW STATEMENTS | ||||||||||
(In millions)(Unaudited) | ||||||||||
|
|
|
| |||||||
| Three Months Ended June 30, |
| Twelve Months Ended June 30, | |||||||
|
| |||||||||
| 2013 |
| 2012 |
| 2013 |
| 2012 | |||
Operations |
|
|
|
|
|
|
| |||
Net income (loss) | $ 4,965 |
| $ (492) |
| $ 21,863 |
| $16,978 | |||
Adjustments to reconcile net |
|
|
|
|
|
|
| |||
Goodwill impairment | 0 |
| 6,193 |
| 0 |
| 6,193 | |||
Depreciation, amortization, and | 983 |
| 797 |
| 3,755 |
| 2,967 | |||
Stock-based compensation | 601 |
| 520 |
| 2,406 |
| 2,244 | |||
Net recognized losses (gains) | 99 |
| (126) |
| 80 |
| (200) | |||
Excess tax benefits from | (17) |
| (9) |
| (209) |
| (93) | |||
Deferred income taxes | (423) |
| 672 |
| (19) |
| 954 | |||
Deferral of unearned revenue | 15,621 |
| 14,279 |
| 44,253 |
| 36,104 | |||
Recognition of unearned | (11,069) |
| (9,354) |
| (41,921) |
| (33,347) | |||
Changes in operating assets |
|
|
|
|
|
|
| |||
Accounts receivable | (5,666) |
| (5,007) |
| (1,807) |
| (1,156) | |||
Inventories | 187 |
| 263 |
| (802) |
| 184 | |||
Other current assets | (33) |
| (445) |
| (129) |
| 493 | |||
Other long-term assets | (152) |
| (212) |
| (478) |
| (248) | |||
Accounts payable | 486 |
| 349 |
| 537 |
| (31) | |||
Other current liabilities | 27 |
| 517 |
| 146 |
| 410 | |||
Other long-term liabilities | 294 |
| (268) |
| 1,158 |
| 174 | |||
Net cash from | 5,903 |
| 7,677 |
| 28,833 |
| 31,626 | |||
Financing |
|
|
|
|
|
|
| |||
Proceeds from issuance of debt | 2,651 |
| 0 |
| 4,883 |
| 0 | |||
Repayments of debt | (1,346) |
| 0 |
| (1,346) |
| 0 | |||
Common stock issued | 166 |
| 278 |
| 931 |
| 1,913 | |||
Common stock repurchased | (1,042) |
| (1,030) |
| (5,360) |
| (5,029) | |||
Common stock cash dividends paid | (1,921) |
| (1,678) |
| (7,455) |
| (6,385) | |||
Excess tax benefits from | 17 |
| 9 |
| 209 |
| 93 | |||
Other | 6 |
| 0 |
| (10) |
| 0 | |||
Net cash used in financing | (1,469) |
| (2,421) |
| (8,148) |
| (9,408) | |||
Investing |
|
|
|
|
|
|
| |||
Additions to property and | (1,794) |
| (622) |
| (4,257) |
| (2,305) | |||
Acquisition of companies, net of | (20) |
| (526) |
| (1,584) |
| (10,112) | |||
Purchases of investments | (27,024) |
| (11,953) |
| (75,396) |
| (57,250) | |||
Maturities of investments | 617 |
| 2,453 |
| 5,130 |
| 15,575 | |||
Sales of investments | 22,301 |
| 6,383 |
| 52,464 |
| 29,700 | |||
Securities lending payable | 81 |
| (397) |
| (168) |
| (394) | |||
Net cash used in investing | (5,839) |
| (4,662) |
| (23,811) |
| (24,786) | |||
Effect of exchange rates on cash | (31) |
| (44) |
| (8) |
| (104) | |||
Net change in cash and cash | (1,436) |
| 550 |
| (3,134) |
| (2,672) | |||
Cash and cash equivalents, | 5,240 |
| 6,388 |
| 6,938 |
| 9,610 | |||
Cash and cash equivalents, end of | $ 3,804 |
| $ 6,938 |
| $ 3,804 |
| $ 6,938 | |||
MICROSOFT CORPORATION |
|
|
|
|
|
|
| |||
|
|
|
|
|
|
|
| |||
SEGMENT REVENUE AND OPERATING INCOME (LOSS) | ||||||||||
(In millions)(Unaudited) | ||||||||||
|
|
|
|
|
|
|
| |||
| Three Months Ended June 30, |
| Twelve Months Ended June 30, | |||||||
|
| |||||||||
| 2013 |
| 2012 |
| 2013 |
| 2012 | |||
Revenue |
|
|
|
|
|
|
| |||
Windows Division | $ 4,411 |
| $ 4,152 |
| $ 19,239 |
| $18,400 | |||
Server and Tools | 5,502 |
| 5,050 |
| 20,281 |
| 18,534 | |||
Online Services Division | 804 |
| 735 |
| 3,201 |
| 2,867 | |||
Microsoft Business Division | 7,213 |
| 6,324 |
| 24,724 |
| 24,111 | |||
Entertainment and Devices Division | 1,915 |
| 1,781 |
| 10,165 |
| 9,599 | |||
Unallocated and other | 51 |
| 17 |
| 239 |
| 212 | |||
Consolidated | $ 19,896 |
| $18,059 |
| $ 77,849 |
| $73,723 | |||
|
|
|
|
|
|
|
| |||
Operating income (loss) |
|
|
|
|
|
|
| |||
Windows Division | $ 1,099 |
| $ 2,422 |
| $ 9,504 |
| $11,555 | |||
Server and Tools | 2,325 |
| 2,040 |
| 8,164 |
| 7,235 | |||
Online Services Division | (372) |
| (6,672) |
| (1,281) |
| (8,125) | |||
Microsoft Business Division | 4,873 |
| 4,128 |
| 16,194 |
| 15,832 | |||
Entertainment and Devices Division | (110) |
| (252) |
| 848 |
| 380 | |||
Corporate-level activity | (1,742) |
| (1,474) |
| (6,665) |
| (5,114) | |||
Consolidated | $ 6,073 |
| $ 192 |
| $ 26,764 |
| $21,763 | |||
MICROSOFT CORPORATION
FOURTH QUARTER FINANCIAL HIGHLIGHTS
All growth comparisons relate to the corresponding period in the last fiscal year.
SUMMARY
This quarter demonstrated both the momentum that Microsoft is experiencing with business customers, as well as the work ahead of us as the device market continues its evolution. Business customers continue to choose Microsoft products for the functionality, flexibility, and value they receive, particularly as they look to take advantage of the cloud. Products such as Office 365 and Windows Azure provide organizations cloud solutions to complement and extend the functionality of their on-premise counterparts of Office and Windows Server. With the transition to cloud services, and the consumerization of IT, CIOs are also looking to Microsoft products such as Windows, Windows Server, and System Center, to address their management and security concerns. Within the device market, the shift towards mobile and touch enabled devices continued. Windows 8, and the Windows 8.1 update which is now in preview, brings Windows to these new classes of devices. Collectively the Windows ecosystem is also moving to meet the changes necessitated by this evolution, as demonstrated by lower priced devices, improved battery life, and an increasing number of touch enabled Windows devices available in the market. The Windows ecosystem must make progress on these fronts, over time, for Windows to build share in this evolving universe of devices.
Revenue this quarter was $19.9 billion, up 10% year over year. Excluding the prior year deferral of $540 million related to the Windows Upgrade Offer, and the recognition of $782 million in this quarter associated with the Office Upgrade Offer, revenue grew $515 million, or 3%. Growth in Server and Tools revenue and revenue from new products and services, including Windows 8, Surface, and the new Office, was offset in part by the impact on revenue of a decline in the x86 PC market.
Enterprise demand for our products and services drove strong multi-year commitments resulting in record unearned revenue of $22.4 billion. As businesses invest in the Microsoft platform and our roadmap, they are doing so by attaching additional seats and additional products and services to their multi-year enterprise agreements.
Cost of revenue grew $1.4 billion, or 35%, primarily reflecting product costs associated with Surface and Windows 8, including a charge for Surface RT inventory adjustments of approximately $900 million, higher headcount-related expenses and increased online infrastructure expenses, offset in part by decreased traffic acquisition costs.
Operating expenses decreased primarily due to the $6.2 billion goodwill impairment charge related to our Online Services Division taken during the prior year. Excluding the goodwill impairment charge, other operating expenses increased primarily due to increased advertising of Windows 8 and Surface.
Our effective tax rate for the fourth quarter of fiscal year 2013 was 19% as compared to 237% for the fourth quarter of fiscal year 2012. Our effective tax rate decreased from the prior year due mainly to the non-tax deductible goodwill impairment charge in the prior year. Adjusting for the non-tax deductible goodwill impairment charge, our effective tax rate for the fourth quarter of fiscal year 2012 was 13%.
Operating income was $6.1 billion for the quarter, and diluted earnings per share was $0.59. Adjusting for the $782 million impact from the recognition of revenue related to the Office Upgrade Offer, operating income was $5.3 billion, and diluted earnings per share was $0.52. The $900 million charge for Surface RT inventory adjustments had a $0.07 negative impact to diluted earnings per share.
SEGMENT INFORMATION
Windows Division
Windows continued its transition in the evolving device market. This quarter, Microsoft saw businesses invest in the Windows platform with volume licensing revenue growing double-digits, and we estimate that the business PC market returned to modest growth. The consumer PC market remains challenged and declined again this quarter. During the quarter, both the distribution and geographic availability of the Surface RT and Surface Pro were expanded.
Windows Division revenue increased $259 million, or 6%. Adjusting for the impact of the $540 million revenue deferral in the prior year related to the Windows Upgrade Offer, Windows Division revenue declined $281 million, or 6%. Increased commercial sales of Windows were largely offset by the impact on revenue of a decline in the x86 PC market. OEM revenue increased 1%, primarily reflecting the impact of the prior year deferral of $540 million related to the Windows Upgrade Offer, largely offset by the revenue impact from the decline in the x86 PC market. Excluding the impact of the Windows Upgrade Offer, OEM revenue decreased 15%, and was approximately 65% of total Windows Division revenue.
Windows Division operating income decreased $1.3 billion, primarily due to higher cost of revenue and sales and marketing expenses, offset in part by revenue growth. Cost of revenue increased $1.2 billion primarily reflecting product costs associated with Surface and Windows 8, including the charge for Surface RT inventory adjustments of approximately $900 million. Sales and marketing expenses increased $344 million, reflecting advertising costs associated with Windows 8 and Surface.
Server and Tools
Server and Tools continued to grow against the backdrop of a soft server hardware market. Particular strength was seen in our premium versions of Windows Server and Microsoft SQL Server, as customers look to meet their comprehensive datacenter and data platform needs. Microsoft continued to invest in its infrastructure cloud offerings, and saw increased customer adoption and upsell to higher-level services. Unearned revenue for the division grew 16% year over year, reflecting the long-term commitment that companies are making to Microsoft’s products.
Server and Tools revenue increased $452 million, or 9%, primarily driven by product sales and Enterprise Services.
Product revenue increased $356 million, or 9%, driven primarily by growth in Microsoft SQL Server, System Center, and Windows Server.
Enterprise Services revenue grew $96 million, or 9%, due to growth in both Premier product support and consulting services.
Server and Tools operating income increased $285 million, or 14%, primarily due to revenue growth, offset in part by a $165 million increase in cost of revenue driven by higher datacenter costs to support our online services offerings, and increased headcount-related expenses.
Online Services Division (OSD)
OSD revenue increased $69 million, or 9%, primarily reflecting continued growth in search advertising revenue. Search revenue grew primarily due to increased revenue per search, resulting from ongoing improvements in ad products, while display advertising revenue decreased primarily due to industry-wide market pressure.
OSD operating loss decreased $6.3 billion, primarily due to the prior year goodwill impairment charge of $6.2 billion. Operating loss also decreased due to revenue growth and a $74 million decrease in cost of revenue driven by lower traffic acquisition costs.
Microsoft Business Division (MBD)
MBD revenue continued to grow, as companies added both seats and products to their long-term agreements. The productivity workload offerings of Exchange, Lync and SharePoint each experienced double digit growth this quarter, and Office 365 continued to gain traction with both businesses and consumers. Results in our consumer business were influenced by declines in the x86 PC market, and changes in the timing of revenue recognition related to a growing mix of customers on Microsoft Office 365 subscription service.
MBD revenue increased $889 million, or 14%, reflecting the recognition of $782 million of revenue previously deferred related to the Office Upgrade Offer and increased sales of Office. Excluding the impact of the Office Upgrade Offer, revenue grew $107 million, or 2%.
Business revenue increased $379 million, or 7%, which reflects 10% growth in revenue from Office subscriptions and volume licensing agreements with software assurance, and a 13% increase in Microsoft Dynamics revenue, offset in part by a 1% decrease in Office license-only revenue.
Consumer revenue increased $509 million, or 51%, reflecting the recognition of previously deferred revenue related to the Office Upgrade Offer, offset in part by the impact on revenue of a decline in the x86 PC market. Adjusting for the impact of the Office Upgrade Offer, revenue declined $273 million, or 27%.
MBD operating income increased $745 million, or 18%, primarily due to the recognition of $782 million related to the Office Upgrade Offer, offset in part by increased sales and marketing expenses. Sales and marketing expenses increased $87 million, primarily due to increased advertising and fees paid to third-party software advisors. Excluding the impact of the Office Upgrade Offer, MBD operating income declined $37 million, or 1%.
Entertainment and Devices Division (EDD)
EDD revenue increased $134 million, or 8%, primarily due to higher Windows Phone revenue, offset in part by lower Xbox 360 platform revenue.
Windows Phone revenue, reflecting patent licensing revenue and sales of Windows Phone licenses, increased $222 million.
We shipped 1.0 million Xbox 360 consoles compared to 1.1 million during the fourth quarter of fiscal year 2012.
EDD operating income increased $142 million, due mainly to higher revenue.
In June 2013, we announced that we expect our next generation console, Xbox One, will be available for purchase in the second quarter of fiscal year 2014.
Corporate-Level Activity
Corporate-level activity increased $303 million due mainly to retail stores expenses and higher intellectual property licensing costs.
COST OF REVENUE
Cost of revenue grew $1.4 billion, or 35%, primarily reflecting product costs associated with Surface and Windows 8, including the charge for Surface RT inventory adjustments of approximately $900 million, higher headcount-related expenses, and increased online infrastructure expenses, offset in part by decreased traffic acquisition costs.
OPERATING EXPENSES
Research and development expenses increased $189 million, or 7%, reflecting increased headcount-related expenses.
Sales and marketing expenses increased $447 million, or 12%, reflecting advertising of Windows 8, Surface, and the new Office.
General and administrative expenses increased $74 million, or 7%, primarily due to higher headcount-related expenses.
UNEARNED REVENUE
The following table outlines unearned revenue by segment:
|
|
|
|
|
|
|
|
| ||||||
(In millions) |
|
|
|
|
|
| ||||||||
|
| |||||||||||||
June 30, |
| 2013 |
|
| 2012 |
| ||||||||
|
|
|
|
|
|
|
|
| ||||||
Windows Division |
| $ | 2,086 |
|
| $ | 2,444 |
| ||||||
Server and Tools |
|
| 8,639 |
|
|
| 7,445 |
| ||||||
Microsoft Business Division |
|
| 10,142 |
|
|
| 9,015 |
| ||||||
Other segments |
|
| 1,532 |
|
|
| 1,155 |
| ||||||
|
|
|
|
| ||||||||||
Total |
| $ | 22,399 |
|
| $ | 20,059 |
| ||||||
|
| |
|
| |
| ||||||||
Windows Division unearned revenue at June 30, 2012 includes $540 million related to the Windows Upgrade Offer.
Adjusted Financial Results and Non-GAAP Measures
For the fourth quarter fiscal year 2013, GAAP revenue, operating income, and diluted earnings per share included the recognition of previously deferred revenue for the Office Upgrade Offer. For Microsoft’s fiscal year 2013, the financial results included the recognition of previously deferred revenue related to the Windows Upgrade Offer as well as the European Commission fine. These items are defined below in the Non-GAAP Reconciliations for the period ended June 30, 2013. In addition to these financial results reported in accordance with GAAP, we have provided certain non-GAAP financial information to aid investors in better understanding the company’s performance. Presenting these measures without the impact of these items gives additional insight into operational performance and helps clarify trends affecting the company’s business. For comparability of reporting, management considers this information in conjunction with GAAP amounts in evaluating business performance. These non-GAAP financial measures should not be considered as a substitute for, or superior to, the measures of financial performance prepared in accordance with GAAP.
Non-GAAP Reconciliations
Revenue, Operating Income and EPS
| Three Months Ended June 30, | Percentage Change | ||||||
(In millions, except per share amounts and percentages) | Revenue | Operating income | Diluted EPS | Revenue | Operating income | Diluted EPS | ||
2012 As reported (GAAP) | $18,059 | $192 | ($0.06) | | | | ||
Goodwill impairment | | $6,193 | $0.73 | | | | ||
Windows Upgrade Offer | $540 | $540 | $0.06 | | | | ||
2012 As adjusted (non-GAAP) | $18,599 | $6,925 | $0.73 | | | | ||
2013 As reported (GAAP) | $19,896 | $6,073 | $0.59 | 10% | * | * | ||
Office Upgrade Offer | ($782) | ($782) | ($0.07) | | | | ||
2013 As adjusted (non-GAAP) | $19,114 | $5,291 | $0.52 | 3% | (24)% | (29)% | ||
*Not meaningful
Windows Division
| Three Months Ended June 30, | Twelve Months Ended June 30, | ||||||
(In millions, except percentages) | 2013 | 2012 | % Y/Y | 2013 | 2012 | % Y/Y | ||
As reported revenue (GAAP) | $4,411 | $4,152 | 6% | $19,239 | $18,400 | 5% | ||
Windows Upgrade Offer | | $540 | | ($540) | $540 | | ||
As adjusted revenue (non-GAAP) | $4,411 | $4,692 | (6)% | $18,699 | $18,940 | (1)% | ||
Windows Division OEM Revenue
| Three Months Ended June 30, | |||
(In millions, except percentages) | 2013 | 2012 | % Y/Y | |
As reported OEM revenue (GAAP) | $2,967 | $2,943 | 1% | |
Windows Upgrade Offer | | $540 | | |
As adjusted OEM revenue (non-GAAP) | $2,967 | $3,483 | (15)% | |
Windows Division Operating Income
| Three Months Ended June 30, | |||
(In millions, except percentages) | 2013 | 2012 | % Y/Y | |
As reported operating income (GAAP) | $1,099 | $2,422 | (55)% | |
Windows Upgrade Offer | | $540 | | |
As adjusted operating income (non-GAAP) | $1,099 | $2,962 | (63)% | |
Microsoft Business Division
| Three Months Ended June 30, | |||
(In millions, except percentages) | 2013 | 2012 | % Y/Y | |
As reported revenue (GAAP) | $7,213 | $6,324 | 14% | |
Office Upgrade Offer | ($782) | | | |
As adjusted revenue (non-GAAP) | $6,431 | $6,324 | 2% | |
Microsoft Business Division Consumer Revenue
| Three Months Ended June 30, | |||
(In millions, except percentages) | 2013 | 2012 | % Y/Y | |
As reported revenue (GAAP) | $1,504 | $995 | 51% | |
Office Upgrade Offer | ($782) | | | |
As adjusted revenue (non-GAAP) | $722 | $995 | (27)% | |
Microsoft Business Division Operating Income
| Three Months Ended June 30, | |||
(In millions, except percentages) | 2013 | 2012 | % Y/Y | |
As reported operating income (GAAP) | $4,873 | $4,128 | 18% | |
Office Upgrade Offer | ($782) | | | |
As adjusted operating income (non-GAAP) | $4,091 | $4,128 | (1)% | |
Non-GAAP Definitions
Windows 7 revenue was subject to deferral as a result of the Windows Upgrade Offer, which started June 2, 2012. The offer provided significantly discounted rights to purchase Windows 8 Pro to qualifying end-users that purchased Windows 7 PCs during the eligibility period. Microsoft was responsible for delivering Windows 8 Pro to the end customer. Accordingly, revenue related to the allocated discount for undelivered Windows 8 was deferred until it was delivered or the redemption period expired.
Microsoft Office system revenue was subject to deferral as a result of the Office Upgrade Offer, which started October 19, 2012. The Office Upgrade Offer allowed customers who purchased qualifying 2010 Microsoft Office system or Office for Mac 2011 products to receive, at no cost, a one-year subscription to Office 365 Home Premium or the equivalent version of 2013 Microsoft Office system upon general availability. Small business customers in applicable markets were also eligible for a three-month trial of Office 365 Small Business Premium. Accordingly, estimated revenue related to the undelivered 2013 Microsoft Office system and subscription services was deferred until the products and services were delivered or the redemption period expired.
Related Articles
- Microsoft Surface Pro celebrates fifth anniversary News @ 02/16/2018
- Microsoft Surface 2 and Surface Pro 2 to be announced on September 23 News @ 09/09/2013
- Rumors point to new accessories for Microsoft's Surface tablets News @ 09/07/2013
- Steve Ballmer plans to retire as Microsoft CEO News @ 08/24/2013
- Microsoft offers $100 discount on Surface Pro tablets News @ 08/04/2013
- Microsoft reported to be working on its own smartwatch News @ 07/15/2013
- New Surface tablets coming in 2014 News @ 07/11/2013
- Microsoft's Surface Pro with 256 GB of storage is coming to the USA News @ 07/02/2013
- Microsoft launches Windows 8.1 preview News @ 06/26/2013