Notebookcheck Logo

Apple M3 Max 30-Core GPU vs Apple M3 Pro 14-Core GPU

Apple M3 Max 30-Core GPU

► remove from comparison Apple M3 Max 30-Core GPU

The Apple M3 Max 30-Core GPU is a self-designed graphics card in the Apple M3 SoC and offers 30 of the 40 cores that are included in the chip. According to Apple, the GPU uses a new architecture and now offers dynamic caching, mesh shading and ray tracing acceleration.

The graphics card can access up to 96 GB LPDDR5-6400 unified memory via a 512 bit memory bus (max 400 GBit/s). Thanks to dynamic caching, the GPU only reserves as much memory as is required.

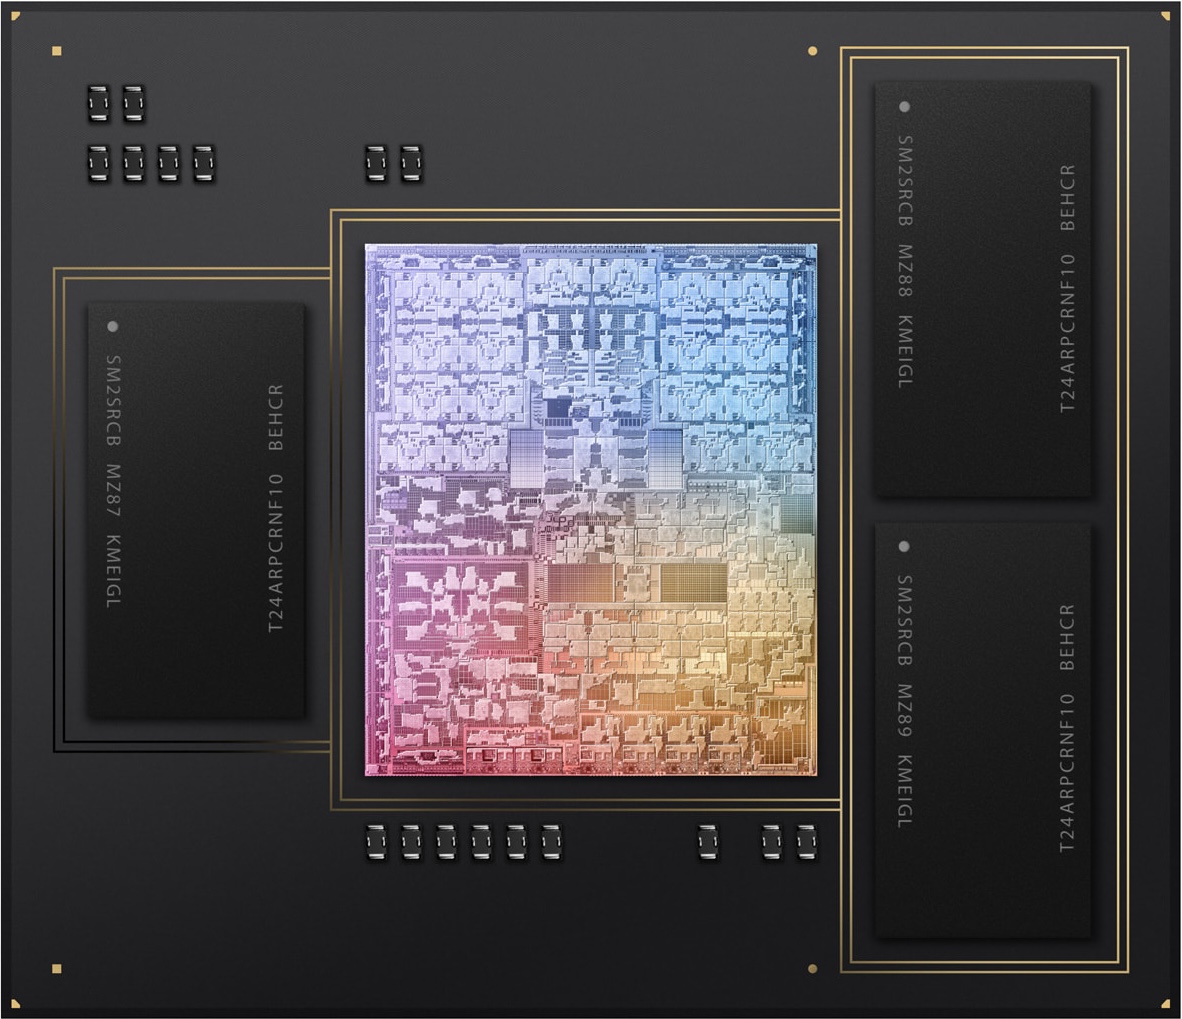
Since the SoC is manufactured in the current 3nm (probably N3B) at TSMC.

Apple M3 Pro 14-Core GPU

► remove from comparison Apple M3 Pro 14-Core GPU

The Apple M3 Pro 14-Core GPU is a self-designed graphics card in the Apple M3 Pro (with 11 CPU cores) and offers fourteen of the eighteen cores available on the chip. The graphics card uses a new architecture and now offers dynamic caching, mesh shading and ray tracing acceleration.

The GPU can access up to 24 GB LPDDR5-6400 unified memory via a 192-bit memory bus (max 150 GBit/s). Thanks to dynamic caching, the GPU only reserves as much memory as is required.

The entire chip is manufactured in the current 3nm process (probably N3B) at TSMC.

Apple M3 Max 30-Core GPUApple M3 Pro 14-Core GPU
Apple M3 Series
M3 Max 40-Core GPU compare 40
M3 Max 30-Core GPU 30
M3 Pro 18-Core GPU compare 18
M3 Pro 14-Core GPU 14
M3 10-Core GPU compare 10
M3 8-Core GPU compare 8
M3 Max 40-Core GPU compare 40
M3 Max 30-Core GPU 30
M3 Pro 18-Core GPU compare 18
M3 Pro 14-Core GPU 14
M3 10-Core GPU compare 10
M3 8-Core GPU compare 8
Pipelines30 - unified14 - unified
Memory TypeLPDDR5-6400LPDDR5-6400
Shared Memorynono
Power Consumption53 Watt
technology5 nm5 nm
Notebook Sizemedium sizedmedium sized
Date of Announcement31.10.2023 31.10.2023
CPU in M3 Max 30-Core GPUGPU Base SpeedGPU Boost / Turbo
Apple M3 Max 14-Core14 x 2748 MHz, 78 W? MHz? MHz
CPU in M3 Pro 14-Core GPUGPU Base SpeedGPU Boost / Turbo
Apple M3 Pro 11-Core11 x 2748 MHz, 27 W? MHz? MHz

Benchmarks

3DMark - 3DMark Wild Life Extreme Unlimited
12094 Points (14%)
Blender - Blender 3.3 Classroom METAL *
73 Seconds (8%)
Cinebench R15
Cinebench R15 OpenGL 64 Bit + Apple M3 Pro 14-Core GPU
Cinebench R15 - Cinebench R15 OpenGL 64 Bit
129.9 fps (8%)
Cinebench R15 OpenGL Ref. Match 64 Bit + Apple M3 Pro 14-Core GPU
Cinebench R15 - Cinebench R15 OpenGL Ref. Match 64 Bit
99.5 % (100%)
GFXBench - GFXBench 5.0 4K Aztec Ruins High Tier Offscreen
79 fps (32%)
GFXBench - GFXBench 5.0 Aztec Ruins High Tier Offscreen
178.7 fps (32%)
GFXBench - GFXBench 5.0 Aztec Ruins Normal Tier Offscreen
481.9 fps (36%)
GFXBench - GFXBench Car Chase Offscreen
376.3 fps (42%)
GFXBench 3.1 - GFXBench Manhattan ES 3.1 Offscreen
565 fps (12%)
GFXBench 3.0 - GFXBench 3.0 Manhattan Offscreen
818 fps (48%)
GFXBench (DX / GLBenchmark) 2.7
GFXBench T-Rex HD Offscreen C24Z16 + Apple M3 Pro 14-Core GPU
GFXBench (DX / GLBenchmark) 2.7 - GFXBench T-Rex HD Offscreen C24Z16
1299 fps (10%)
Geekbench 6.2 - Geekbench 6.2 GPU OpenCL
42798 Points (12%)
Geekbench 6.2 - Geekbench 6.2 GPU Metal
68043 Points (44%)
Power Consumption - The Witcher 3 Power Consumption - external Monitor *
32.8 Watt (5%)
Power Consumption - Witcher 3 Power Consumption *
42.8 Watt (9%)
Power Consumption - Witcher 3 ultra Power Efficiency
0.9 fps per Watt (86%)
Power Consumption - Witcher 3 ultra Power Efficiency - external Monitor
min: 1.189     avg: 1.2     median: 1.2 (99%)     max: 1.207 fps per Watt
Emissions Witcher 3 Fan Noise + Apple M3 Pro 14-Core GPU
Emissions - Witcher 3 Fan Noise
25.1 dB(A) (40%)

Average Benchmarks Apple M3 Pro 14-Core GPU → 0% n=

- Range of benchmark values for this graphics card
- Average benchmark values for this graphics card
* Smaller numbers mean a higher performance
1 This benchmark is not used for the average calculation

Game Benchmarks

The following benchmarks stem from our benchmarks of review laptops. The performance depends on the used graphics memory, clock rate, processor, system settings, drivers, and operating systems. So the results don't have to be representative for all laptops with this GPU. For detailed information on the benchmark results, click on the fps number.

Total War Pharaoh

Total War Pharaoh

2023
low 1920x1080
M3 Pro 14-Core GPU:
193  fps
med. 1920x1080
M3 Pro 14-Core GPU:
125  fps
high 1920x1080
M3 Pro 14-Core GPU:
67  fps
ultra 1920x1080
M3 Pro 14-Core GPU:
53  fps
QHD 2560x1440
M3 Pro 14-Core GPU:
35  fps
high 1920x1080
M3 Pro 14-Core GPU:
42  fps
ultra 1920x1080
M3 Pro 14-Core GPU:
39  fps
med. 1920x1080
M3 Pro 14-Core GPU:
75  fps
high 1920x1080
M3 Pro 14-Core GPU:
49.5  fps
ultra 1920x1080
M3 Pro 14-Core GPU:
35.9  fps
QHD 2560x1440
M3 Pro 14-Core GPU:
22.5  fps
med. 1920x1080
M3 Pro 14-Core GPU:
66  fps
high 1920x1080
M3 Pro 14-Core GPU:
60  fps
ultra 1920x1080
M3 Pro 14-Core GPU:
53  fps
QHD 2560x1440
M3 Pro 14-Core GPU:
34  fps
ultra 1920x1080
M3 Pro 14-Core GPU:
39  fps
GTA V

GTA V

2015
high 1920x1080
M3 Pro 14-Core GPU:
79  fps
ultra 1920x1080
M3 Pro 14-Core GPU:
50  fps
Apple M3 Pro 14-Core GPUlowmed.highultraQHD4K
Total War Pharaoh193125675335
Baldur's Gate 34239
Total War: Three Kingdoms7549.535.922.5
Shadow of the Tomb Raider66605334
The Witcher 339
GTA V7950
< 30 fps
< 60 fps
< 120 fps
≥ 120 fps


1


2
1

2
3

6

1
2


For more games that might be playable and a list of all games and graphics cards visit our Gaming List

Add one or more devices and compare

In the following list you can select (and also search for) devices that should be added to the comparison. You can select more than one device.

restrict list:

show all (including archived), 2024, 2023
v1.26
log 09. 18:46:08

#0 checking url part for id 12034 +0s ... 0s

#1 checking url part for id 12032 +0s ... 0s

#2 not redirecting to Ajax server +0s ... 0s

#3 did not recreate cache, as it is less than 5 days old! Created at Tue, 07 May 2024 05:40:33 +0200 +0.001s ... 0.001s

#4 composed specs +0.087s ... 0.088s

#5 did output specs +0s ... 0.088s

#6 start showIntegratedCPUs +0s ... 0.088s

#7 getting avg benchmarks for device 12034 +0.025s ... 0.113s

#8 got single benchmarks 12034 +0s ... 0.113s

#9 getting avg benchmarks for device 12032 +0.001s ... 0.115s

#10 got single benchmarks 12032 +0.007s ... 0.122s

#11 got avg benchmarks for devices +0s ... 0.122s

#12 min, max, avg, median took s +0.037s ... 0.159s

#13 before gaming benchmark output +0s ... 0.159s

#14 Got 18 rows for game benchmarks. +0.004s ... 0.163s

#15 composed SQL query for gamebenchmarks +0s ... 0.163s

#16 got data and put it in $dataArray +0.004s ... 0.167s

#17 benchmarks composed for output. +0.014s ... 0.181s

#18 calculated avg scores. +0s ... 0.181s

#19 return log +0.037s ... 0.218s

Please share our article, every link counts!
> Expert Reviews and News on Laptops, Smartphones and Tech Innovations > Benchmarks / Tech > Graphics Card Comparison - Head 2 Head
Redaktion, 2017-09- 8 (Update: 2023-07- 1)