Notebookcheck Logo

Intel Atom D525 vs Intel Atom N435 vs Rockchip RK3188

Intel Atom D525

► remove from comparison

The Intel Atom D525 is a dual core processor that is intended for nettops, but also used in netbooks (like the Asus Eee PC 1215N). It consists out of two Atom cores clocked at 1.8 GHz and due to HyperThreading, the D525 is able to process four threads at a time. The D525 misses Speedstep and is therefore running at 1.8 GHz all the time (and using a lot more power than other Atoms without load).

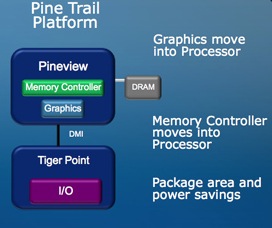
In the processor package, the Atom D525 has an integrated DDR2/DDR3 memory controller and the GMA 3150 called graphics card.

The performance of the D525 can be on a level of slow clocked single core CPUs like the Intel SU2700 or AMD K125 if both cores are used. In single threaded applications, the performance is clearly worse and only on the level of a 1.8 GHz Atom CPU.

Intel Atom N435

► remove from comparison Intel N435

The Intel Atom N435 is a small and cheap entry level CPU for Netbooks and small laptops. In the package is an integrated memory controller for DDR2/DDR3 main memory and the GMA 3150 graphics card

The performance of the whole system (Atom N435 and integrated GMA 3150) is only sufficient for basic tasks like surfing the web, or office working. HD video, video cutting, advanced photo editing, multitasking and of course gaming may overstrain the GPU and CPU. Compared to the previous Atom generation, the performance of the CPU is on a level with the slow Atom Z520.

An advantage of the interation, is the small overall power consumption of the CPU, GPU and memory controller (only 5 Watt TDP). Therefore, the chip is ideally used in small Netbooks and thin laptops.

Rockchip RK3188

► remove from comparison

The Rockchip RK3188 is a fast ARM SoC primarily designed for tablets. It integrates four ARM Cortex A9 cores with NEON extension and a clock speed of up to 1.8 GHz, a Mali-400 MP4 graphics card (up to 600 MHz, 24 GFLOPS) and a low-power (LP-)DDR2/DDR3 memory controller. Due to the high clock rates, the performance of the CPU and GPU is superior to other Cortex-A9 quad-cores such as the Nvidia Tegra 3 and Samsung Exynos 4412. These high frequencies are possible due to the 28nm process (TSMC). However, this results in high power consumption and is thus not suited for compact smartphones.

ModelIntel Atom D525Intel Atom N435Rockchip RK3188
SeriesIntel AtomIntel Atom
CodenamePinetrailPinetrailCortex-A9
Series: Cortex-A9
Intel Atom D525 « 1.8 GHz2 / 4 cores
Intel Atom N4551.66 GHz1 / 2 cores
Intel Atom N4501.66 GHz1 / 2 cores
Intel Atom N4351.33 GHz1 / 2 cores
Intel Atom D5251.8 GHz2 / 4 cores
Intel Atom N4551.66 GHz1 / 2 cores
Intel Atom N4501.66 GHz1 / 2 cores
Intel Atom N435 « 1.33 GHz1 / 2 cores
HiSilicon Kirin 910T1.8 GHz4 / 4 cores Cortex-A9
Rockchip RK3188 « 1.8 GHz4 / 4 cores Cortex-A9
HiSilicon Kirin 9101.6 GHz4 / 4 cores Cortex-A9
Renesas MP52321.5 GHz2 / 2 cores Cortex-A9
Broadcom BCM21664T1.2 GHz2 / 2 cores Cortex-A9
Marvell PXA9861.2 GHz2 / 2 cores Cortex-A9
NXP i.MX 6SLL1 GHz1 / 1 cores Cortex-A9
WonderMedia PRIZM WM89501 GHz1 / 1 cores Cortex-A9
Clock1800 MHz1333 MHz1800 MHz
L1 Cache112 KB
L2 Cache1 MB512 KB
Cores / Threads2 / 41 / 24 / 4
TDP18 Watt5 Watt
Transistors176 Million
Technology45 nm, 0.8-1.175V45 nm28 nm
Die Size87 mm2
max. Temp.100 °C
Socket559 FCBGA8FCBGA559
FeaturesIntegrated DDR2/DDR3 memory controller, on chip GMA 3150 graphics card, MMX, SSE, SSE2, SSE3, Sup SSE3, EM64T, Hyper-Threading, Execute Disable Bitintegrated DDR2/DDR3 memory controller, integrated GMA 3150 GPU, HyperthreadingMali-400 MP4 (600 MHz), DDR2/DDR3 Memory Controller (max. 2 GByte)
Architecturex86x86ARM
$63 U.S.
Announced
Manufacturerark.intel.comwww.rock-chips.com
FSB533
iGPUARM Mali-400 MP4 (600 MHz)

Benchmarks

Cinebench R11.5 - Cinebench R11.5 CPU Multi 64 Bit
100%
1 D525 +
0.6 Points (1%)
Cinebench R10 - Cinebench R10 Rend. Single (32bit)
100%
1 D525 +
min: 585     avg: 610     median: 609.5 (4%)     max: 634 Points
Cinebench R10 - Cinebench R10 Rend. Multi (32bit)
100%
1 D525 +
min: 1308     avg: 1596     median: 1707 (1%)     max: 1773 Points
wPrime 2.10 - wPrime 2.0 1024m *
100%
1 D525 +
min: 1692     avg: 1714     median: 1714 (20%)     max: 1736 s
wPrime 2.10 - wPrime 2.0 32m *
100%
1 D525 +
min: 54     avg: 55.3     median: 55.3 (11%)     max: 56.5 s
3DMark 06 - CPU - 3DMark 06 - CPU
100%
1 D525 +
min: 816     avg: 891     median: 891 (2%)     max: 966 Points
Super Pi mod 1.5 XS 1M - Super Pi mod 1.5 XS 1M *
100%
1 D525 +
min: 80     avg: 83.3     median: 82 (18%)     max: 88 s
Super Pi mod 1.5 XS 2M - Super Pi mod 1.5 XS 2M *
100%
1 D525 +
min: 184     avg: 188     median: 188 (8%)     max: 192 s
Super Pi Mod 1.5 XS 32M - Super Pi mod 1.5 XS 32M *
100%
1 D525 +
min: 3925     avg: 3991     median: 3991 (18%)     max: 4057 s
SiSoft Sandra Dhrystone (MIPS) - SiSoft Sandra Dhrystone (MIPS)
100%
1 D525 +
min: 8800     avg: 8964     median: 8964 (4%)     max: 9128 MIPS
SiSoft Sandra Whetstone (MFLOPS) - SiSoft Sandra Whetstone (MFLOPS)
100%
1 D525 +
min: 7580     avg: 7599     median: 7599 (6%)     max: 7618 MFLOPS
PCMark 05 - PCMark 05 - Standard
2292 Points (5%)
Windows 7 Experience Index - Win7 CPU
100%
1 D525 +
3.5 Points (45%)
3DMark Vantage - 3DM Vant. Perf. CPU no Physx
100%
1 D525 +
1915 Points (2%)
3DMark - 3DMark Ice Storm Physics
100%
1 RK3188 +
min: 5828     avg: 7773     median: 7936 (6%)     max: 8887 Points
3DMark - 3DMark Ice Storm Extreme Physics
100%
1 RK3188 +
min: 5434     avg: 7724     median: 8025.5 (7%)     max: 8812 Points
3DMark - 3DMark Ice Storm Unlimited Physics
100%
1 RK3188 +
min: 9142     avg: 9821     median: 9821 (8%)     max: 10500 Points
Geekbench 3 - Geekbench 3 32 Bit Multi-Core
100%
1 RK3188 +
min: 1316     avg: 1410     median: 1421 (3%)     max: 1493 Points
Geekbench 3 - Geekbench 3 32 Bit Single-Core
100%
1 RK3188 +
min: 476     avg: 498.7     median: 504 (10%)     max: 516 Points
Geekbench 2 - 32 Bit - Geekbench Stream
100%
1 RK3188 +
min: 182     avg: 320     median: 272 (2%)     max: 506 Points
Geekbench 2 - 32 Bit - Geekbench Memory
100%
1 RK3188 +
min: 326     avg: 687     median: 803 (7%)     max: 933 Points
Geekbench 2 - 32 Bit - Geekbench Floating Point
100%
1 RK3188 +
min: 1769     avg: 2044     median: 2035 (4%)     max: 2328 Points
Geekbench 2 - 32 Bit - Geekbench Integer
100%
1 RK3188 +
min: 924     avg: 1123     median: 1104 (2%)     max: 1341 Points
Geekbench 2 - 32 Bit - Geekbench Total Score
100%
1 RK3188 +
min: 1130     avg: 1275     median: 1182 (3%)     max: 1512 Points
Linpack Android / IOS - Linpack Multi Thread
100%
1 RK3188 +
min: 130     avg: 131.1     median: 131.1 (4%)     max: 132.1 MFLOPS
Linpack Android / IOS - Linpack Single Thread
100%
1 RK3188 +
min: 54.9     avg: 57.2     median: 57.2 (6%)     max: 59.4 MFLOPS
Mozilla Kraken 1.1 - Kraken 1.1 Total Score *
100%
1 RK3188 +
13698 ms (16%)
Sunspider - Sunspider 1.0 Total Score *
100%
1 RK3188 +
min: 849     avg: 1179     median: 1240 (14%)     max: 1388 ms
Sunspider - Sunspider 0.9.1 Total Score *
100%
1 RK3188 +
min: 702     avg: 986     median: 1086 (10%)     max: 1170 ms
Octane V2 - Octane V2 Total Score
100%
1 RK3188 +
min: 3092     avg: 3094     median: 3093.5 (3%)     max: 3095 Points
Quadrant Standard Edition 2.0 - Quadrant Standard 2.0 Total Score
100%
1 RK3188 +
5287 points (12%)
AnTuTu v3 - AnTuTu v3 CPU
100%
1 RK3188 +
min: 7505     avg: 7723     median: 7807 (51%)     max: 7856 Points
AnTuTu v4 - AnTuTu v4 Total Score
100%
1 RK3188 +
min: 2139     avg: 14154     median: 19571 (46%)     max: 20752 Points
AndEBench - AndEBench Java
100%
1 RK3188 +
min: 179     avg: 329     median: 374 (11%)     max: 434 Iter./s
AndEBench - AndEBench Native
100%
1 RK3188 +
min: 10329     avg: 11213     median: 11588 (38%)     max: 11722 Iter./s
PassMark PerformanceTest Mobile V1 - PerformanceTest Mobile V1 CPU Tests
100%
1 RK3188 +
min: 9258     avg: 10743     median: 10965 (1%)     max: 11782 Points

Average Benchmarks Intel Atom D525 → 0% n=

Average Benchmarks Rockchip RK3188 → 0% n=

- Range of benchmark values for this graphics card
- Average benchmark values for this graphics card
* Smaller numbers mean a higher performance
1 This benchmark is not used for the average calculation

v1.26
log 26. 12:30:15

#0 checking url part for id 1149 +0s ... 0s

#1 checking url part for id 2692 +0s ... 0s

#2 checking url part for id 4137 +0s ... 0s

#3 not redirecting to Ajax server +0s ... 0s

#4 did not recreate cache, as it is less than 5 days old! Created at Thu, 25 Apr 2024 05:38:32 +0200 +0.001s ... 0.001s

#5 composed specs +0.081s ... 0.082s

#6 did output specs +0s ... 0.082s

#7 getting avg benchmarks for device 1149 +0.003s ... 0.085s

#8 got single benchmarks 1149 +0.012s ... 0.097s

#9 getting avg benchmarks for device 2692 +0.002s ... 0.099s

#10 got single benchmarks 2692 +0.007s ... 0.106s

#11 getting avg benchmarks for device 4137 +0.003s ... 0.108s

#12 got single benchmarks 4137 +0.022s ... 0.13s

#13 got avg benchmarks for devices +0s ... 0.13s

#14 No cached benchmark found, getting uncached values +0.035s ... 0.165s

#15 min, max, avg, median took s +0.054s ... 0.219s

#16 return log +0s ... 0.219s

Please share our article, every link counts!
> Expert Reviews and News on Laptops, Smartphones and Tech Innovations > Benchmarks / Tech > Processor Comparison - Head 2 Head
Redaktion, 2017-09- 8 (Update: 2023-07- 1)