Notebookcheck Logo

Apple A5x vs Samsung Exynos 4412 Quad vs Samsung Exynos 4212 1.5 GHz

Apple A5x

► remove from comparison

The Apple A5x is a dual-core processor that contains two Cortex A9 cores. The A5x integrates a relative fast Quad-Core PowerVR SGX 543MP4 graphics card and is used in the third generation iPad with Retina Display.

Samsung Exynos 4412 Quad

► remove from comparison Samsung 4412 Quad

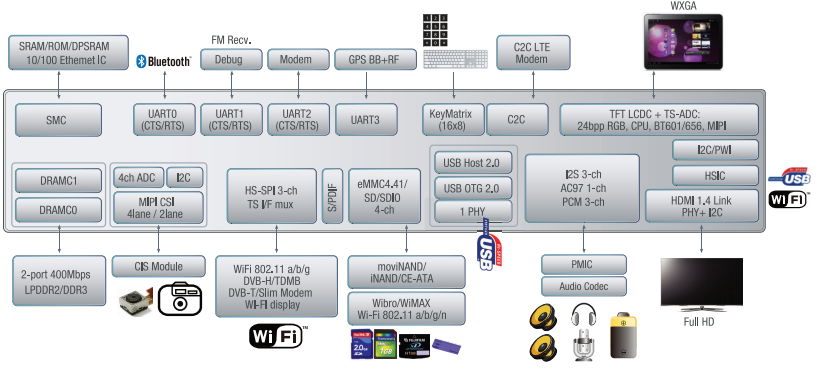
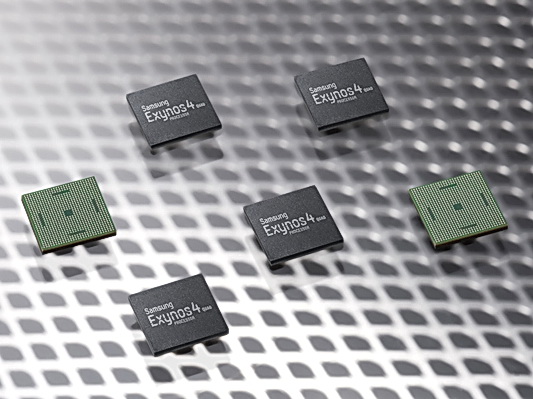
The Samsung Exynos 4 Quad (also called Exynos 4412, introduced in 2012) is an ARM SoC for tablets and smartphones. It includes a quad-core processor based on the Cortex-A9 architecture (including NEON SIMD extension), which clocks with 1.4 to 1.6 GHz (depending on the model). Thus, the computing power is similar to competitors like Nvidia's Tegra 3 SoC. The memory controller supports LPDDR2, DDR2 and DDR3 with a maximum of two 32-bit channels and 400 MHz clock speed, resulting in a bandwidth of up to 6.4 GB/s.

The SoC integrates an ARM Mali-400 MP4 GPU (15.8 GFLOPS at 440 MHz). Typical smartphone games (2012) will run fluently even in high resolutions like 1280 x 720 pixels. Videos can be accelerated by a multi-format video decoder (1080p AVI, WMV, H.264, H.263, VC1, MPEG2, MPEG4).

The chip is produced in Samsung fabs in 32nm HKMG and mainly found in high-end devices like the Samsung Galaxy S3 or Note 2. Depending on the clock speed, the power consumption should be between 2 and 4 W (estimated).

Samsung Exynos 4212 1.5 GHz

► remove from comparison Samsung 4212 1.5 GHz

The Samsung Exynos 4 Dual (formerly known as Exynos 4210) is a dual-core Cortex-A9 based SoC with a ARM Mali-400 MP4 graphics card.

ModelApple A5xSamsung Exynos 4412 QuadSamsung Exynos 4212 1.5 GHz
SeriesApple Samsung ExynosSamsung Exynos
CodenameCortex A9Cortex A9Cortex A9
Series: Exynos Cortex A9
Texas Instruments OMAP 44701.5 GHz2 / 2 cores Cortex A9
Texas Instruments OMAP 44601.2 GHz2 / 2 cores Cortex A9
Broadcom BCM281551.2 GHz2 / 2 cores Cortex A9
Texas Instruments OMAP 44301 GHz2 / 2 cores Cortex A9
Apple A5x « 1 GHzcores Cortex A9
Apple A51 GHzcores Cortex A9
Samsung Exynos 4412 Quad « 1.4 GHz4 / 4 cores Cortex A9
Samsung Exynos 4212 1.5 GHz1.5 GHz2 / 2 cores Cortex A9
Samsung Exynos 4210 1.4 GHz1.4 GHz2 / 2 cores Cortex A9
Samsung Exynos 4210 1.2 GHz1.2 GHz2 / 2 cores Cortex A9
Samsung Exynos 4412 Quad1.4 GHz4 / 4 cores Cortex A9
Samsung Exynos 4212 1.5 GHz « 1.5 GHz2 / 2 cores Cortex A9
Samsung Exynos 4210 1.4 GHz1.4 GHz2 / 2 cores Cortex A9
Samsung Exynos 4210 1.2 GHz1.2 GHz2 / 2 cores Cortex A9
Clock1000 MHz1400 - 1600 MHz1500 MHz
Cores / Threads24 / 42 / 2
Technology32? nm32 nm32 nm
ArchitectureARMARMARM
Announced
FeaturesNEON, Mali 400MP4, Memory ControllerNEON, Mali 400MP, Memory Controller
Manufacturerwww.samsung.com
L1 Cache128 KB
L2 Cache1 MB

Benchmarks

3DMark - 3DMark Ice Storm Physics
100%
A5x +
2858 Points (2%)
min: 8282     avg: 9127     median: 9127 (7%)     max: 9972 Points
min: 5055     avg: 5067     median: 5067 (4%)     max: 5079 Points
3DMark - 3DMark Ice Storm Extreme Physics
100%
1 A5x +
2865 Points (2%)
5262 Points (4%)
Geekbench 4.0 - Geekbench 4.0 64 Bit Single-Core
100%
1 A5x +
330 Points (4%)
Geekbench 4.0 - Geekbench 4.0 64 Bit Multi-Core
100%
1 A5x +
566 Points (1%)
Geekbench 3 - Geekbench 3 32 Bit Multi-Core
100%
1 A5x +
496 Points (1%)
Geekbench 3 - Geekbench 3 32 Bit Single-Core
100%
1 A5x +
262 Points (5%)
Geekbench 2 - 32 Bit - Geekbench Stream
100%
A5x +
333 Points (3%)
min: 613     avg: 693     median: 698 (6%)     max: 795 Points
min: 366     avg: 378.5     median: 378.5 (3%)     max: 391 Points
Geekbench 2 - 32 Bit - Geekbench Memory
100%
A5x +
818 Points (7%)
min: 783     avg: 1234     median: 1282 (12%)     max: 1646 Points
min: 1059     avg: 1091     median: 1091 (10%)     max: 1123 Points
Geekbench 2 - 32 Bit - Geekbench Floating Point
100%
A5x +
920 Points (2%)
min: 2661     avg: 2896     median: 2911.5 (6%)     max: 3171 Points
min: 1791     avg: 1792     median: 1791.5 (4%)     max: 1792 Points
Geekbench 2 - 32 Bit - Geekbench Integer
100%
A5x +
687 Points (1%)
min: 1537     avg: 1675     median: 1656.5 (3%)     max: 1816 Points
min: 1027     avg: 1049     median: 1049 (2%)     max: 1071 Points
Geekbench 2 - 32 Bit - Geekbench Total Score
100%
A5x +
759 Points (2%)
min: 1804     avg: 1915     median: 1886.5 (5%)     max: 2146 Points
min: 1231     avg: 1241     median: 1240.5 (3%)     max: 1250 Points
Linpack Android / IOS - Linpack Multi Thread
100%
A5x +
142 MFLOPS (5%)
min: 69.8     avg: 148.8     median: 162.8 (6%)     max: 202.1 MFLOPS
min: 91.1     avg: 93.5     median: 93.5 (3%)     max: 95.9 MFLOPS
Linpack Android / IOS - Linpack Single Thread
100%
A5x +
87.8 MFLOPS (9%)
min: 53.2     avg: 58.4     median: 56.3 (6%)     max: 66.9 MFLOPS
min: 56.4     avg: 57.4     median: 57.4 (6%)     max: 58.3 MFLOPS
Mozilla Kraken 1.1 - Kraken 1.1 Total Score *
100%
1 A5x +
31272 ms (37%)
Sunspider - Sunspider 1.0 Total Score *
100%
A5x +
1307 ms (14%)
1109 ms (12%)
min: 999     avg: 1128     median: 1128 (12%)     max: 1257 ms
Sunspider - Sunspider 0.9.1 Total Score *
100%
A5x +
min: 1329     avg: 1595     median: 1594.5 (15%)     max: 1860 ms
min: 1027     avg: 1304     median: 1353 (13%)     max: 1574 ms
917 ms (9%)
Quadrant Standard Edition 2.0 - Quadrant Standard 2.0 Total Score
min: 4918     avg: 5460     median: 5357 (12%)     max: 6207 points
min: 4616     avg: 4822     median: 4821.5 (11%)     max: 5027 points
AnTuTu v3 - AnTuTu v3 CPU
min: 4282     avg: 6753     median: 7142.5 (46%)     max: 7770 Points
3564 Points (23%)
AndEBench - AndEBench Java
289 Iter./s (9%)
min: 244     avg: 247.5     median: 247.5 (8%)     max: 251 Iter./s
AndEBench - AndEBench Native
10134 Iter./s (33%)
min: 5107     avg: 5237     median: 5236.5 (17%)     max: 5366 Iter./s
PassMark PerformanceTest Mobile V1 - PerformanceTest Mobile V1 CPU Tests
100%
A5x +
11087 Points (1%)
10466 Points (1%)
min: 4603     avg: 4815     median: 4814.5 (1%)     max: 5026 Points

Average Benchmarks Apple A5x → 100% n=11

Average Benchmarks Samsung Exynos 4412 Quad → 179% n=11

Average Benchmarks Samsung Exynos 4212 1.5 GHz → 120% n=11

- Range of benchmark values for this graphics card
- Average benchmark values for this graphics card
* Smaller numbers mean a higher performance
1 This benchmark is not used for the average calculation

v1.26
log 01. 22:26:55

#0 checking url part for id 3094 +0s ... 0s

#1 checking url part for id 3331 +0s ... 0s

#2 checking url part for id 4458 +0s ... 0s

#3 not redirecting to Ajax server +0s ... 0s

#4 did not recreate cache, as it is less than 5 days old! Created at Wed, 01 May 2024 05:34:47 +0200 +0.001s ... 0.001s

#5 composed specs +0.043s ... 0.044s

#6 did output specs +0s ... 0.044s

#7 getting avg benchmarks for device 3094 +0.003s ... 0.047s

#8 got single benchmarks 3094 +0.008s ... 0.055s

#9 getting avg benchmarks for device 3331 +0.003s ... 0.058s

#10 got single benchmarks 3331 +0.015s ... 0.073s

#11 getting avg benchmarks for device 4458 +0.002s ... 0.075s

#12 got single benchmarks 4458 +0.007s ... 0.082s

#13 got avg benchmarks for devices +0s ... 0.082s

#14 min, max, avg, median took s +0.111s ... 0.193s

#15 return log +0s ... 0.193s

Please share our article, every link counts!
> Expert Reviews and News on Laptops, Smartphones and Tech Innovations > Benchmarks / Tech > Processor Comparison - Head 2 Head
Redaktion, 2017-09- 8 (Update: 2023-07- 1)