Notebookcheck Logo

Apple A16 Bionic vs MediaTek Dimensity 9000+

Apple A16 Bionic

► remove from comparison Apple A16

The Apple A16 Bionic is a System on a Chip (SoC) from Apple that is found in the iPhone 14 Pro (2022) models. It offers 6 cores divided in two performance cores (codename Everest, up to 3.46 GHz) and four power-efficiency cores (codename Sawtooth, up to 2.02). According to Apple, the most improvements were made to the efficiency cores and the improved memory bandwidth (+50% thanks to LPDDR5). According to the die analysis from angstronomics, the e-core cluster still has the same 4 MB L2 cache, but the p-cores now offer 16 MB L2 cache. The SLC (System Level Cache) however seems to be reduced to 24 MB.

The Neural Engine still offers 16 cores and offers an increased performance of 17 TOPS (vs. 15.8 of the A15) for AI tasks. The integrated graphics engine still offers 5 cores and benefits mostly from the higher memory bandwidth. The new display engine supports adaptive refresh rates down to 1 Hz, the new always-on display, and improved anti-aliasing (for the dynamic island animations).

The CPU performance only shows small improvements to the last generation (Apple A15 Bionic). Still, the A16 is by far the fastest mobile CPU for smartphones and leaves e.g. the Snapdragon 8+ Gen 1 easily behind (in Geekbench 5.4 single- and multi-thread tests).

The chip is manufactured on the modern 4nm process at TSMC and integrates nearly 16 billion transistors (compared to the 15.8 billion of the A15 and 11.8 of the A14). Apple emphasized on efficiency and e.g. mentioned 20% power savings for the big performance cores and class-leading efficiency of the e-cores.

MediaTek Dimensity 9000+

► remove from comparison Mediatek Dimensity 9000+

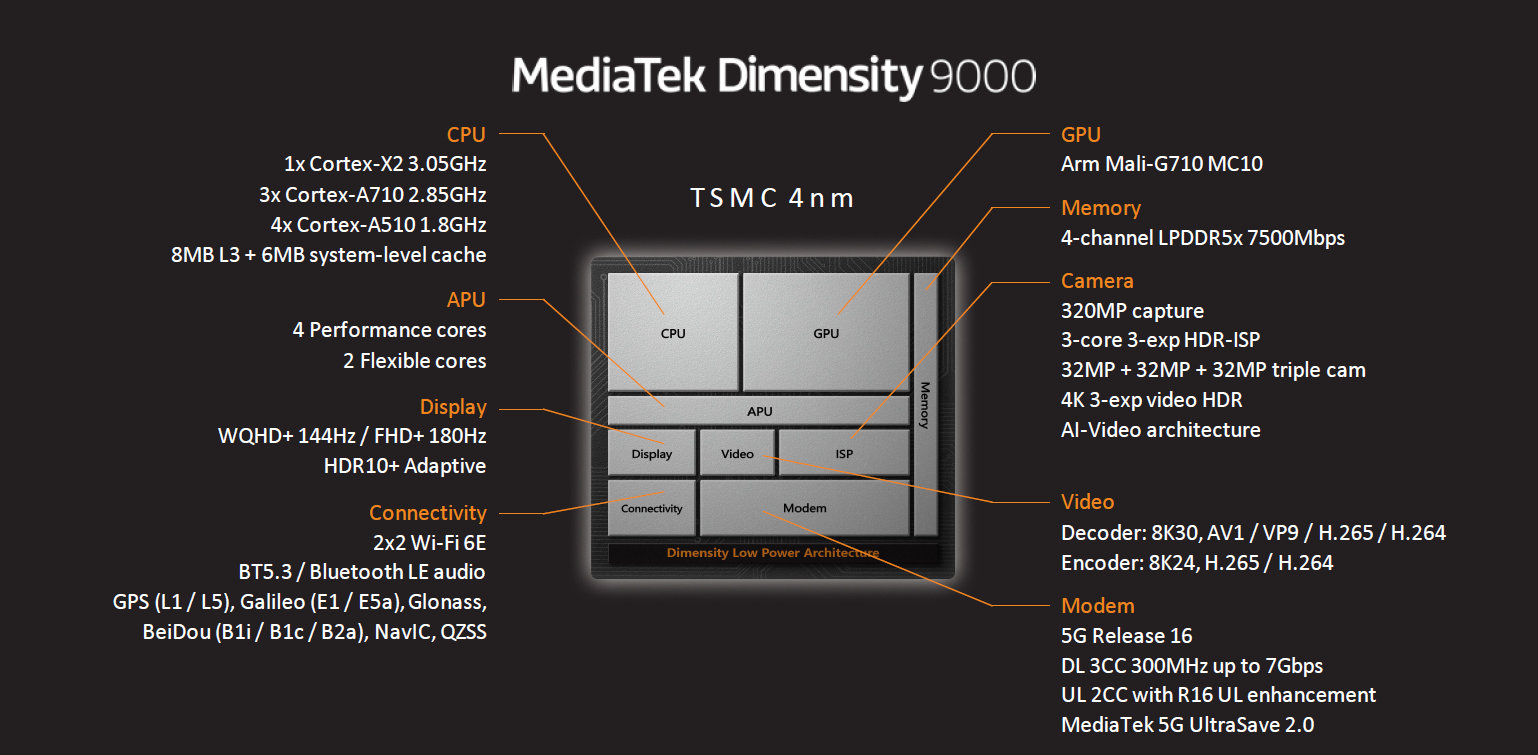
The MediaTek Dimensity 9000+ (or 9000 Plus) is a high-end SoC with an integrated 5G modem. It includes one fast Cortex-X2 core with up to 3 GHz, three more A710 cores with up to 2.85 GHz and four power efficiency cores (Cortex-A510) with upto 1.8 GHz. The SoC is manufactured in the new 4nm process at TSMC. All CPU cores can together use 8 MB of level 3 cache and 6 MB of System Level Cache (SLC). Compared to the similar Dimensity 9000, the 9000 Plus offers a 200 MHz higher clocked X2 core.

The CPU Performance of the 9000+ is very good thanks to the big cores and high clock speeds. At the time of announcement, it should be the fastest SoC for Android phones and depending on the workload even best the Apple A15 of the iPhone 13 (e.g. Geekbench in Multi-Core tests). The Snapdragon 8+ Gen 1 (in the ROG Phone 6 Pro e.g.) should slightly behind the Dimensity 9000+ in single and multi-threaded tests.

The integrated quad channel memory controller supports LPDDR5X with 7500 Mbps. The integrated GPU is an ARM Mali-G710 MC10 (10 of the 16 possible cores) and should be 10% faster compared to the same iGPU in the Dimensity 9000 (thanks to higher clocks).

The Dimensity 9000+ is produced in the state of the art 4nm process at TSMC.

ModelApple A16 BionicMediaTek Dimensity 9000+
CodenameCreteCortex-X2 / A710 / A510
SeriesApple Apple A-Series
Clock2020 - 3460 MHz1800 - 3200 MHz
L2 Cache20 MB
L3 Cache24 MB14 MB
Cores / Threads6 / 68 / 8
1 x 3.2 GHz ARM Cortex-X2
3 x 2.9 GHz ARM Cortex-A710
4 x 1.8 GHz ARM Cortex-A510
Transistors16000 Million
Technology4 nm4 nm
FeaturesARMv8 Instruction Set, Machine Learning Controller, 16-Core Neural Engine, Secure Enclave, Advanced Image Signal Processor1x ARM Cortex-X2 (3.2 GHz), 3x A710 (2.85 GHz), 4x ARM Cortex-A510 (1.8 GHz), ARM Mali-G710 MC10, APU 590, Imagiq 790, 5G Modem (3GPP Release-16), LPDDR5X 7500 Mbps
iGPUApple A16 GPU 5-CoreARM Mali-G710 MP10
ArchitectureARMARM
Announced
Manufacturerwww.mediatek.com

Benchmarks

Geekbench 6.4 - Geekbench 6.4 Single-Core
100%
1 A16 +
min: 2465     avg: 2574     median: 2566 (64%)     max: 2644 Points
Geekbench 6.4 - Geekbench 6.4 Multi-Core
100%
1 A16 +
min: 5939     avg: 6448     median: 6673 (26%)     max: 6923 Points
Geekbench 6.0 - Geekbench 6.0 Single-Core
100%
1 A16 +
2531 Points (80%)
Geekbench 6.0 - Geekbench 6.0 Multi-Core
100%
1 A16 +
6460 Points (27%)
Geekbench 5.5 - Geekbench 5.1 - 5.5 64 Bit Single-Core
100%
A16 +
min: 1878     avg: 1882     median: 1883 (74%)     max: 1885 Points
min: 1383     avg: 1392     median: 1391.5 (54%)     max: 1400 Points
Geekbench 5.5 - Geekbench 5.1 - 5.5 64 Bit Multi-Core
100%
A16 +
min: 4688     avg: 5273     median: 5433 (10%)     max: 5538 Points
min: 4523     avg: 4607     median: 4606.5 (8%)     max: 4690 Points
Geekbench 4.4 - Geekbench 4.1 - 4.4 64 Bit Single-Core
min: 2510     avg: 3706     median: 3705.5 (37%)     max: 4901 Points
Geekbench 4.4 - Geekbench 4.1 - 4.4 64 Bit Multi-Core
min: 2630     avg: 8482     median: 8482 (8%)     max: 14334 Points
Geekbench 4.0 - Geekbench 4.0 64 Bit Single-Core
4596 Points (51%)
Geekbench 4.0 - Geekbench 4.0 64 Bit Multi-Core
13687 Points (20%)
Geekbench 3 - Geekbench 3 64 Bit Multi-Core
7824 Points (12%)
Geekbench 3 - Geekbench 3 64 Bit Single-Core
2996 Points (45%)
Mozilla Kraken 1.1 - Kraken 1.1 Total Score *
100%
A16 +
min: 411.4     avg: 462.6     median: 469.9 (1%)     max: 506 ms
856 ms (1%)
Sunspider - Sunspider 1.0 Total Score *
100%
1 A16 +
min: 55.7     avg: 56.2     median: 56.2 (1%)     max: 56.7 ms
Octane V2 - Octane V2 Total Score
100%
A16 +
min: 68554     avg: 73020     median: 74261 (56%)     max: 75718 Points
51846 Points (39%)
WebXPRT 4 - WebXPRT 4 Score
100%
A16 +
min: 201     avg: 213     median: 202 (55%)     max: 236 Points
128 Points (35%)
WebXPRT 3 - WebXPRT 3 Score
100%
A16 +
min: 286     avg: 288.3     median: 287.5 (52%)     max: 292 Points
152 Points (27%)
Antutu v9 - AnTuTu v9 Total Score
100%
A16 +
min: 949107     avg: 1066570     median: 971870 (47%)     max: 1373450 Points
1091900 Points (53%)
Antutu v9 - AnTuTu v9 CPU
100%
A16 +
min: 245636     avg: 275383     median: 246294 (61%)     max: 363306 Points
283960 Points (71%)
Antutu v10 - AnTuTu v10 Total Score
100%
1 A16 +
min: 1388870     avg: 1413010     median: 1399540 (46%)     max: 1464080 Points
Antutu v10 - AnTuTu v10 CPU
100%
1 A16 +
min: 364610     avg: 375815     median: 374190 (11%)     max: 390270 Points
PassMark PerformanceTest Mobile V1 - PerformanceTest Mobile V1 CPU Tests
100%
A16 +
10812 Points (1%)
8591 Points (1%)
PCMark for Android - PCM f. Android Work Score 3.0
19200 Points (71%)
CrossMark - CrossMark Overall
100%
A16 +
min: 1260     avg: 1307     median: 1329 (50%)     max: 1332 Points
1045 Points (39%)
Power Consumption - Geekbench 5.5 Power Consumption 150cd *
100%
1 A16 +
min: 3.48     avg: 4.3     median: 3.7 (2%)     max: 6.25 Watt
Power Consumption - Idle Power Consumption 150cd 1min *
100%
1 A16 +
min: 0.776     avg: 1.3     median: 0.9 (1%)     max: 2.87 Watt
0.9 Watt (1%)

Average Benchmarks Apple A16 Bionic → 100% n=10

Average Benchmarks MediaTek Dimensity 9000+ → 79% n=10

- Range of benchmark values for this graphics card
red legend - Average benchmark values for this graphics card
* Smaller numbers mean a higher performance
1 This benchmark is not used for the average calculation

Add one or more devices and compare

In the following list you can select (and also search for) devices that should be added to the comparison. You can select more than one device.

restrict list:
v1.33
log 29. 05:37:17

#0 ran 0s before starting gpusingle class +0s ... 0s

#1 checking url part for id 14602 +0s ... 0s

#2 checking url part for id 14617 +0s ... 0s

#3 redirected to Ajax server, took 1753760236s time from redirect:0 +0s ... 0s

#4 did not recreate cache, as it is less than 5 days old! Created at Mon, 28 Jul 2025 05:17:35 +0200 +0s ... 0s

#5 composed specs +0.006s ... 0.006s

#6 did output specs +0s ... 0.006s

#7 getting avg benchmarks for device 14602 +0.001s ... 0.007s

#8 got single benchmarks 14602 +0.007s ... 0.013s

#9 getting avg benchmarks for device 14617 +0.001s ... 0.014s

#10 got single benchmarks 14617 +0.004s ... 0.018s

#11 got avg benchmarks for devices +0s ... 0.018s

#12 min, max, avg, median took s +0.014s ... 0.032s

#13 return log +0s ... 0.033s

Please share our article, every link counts!
Mail Logo
> Expert Reviews and News on Laptops, Smartphones and Tech Innovations > Benchmarks / Tech > Processor Comparison - Head 2 Head
Redaktion, 2017-09- 8 (Update: 2023-07- 1)