Notebookcheck Logo

Apple A13 Bionic vs Intel Core i3-10110Y

Apple A13 Bionic

► remove from comparison Apple A13 Bionic

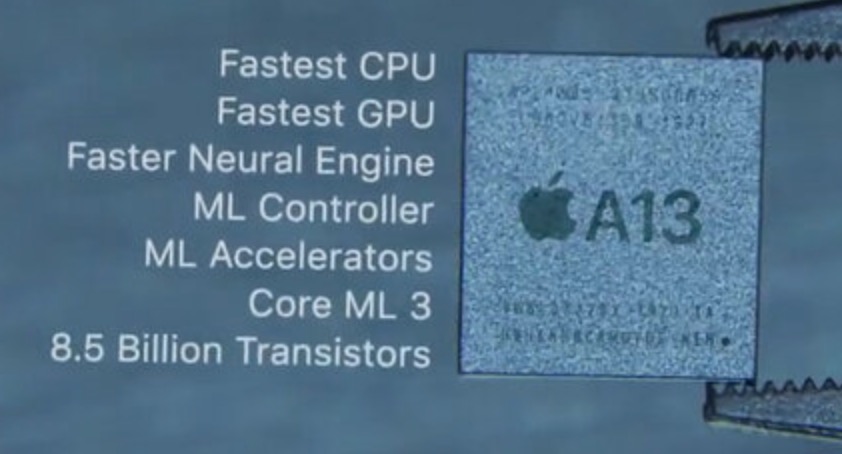
The Apple A13 Bionic is a System on a Chip (SoC) from Apple that is found in the iPhone 11 series. It was announced late 2019 and offers 6 cores divided in 2 performance cores and four power efficiency cores. Compared to the previous A12 Bionic, the A13 should offer a 20% improved CPU performance at 40% lower power (according to Apple).

With 8.5 billion transistors, the A13 Bionic is a big chip especially compared to the Snapdragon 835 (3 Billion) or a Skylake desktop quad-core Soc (1.75 Billion).

Intel Core i3-10110Y

► remove from comparison Intel i3-10110Y

The Intel Core i3-10110Y is an extremely power efficient dual-core SoC for small laptops and tablets that was announced in August 2019. The faster models, like the Core i5-10310Y offer two additional cores however.

Performance

While we have not tested a single system built around the 10110Y as of August 2023, we have tested at least one laptop utilizing the 10100Y, an insignificantly slower chip (Amber Lake, 2 cores, 4 threads, up to 3.9 GHz.) Based on that, expect the 10110Y to be noticeably faster than the AMD 3050e. Performance of this kind is totally sufficient for basic day-to-day activities, as of late 2022.

Your mileage may vary depending on how high the CPU power limits are.

The integrated graphics adapter however is still the same as in the previous generations. It should be still called Intel UHD Graphics 615 and runs at 300 - 1000 MHz in the i3. Furthermore, the SoC integrates a VP9 and H.265 de- and encoder.

The TDP is specified at 7 Watts but can be varied from 5.5 to 9 Watt from the manufacturer (cTDP up/down) resulting in different performance (especially Turbo durations). Interestingly, the faster Core i5-10210Y with two more cores can be configured to lower 4.5 Watt.

ModelApple A13 BionicIntel Core i3-10110Y
SeriesApple Apple A-SeriesIntel Amber Lake
CodenameLightning and ThunderAmber Lake-Y
Clock <=2660 MHz1000 - 4000 MHz
L1 Cache832 KB128 KB
L2 Cache12 MB512 KB
Cores / Threads6 / 62 / 4
Transistors6900 Million
Technology7 nm14 nm
FeaturesARMv8 Instruction SetDDR3L-1600/LPDDR3-2133 RAM, PCIe 3, 4 GT/s bus, MMX, SSE, SSE2, SSE3, SSSE3, SSE4.1, SSE4.2, AVX, AVX2, BMI2, ABM, FMA, ADX, VMX, SMEP, SMAP, MPX, EIST, TM1, TM2, Hyper-Threading, Turbo, SST, AES-NI, RDRAND, RDSEED, SGX
iGPUApple A13 Bionic GPUIntel UHD Graphics 615 (300 - 1000 MHz)
ArchitectureARMx86
Announced
Series: Amber Lake Amber Lake-Y
Intel Core i5-10310Y compare1.1 - 4.1 GHz4 / 8 cores6 MB L3
Intel Core i5-10210Y compare1 - 4 GHz4 / 8 cores6 MB L3
Intel Core i7-8500Y compare1.5 - 4.2 GHz2 / 4 cores4 MB L3
Intel Core i3-10110Y « 1 - 4 GHz2 / 4 cores4 MB L3
Intel Core i5-8210Y compare1.6 - 3.6 GHz2 / 4 cores4 MB L3
Intel Core i5-8200Y compare1.3 - 3.9 GHz2 / 4 cores4 MB L3
Intel Core i3-10100Y compare1.3 - 3.9 GHz2 / 4 cores4 MB L3
Intel Core m3-8100Y compare1.1 - 3.4 GHz2 / 4 cores4 MB L3
Intel Pentium Gold 6500Y compare1.1 - 3.4 GHz2 / 4 cores4 MB L3
L3 Cache4 MB
TDP7 Watt
max. Temp.100 °C
SocketBGA1377
Manufacturerark.intel.com

Benchmarks

3DMark - 3DMark Ice Storm Unlimited Physics
min: 33851     avg: 33885     median: 33881 (29%)     max: 33925 Points
3DMark - 3DMark Sling Shot Extreme (ES 3.1) Unlimited Physics
min: 2078     avg: 2803     median: 2958 (35%)     max: 3219 Points
3DMark - 3DMark Sling Shot (ES 3.0) Unlimited Physics
min: 3411     avg: 3780     median: 3877 (44%)     max: 4052 Points
Geekbench 5.5 - Geekbench 5.1 - 5.4 64 Bit Single-Core
min: 1326     avg: 1333     median: 1332 (56%)     max: 1342 Points
996 Points (42%)
Geekbench 5.5 - Geekbench 5.1 - 5.4 64 Bit Multi-Core
min: 3235     avg: 3381     median: 3378.5 (6%)     max: 3531 Points
1633 Points (3%)
Geekbench 5.0 - Geekbench 5.0 64 Bit Single-Core
min: 1343     avg: 1343     median: 1343 (6%)     max: 1344 Points
Geekbench 5.0 - Geekbench 5.0 64 Bit Multi-Core
min: 3242     avg: 3427     median: 3463 (11%)     max: 3575 Points
Mozilla Kraken 1.1 - Kraken 1.1 Total Score *
min: 545     avg: 562     median: 571 (1%)     max: 573 ms
Octane V2 - Octane V2 Total Score
min: 47288     avg: 48727     median: 48991 (44%)     max: 49388 Points
WebXPRT 3 - WebXPRT 3 Score
min: 146     avg: 179.2     median: 183 (38%)     max: 202 Points
AnTuTu v7 - AnTuTu v7 MEM
min: 10494     avg: 12510     median: 12592 (39%)     max: 14443 Points
AnTuTu v7 - AnTuTu v7 UX
min: 77118     avg: 77810     median: 78032 (96%)     max: 78279 Points
AnTuTu v7 - AnTuTu v7 GPU
min: 218738     avg: 219891     median: 218937 (68%)     max: 221998 Points
AnTuTu v7 - AnTuTu v7 CPU
min: 147281     avg: 149542     median: 148191 (91%)     max: 153154 Points
AnTuTu v7 - AnTuTu v7 Total Score
min: 456891     avg: 459752     median: 459850 (81%)     max: 462516 Points
AnTuTu v8 - AnTuTu v8 UX
min: 64361     avg: 75201     median: 78294 (65%)     max: 82947 Points
AnTuTu v8 - AnTuTu v8 MEM
min: 67691     avg: 75819     median: 74262 (60%)     max: 85504 Points
AnTuTu v8 - AnTuTu v8 GPU
min: 190559     avg: 203672     median: 209164 (38%)     max: 211292 Points
AnTuTu v8 - AnTuTu v8 CPU
min: 149088     avg: 156731     median: 152919 (55%)     max: 168185 Points
AnTuTu v8 - AnTuTu v8 Total Score
min: 489463     avg: 511422     median: 510245 (49%)     max: 534558 Points
Antutu v9 - AnTuTu v9 Total Score
622382 Points (38%)
Antutu v9 - AnTuTu v9 CPU
147649 Points (40%)
PassMark PerformanceTest Mobile V1 - PerformanceTest Mobile V1 CPU Tests
min: 650706     avg: 678820     median: 683897 (90%)     max: 701856 Points
CrossMark - CrossMark Overall
min: 776     avg: 835     median: 849 (33%)     max: 864 Points
Power Consumption - Geekbench 5.5 Power Consumption 150cd *
7 Watt (3%)
Power Consumption - Idle Power Consumption 150cd 1min *
2.9 Watt (3%)

Average Benchmarks Apple A13 Bionic → 100% n=2

Average Benchmarks Intel Core i3-10110Y → 62% n=2

- Range of benchmark values for this graphics card
- Average benchmark values for this graphics card
* Smaller numbers mean a higher performance
1 This benchmark is not used for the average calculation

Add one or more devices and compare

In the following list you can select (and also search for) devices that should be added to the comparison. You can select more than one device.

restrict list:

show all (including archived), 2024, 2023
v1.26
log 22. 19:39:17

#0 checking url part for id 11496 +0s ... 0s

#1 checking url part for id 11469 +0s ... 0s

#2 not redirecting to Ajax server +0s ... 0s

#3 did not recreate cache, as it is less than 5 days old! Created at Wed, 22 May 2024 05:37:27 +0200 +0.001s ... 0.001s

#4 composed specs +0.026s ... 0.027s

#5 did output specs +0s ... 0.027s

#6 getting avg benchmarks for device 11496 +0.003s ... 0.03s

#7 got single benchmarks 11496 +0.018s ... 0.049s

#8 getting avg benchmarks for device 11469 +0.003s ... 0.052s

#9 got single benchmarks 11469 +0.008s ... 0.06s

#10 got avg benchmarks for devices +0s ... 0.06s

#11 min, max, avg, median took s +0.079s ... 0.139s

#12 return log +0.023s ... 0.161s

Please share our article, every link counts!
> Expert Reviews and News on Laptops, Smartphones and Tech Innovations > Benchmarks / Tech > Processor Comparison - Head 2 Head
Redaktion, 2017-09- 8 (Update: 2023-07- 1)