Notebookcheck Logo

Apple A13 Bionic vs Samsung Exynos 8895 Octa vs Samsung Exynos 8890 Octa

Apple A13 Bionic

► remove from comparison Apple A13 Bionic

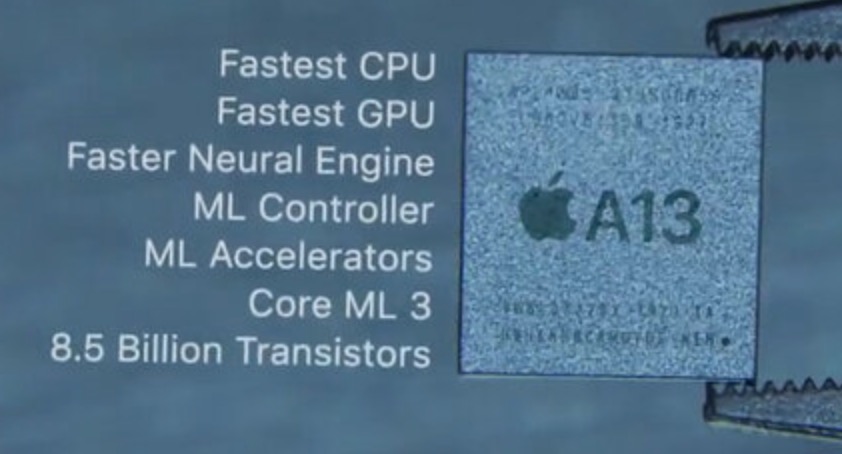
The Apple A13 Bionic is a System on a Chip (SoC) from Apple that is found in the iPhone 11 series. It was announced late 2019 and offers 6 cores divided in 2 performance cores and four power efficiency cores. Compared to the previous A12 Bionic, the A13 should offer a 20% improved CPU performance at 40% lower power (according to Apple).

With 8.5 billion transistors, the A13 Bionic is a big chip especially compared to the Snapdragon 835 (3 Billion) or a Skylake desktop quad-core Soc (1.75 Billion).

Samsung Exynos 8895 Octa

► remove from comparison

The Samsung Exynos 9 8895 Octa is a System on a Chip (SoC) for smartphones and tablets. It was announced early 2017 and is one of the first SoCs that is produced in 10nm (together with the Snapdragon 835). It first appeared in the Samsung Galaxy S8 and S8 Plus and contains four Samsung M1 cores at up to 2.3 GHz and four ARM Cortex-A53 cores to save power. As a GPU it integrates the ARM Mali-G71 MP20. Furthermore, a Cat.16 5CA 1 Gbps (download) and Cat.13 2CA 150 MBps (upload) LTE modem and a LPDDR4x memory controller is integrated. The video engine is capable of en- and decoding 4K UHD 120 fps H.265, H.264 and VP9 according to Samsung.

The performance of the CPU cores seems compareable to the Snapdragon 835 and therefore it should be one of the fastest processors for Android phones in early 2017.

Samsung Exynos 8890 Octa

► remove from comparison

The Samsung Exynos 8890 Octa is a System on a Chip (SoC) for smartphones and tablets. It was announced late 2015 and first appeared in some Galaxy S7 devices in the beginning of 2016. It integrates four Samsung M1 cores where two are clocked at 2.6 GHz and all four cores under load at 2.3 GHz. Furthermore, four power saving ARM Cortex-A53 cores clocked at 1.6 GHz are present adding to a total of 8 cores. As a graphics card, Samsung integrated a ARM Mali-T880 MP12 (12 cluster version). The memory controller supports 2 x 32 Bit LPDDR4 with up to 1800 MHz.

The processor performance is on par with the Qualcomm Snapdragon 820 that can also be found in some variants of the Galaxy S7. The 820 is faster in single threaded tasks, the 8890 pulls ahead if it can use all 8 cores. Therfore, the 8890 is one of the fastest smartphones SoCs in 2016.

ModelApple A13 BionicSamsung Exynos 8895 OctaSamsung Exynos 8890 Octa
SeriesApple Apple A-SeriesSamsung ExynosSamsung Exynos
CodenameLightning and ThunderMongoose / Cortex-A53Mongoose / Cortex-A53
Clock <=2660 MHz2300 MHz2600 MHz
L1 Cache832 KB
L2 Cache12 MB
Cores / Threads6 / 68 / 88 / 8
Transistors6900 Million
Technology7 nm10 nm14 nm
FeaturesARMv8 Instruction SetARM Mali-T880MP20 GPU , 4x Mongoose (2.3), 4x Cortex-A53 big.LITTLE, LPDDR4x Memory ControllerARM Mali-T880MP12 GPU (650 MHz), 4x Mongoose (2.3 / 2.6 GHz), 4x Cortex-A53 (1.6 GHz) big.LITTLE, 2x 32 Bit LPDDR4 1800 MHz Memory Controller
iGPUApple A13 Bionic GPUARM Mali-G71 MP20ARM Mali-T880 MP12 (650 - 650 MHz)
ArchitectureARMARMARM
Announced
Series: Exynos Mongoose / Cortex-A53
Samsung Exynos 8895 Octa « 2.3 GHz8 / 8 cores Mongoose / Cortex-A53
Samsung Exynos 8890 Octa2.6 GHz8 / 8 cores Mongoose / Cortex-A53
Samsung Exynos 8895 Octa2.3 GHz8 / 8 cores Mongoose / Cortex-A53
Samsung Exynos 8890 Octa « 2.6 GHz8 / 8 cores Mongoose / Cortex-A53
Manufacturerwww.samsung.com

Benchmarks

3DMark - 3DMark Ice Storm Unlimited Physics
min: 33851     avg: 33885     median: 33881 (29%)     max: 33925 Points
min: 20892     avg: 21755     median: 21543 (18%)     max: 22829 Points
min: 19610     avg: 19796     median: 19834 (17%)     max: 19944 Points
3DMark - 3DMark Sling Shot Extreme (ES 3.1) Unlimited Physics
min: 2078     avg: 2803     median: 2958 (35%)     max: 3219 Points
min: 2417     avg: 2469     median: 2479 (29%)     max: 2512 Points
min: 1578     avg: 1695     median: 1694.5 (20%)     max: 1811 Points
3DMark - 3DMark Sling Shot (ES 3.0) Unlimited Physics
min: 3411     avg: 3780     median: 3877 (44%)     max: 4052 Points
min: 1816     avg: 2227     median: 2410 (28%)     max: 2454 Points
min: 1773     avg: 1786     median: 1786 (20%)     max: 1799 Points
Geekbench 5.5 - Geekbench 5.1 - 5.4 64 Bit Single-Core
min: 1326     avg: 1333     median: 1332 (56%)     max: 1342 Points
Geekbench 5.5 - Geekbench 5.1 - 5.4 64 Bit Multi-Core
min: 3235     avg: 3381     median: 3378.5 (6%)     max: 3531 Points
Geekbench 5.0 - Geekbench 5.0 64 Bit Single-Core
min: 1343     avg: 1343     median: 1343 (6%)     max: 1344 Points
Geekbench 5.0 - Geekbench 5.0 64 Bit Multi-Core
min: 3242     avg: 3427     median: 3463 (11%)     max: 3575 Points
Geekbench 4.4 - Geekbench 4.1 - 4.4 64 Bit Single-Core
min: 1997     avg: 2013     median: 2015 (20%)     max: 2028 Points
1810 Points (18%)
Geekbench 4.4 - Geekbench 4.1 - 4.4 64 Bit Multi-Core
min: 6695     avg: 6717     median: 6711 (7%)     max: 6744 Points
5354 Points (6%)
Geekbench 4.0 - Geekbench 4.0 64 Bit Single-Core
min: 1952     avg: 1970     median: 1970 (27%)     max: 1988 Points
min: 1840     avg: 1853     median: 1852.5 (25%)     max: 1865 Points
Geekbench 4.0 - Geekbench 4.0 64 Bit Multi-Core
min: 6300     avg: 6337     median: 6337 (15%)     max: 6375 Points
min: 5213     avg: 5358     median: 5358 (13%)     max: 5503 Points
Geekbench 3 - Geekbench 3 64 Bit Multi-Core
min: 5683     avg: 5768     median: 5768 (9%)     max: 5853 Points
min: 5260     avg: 6135     median: 6400.5 (10%)     max: 6480 Points
Geekbench 3 - Geekbench 3 64 Bit Single-Core
min: 1539     avg: 1541     median: 1540.5 (23%)     max: 1542 Points
min: 1645     avg: 2044     median: 2165 (32%)     max: 2199 Points
Geekbench 2 - 32 Bit - Geekbench Stream
1208 Points (10%)
Geekbench 2 - 32 Bit - Geekbench Memory
1899 Points (17%)
Geekbench 2 - 32 Bit - Geekbench Floating Point
11306 Points (22%)
Geekbench 2 - 32 Bit - Geekbench Integer
5338 Points (11%)
Geekbench 2 - 32 Bit - Geekbench Total Score
6325 Points (17%)
Mozilla Kraken 1.1 - Kraken 1.1 Total Score *
min: 545     avg: 562     median: 571 (1%)     max: 573 ms
min: 1877     avg: 2000     median: 1887 (2%)     max: 2237 ms
min: 2562     avg: 2565     median: 2564 (3%)     max: 2569 ms
Sunspider - Sunspider 1.0 Total Score *
321 ms (4%)
Octane V2 - Octane V2 Total Score
min: 47288     avg: 48727     median: 48991 (44%)     max: 49388 Points
min: 12941     avg: 13419     median: 13265 (12%)     max: 14050 Points
min: 12579     avg: 12900     median: 12915.5 (12%)     max: 13191 Points
WebXPRT 3 - WebXPRT 3 Score
min: 146     avg: 179.2     median: 183 (38%)     max: 202 Points
Vellamo 3.x - Vellamo 3.x Metal
min: 3407     avg: 3514     median: 3513.5 (94%)     max: 3620 Points
min: 3371     avg: 3397     median: 3396.5 (91%)     max: 3422 Points
Vellamo 3.x - Vellamo 3.x Multicore Beta
min: 3325     avg: 3480     median: 3479.5 (77%)     max: 3634 Points
min: 3408     avg: 3430     median: 3430 (76%)     max: 3452 Points
Vellamo 3.x - Vellamo 3.x Browser
min: 7270     avg: 7368     median: 7368 (97%)     max: 7466 Points
min: 7198     avg: 7384     median: 7384 (98%)     max: 7570 Points
Quadrant Standard Edition 2.0 - Quadrant Standard 2.0 Total Score
43185 points (100%)
AnTuTu v5 - AnTuTu v5 Total Score
80582 Points (81%)
AnTuTu v6 - AnTuTu v6 Total Score
min: 165382     avg: 170421     median: 171884 (59%)     max: 173997 Points
min: 127902     avg: 130165     median: 128749 (44%)     max: 133845 Points
AnTuTu v7 - AnTuTu v7 MEM
min: 10494     avg: 12510     median: 12592 (39%)     max: 14443 Points
8027 Points (25%)
AnTuTu v7 - AnTuTu v7 UX
min: 77118     avg: 77810     median: 78032 (96%)     max: 78279 Points
43027 Points (53%)
AnTuTu v7 - AnTuTu v7 GPU
min: 218738     avg: 219891     median: 218937 (68%)     max: 221998 Points
77928 Points (24%)
AnTuTu v7 - AnTuTu v7 CPU
min: 147281     avg: 149542     median: 148191 (91%)     max: 153154 Points
72228 Points (44%)
AnTuTu v7 - AnTuTu v7 Total Score
min: 456891     avg: 459752     median: 459850 (81%)     max: 462516 Points
201210 Points (36%)
AnTuTu v8 - AnTuTu v8 UX
min: 64361     avg: 75201     median: 78294 (65%)     max: 82947 Points
AnTuTu v8 - AnTuTu v8 MEM
min: 67691     avg: 75819     median: 74262 (60%)     max: 85504 Points
AnTuTu v8 - AnTuTu v8 GPU
min: 190559     avg: 203672     median: 209164 (38%)     max: 211292 Points
AnTuTu v8 - AnTuTu v8 CPU
min: 149088     avg: 156731     median: 152919 (55%)     max: 168185 Points
AnTuTu v8 - AnTuTu v8 Total Score
min: 489463     avg: 511422     median: 510245 (49%)     max: 534558 Points
Antutu v9 - AnTuTu v9 Total Score
622382 Points (38%)
Antutu v9 - AnTuTu v9 CPU
147649 Points (40%)
PassMark PerformanceTest Mobile V1 - PerformanceTest Mobile V1 CPU Tests
min: 650706     avg: 678820     median: 683897 (90%)     max: 701856 Points
238041 Points (31%)
min: 205706     avg: 212850     median: 207417 (27%)     max: 225427 Points
PCMark for Android - PCM f. Android Work 2.0 Battery Life
min: 495     avg: 518     median: 527 (10%)     max: 533 min
371 min (7%)
PCMark for Android - PCM f. Android Computer Vision
min: 2647     avg: 2687     median: 2683 (14%)     max: 2730 Points
PCMark for Android - PCM f. Android Storage
min: 4420     avg: 4508     median: 4520 (10%)     max: 4585 Points
PCMark for Android - PCM f. Android Work Score 2.0
min: 5096     avg: 5220     median: 5195 (34%)     max: 5370 Points
3550 Points (23%)
PCMark for Android - PCM f. Android Work Score
min: 5830     avg: 5983     median: 6035 (30%)     max: 6084 Points
min: 4660     avg: 4867     median: 4826 (24%)     max: 5115 Points
CrossMark - CrossMark Overall
min: 776     avg: 835     median: 849 (33%)     max: 864 Points
Power Consumption - Geekbench 5.5 Power Consumption 150cd *
7 Watt (3%)
Power Consumption - Idle Power Consumption 150cd 1min *
2.9 Watt (3%)

Average Benchmarks Apple A13 Bionic → 100% n=6

Average Benchmarks Samsung Exynos 8895 Octa → 62% n=6

Average Benchmarks Samsung Exynos 8890 Octa → 53% n=6

- Range of benchmark values for this graphics card
- Average benchmark values for this graphics card
* Smaller numbers mean a higher performance
1 This benchmark is not used for the average calculation

v1.26
log 07. 22:53:23

#0 checking url part for id 11496 +0s ... 0s

#1 checking url part for id 8590 +0s ... 0s

#2 checking url part for id 8020 +0s ... 0s

#3 not redirecting to Ajax server +0s ... 0s

#4 did not recreate cache, as it is less than 5 days old! Created at Tue, 07 May 2024 05:39:01 +0200 +0.001s ... 0.001s

#5 composed specs +0.025s ... 0.026s

#6 did output specs +0s ... 0.026s

#7 getting avg benchmarks for device 11496 +0.002s ... 0.028s

#8 got single benchmarks 11496 +0.011s ... 0.039s

#9 getting avg benchmarks for device 8590 +0.002s ... 0.041s

#10 got single benchmarks 8590 +0.009s ... 0.049s

#11 getting avg benchmarks for device 8020 +0.002s ... 0.051s

#12 got single benchmarks 8020 +0.008s ... 0.06s

#13 got avg benchmarks for devices +0s ... 0.06s

#14 min, max, avg, median took s +0.146s ... 0.206s

#15 return log +0s ... 0.206s

Please share our article, every link counts!
> Expert Reviews and News on Laptops, Smartphones and Tech Innovations > Benchmarks / Tech > Processor Comparison - Head 2 Head
Redaktion, 2017-09- 8 (Update: 2023-07- 1)