Notebookcheck Logo

Apple A13 Bionic vs Apple A16 Bionic vs Apple A15 Bionic

Apple A13 Bionic

► remove from comparison Apple A13 Bionic

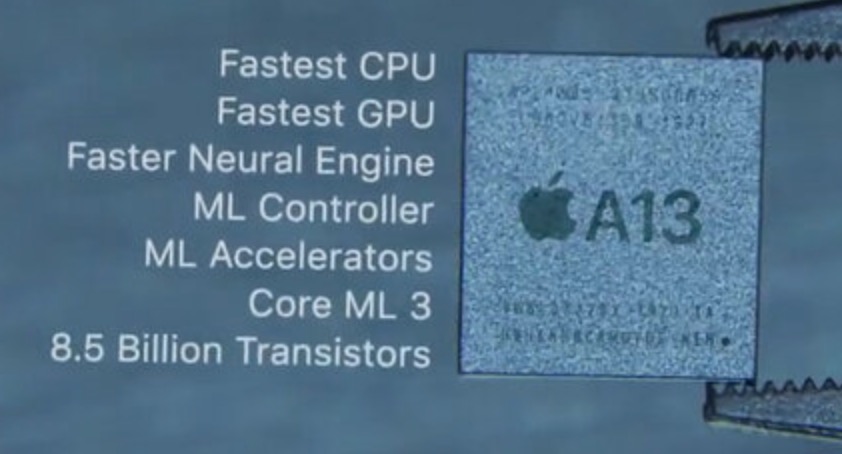
The Apple A13 Bionic is a System on a Chip (SoC) from Apple that is found in the iPhone 11 series. It was announced late 2019 and offers 6 cores divided in 2 performance cores and four power efficiency cores. Compared to the previous A12 Bionic, the A13 should offer a 20% improved CPU performance at 40% lower power (according to Apple).

With 8.5 billion transistors, the A13 Bionic is a big chip especially compared to the Snapdragon 835 (3 Billion) or a Skylake desktop quad-core Soc (1.75 Billion).

Apple A16 Bionic

► remove from comparison Apple A16

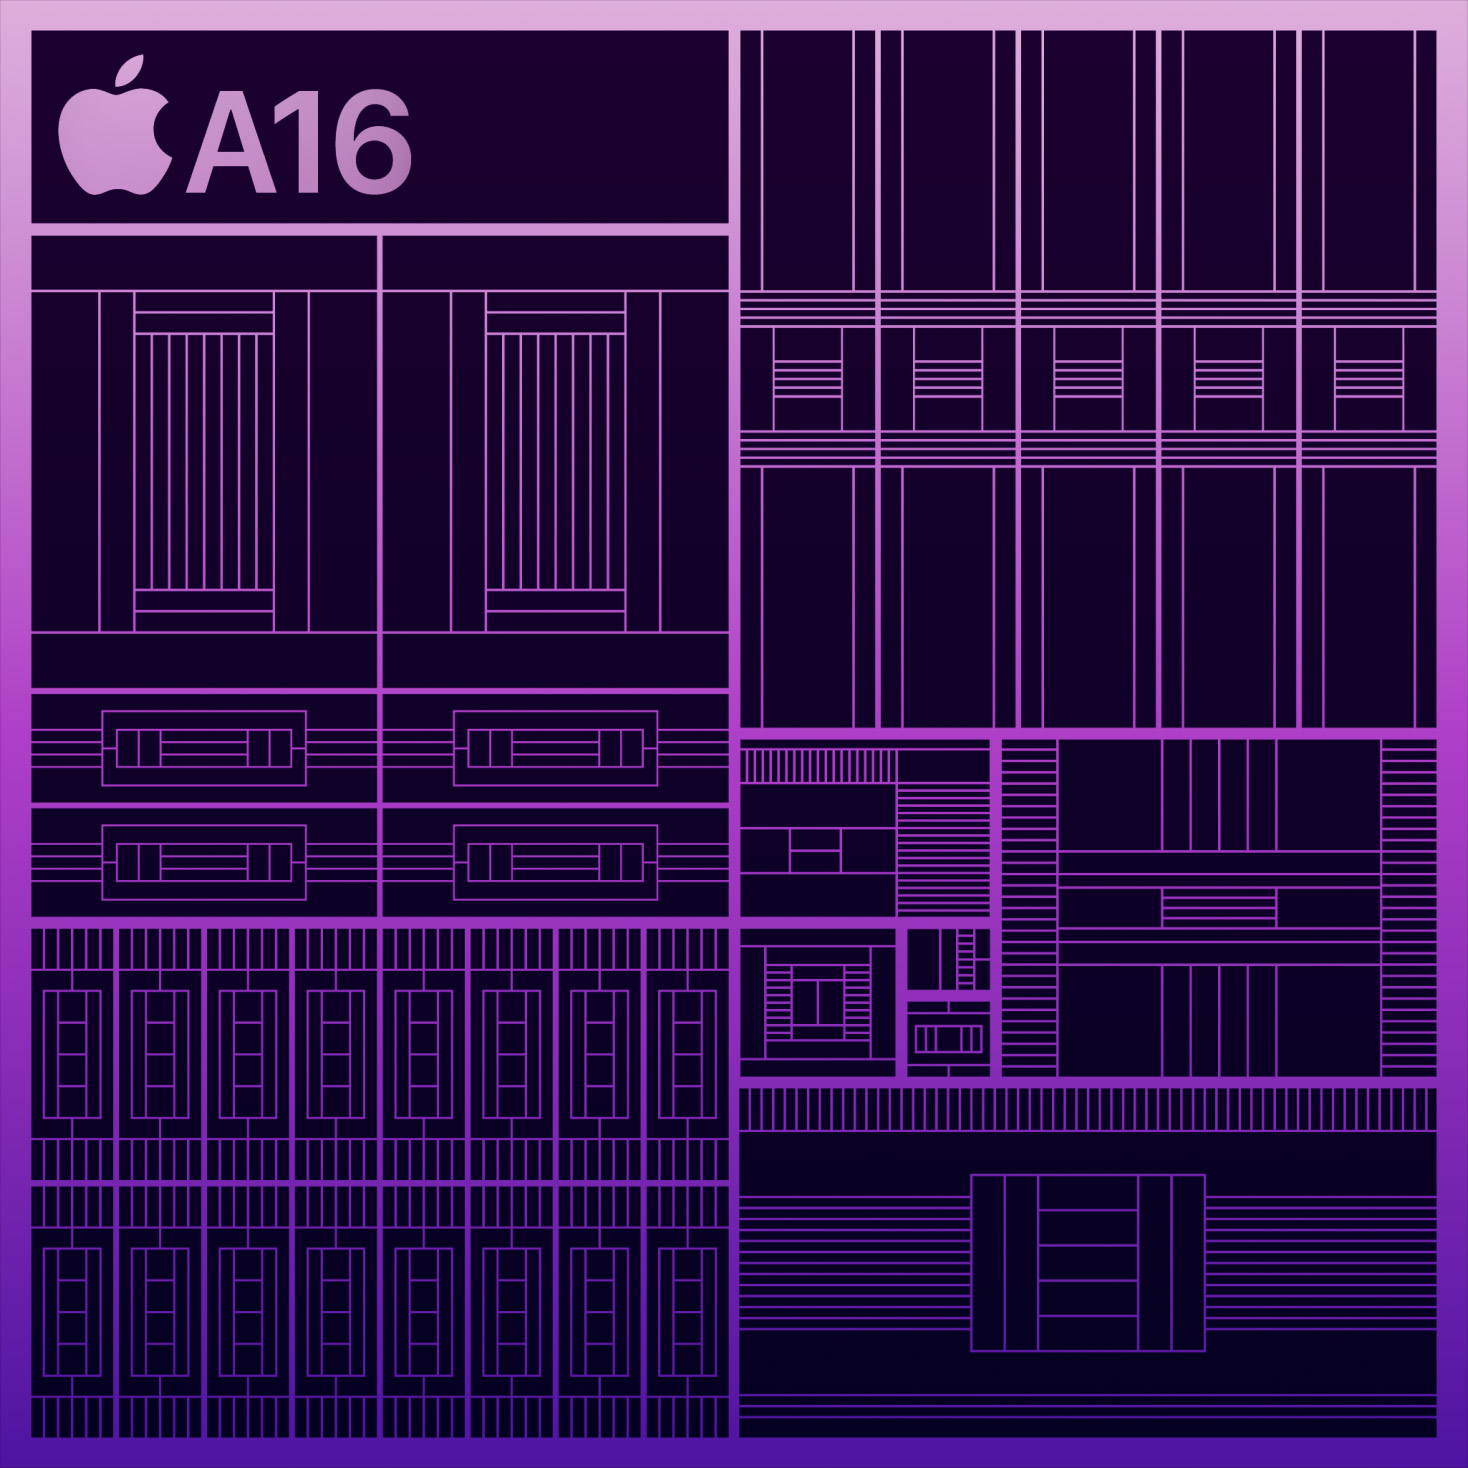
The Apple A16 Bionic is a System on a Chip (SoC) from Apple that is found in the iPhone 14 Pro (2022) models. It offers 6 cores divided in two performance cores (codename Everest, up to 3.46 GHz) and four power-efficiency cores (codename Sawtooth, up to 2.02). According to Apple, the most improvements were made to the efficiency cores and the improved memory bandwidth (+50% thanks to LPDDR5). According to the die analysis from angstronomics, the e-core cluster still has the same 4 MB L2 cache, but the p-cores now offer 16 MB L2 cache. The SLC (System Level Cache) however seems to be reduced to 24 MB.

The Neural Engine still offers 16 cores and offers an increased performance of 17 TOPS (vs. 15.8 of the A15) for AI tasks. The integrated graphics engine still offers 5 cores and benefits mostly from the higher memory bandwidth. The new display engine supports adaptive refresh rates down to 1 Hz, the new always-on display, and improved anti-aliasing (for the dynamic island animations).

The CPU performance only shows small improvements to the last generation (Apple A15 Bionic). Still, the A16 is by far the fastest mobile CPU for smartphones and leaves e.g. the Snapdragon 8+ Gen 1 easily behind (in Geekbench 5.4 single- and multi-thread tests).

The chip is manufactured on the modern 4nm process at TSMC and integrates nearly 16 billion transistors (compared to the 15.8 billion of the A15 and 11.8 of the A14). Apple emphasized on efficiency and e.g. mentioned 20% power savings for the big performance cores and class-leading efficiency of the e-cores.

Apple A15 Bionic

► remove from comparison Apple A15

The Apple A15 Bionic is a System on a Chip (SoC) from Apple that is found in the iPhone 13 and iPad Mini (2021) models. It was announced late 2021 and offers 6 cores divided in 2 performance cores and four power efficiency cores. The CPU performance increases only slightly compared to the A14, but GPU (in the higher end models) offers higher gains.

The chip is manufactured in 5nm and integrates 15.8 billion transistors (compared to the 11.8 of the A14).

ModelApple A13 BionicApple A16 BionicApple A15 Bionic
CodenameLightning and ThunderCrete
SeriesApple Apple A-SeriesApple Apple A-SeriesApple Apple A-Series
Clock <=2660 MHz2020 - 3460 MHz2020 - 3230 MHz
L1 Cache832 KB
L2 Cache12 MB20 MB16 MB
Cores / Threads6 / 66 / 66 / 6
Transistors6900 Million16000 Million15800 Million
Technology7 nm4 nm5 nm
FeaturesARMv8 Instruction SetARMv8 Instruction Set, Machine Learning Controller, 16-Core Neural Engine, Secure Enclave, Advanced Image Signal ProcessorARMv8 Instruction Set, Machine Learning Controller, 16-Core Neural Engine, Secure Enclave, Advanced Image Signal Processor
iGPUApple A13 Bionic GPUApple A16 GPU 5-CoreApple A15 GPU 5-Core
ArchitectureARMARMARM
Announced
L3 Cache24 MB32 MB
Series: Apple A-Series
Apple A18 Pro - 4 GHz6 / 6 cores
Apple A18 - 3.8 GHz6 / 6 cores
Apple A15 Bionic « 2.02 - 3.23 GHz6 / 6 cores32 MB L3
Apple A12 Bionic - 2.49 GHz6 / 6 cores
Apple A6x1.4 GHzcores
Apple A61 GHzcores

Benchmarks

3DMark - 3DMark Ice Storm Unlimited Physics
min: 33851     avg: 33885     median: 33881 (27%)     max: 33925 Points
3DMark - 3DMark Sling Shot Extreme (ES 3.1) Unlimited Physics
min: 2078     avg: 2803     median: 2958 (28%)     max: 3219 Points
65%
1 A15 +
min: 1852     avg: 2027     median: 1913 (18%)     max: 2307 Points
3DMark - 3DMark Sling Shot (ES 3.0) Unlimited Physics
min: 3411     avg: 3780     median: 3877 (44%)     max: 4052 Points
Geekbench 6.4 - Geekbench 6.4 Single-Core
1760 Points (44%)
146%
A16 +
min: 2465     avg: 2574     median: 2566 (64%)     max: 2644 Points
133%
A15 +
2332 Points (58%)
Geekbench 6.4 - Geekbench 6.4 Multi-Core
4135 Points (16%)
161%
A16 +
min: 5939     avg: 6448     median: 6673 (26%)     max: 6923 Points
137%
A15 +
5661 Points (22%)
Geekbench 6.0 - Geekbench 6.0 Single-Core
100%
1 A16 +
2531 Points (80%)
Geekbench 6.0 - Geekbench 6.0 Multi-Core
100%
1 A16 +
6460 Points (27%)
Geekbench 5.5 - Geekbench 5.1 - 5.5 64 Bit Single-Core
min: 1326     avg: 1333     median: 1332 (52%)     max: 1342 Points
141%
A16 +
min: 1878     avg: 1882     median: 1883 (74%)     max: 1885 Points
130%
A15 +
min: 1590     avg: 1723     median: 1734 (68%)     max: 1755 Points
Geekbench 5.5 - Geekbench 5.1 - 5.5 64 Bit Multi-Core
min: 3235     avg: 3381     median: 3378.5 (6%)     max: 3531 Points
161%
A16 +
min: 4688     avg: 5273     median: 5433 (10%)     max: 5538 Points
142%
A15 +
min: 4559     avg: 4755     median: 4788 (9%)     max: 4914 Points
Geekbench 5.0 - Geekbench 5.0 64 Bit Single-Core
min: 1343     avg: 1343     median: 1343 (6%)     max: 1344 Points
Geekbench 5.0 - Geekbench 5.0 64 Bit Multi-Core
min: 3242     avg: 3427     median: 3463 (11%)     max: 3575 Points
Mozilla Kraken 1.1 - Kraken 1.1 Total Score *
min: 545     avg: 562     median: 571 (1%)     max: 573 ms
122%
A16 +
min: 411.4     avg: 462.6     median: 469.9 (1%)     max: 506 ms
127%
A15 +
min: 413.6     avg: 455.6     median: 451 (1%)     max: 507.3 ms
Sunspider - Sunspider 1.0 Total Score *
100%
1 A16 +
min: 55.7     avg: 56.2     median: 56.2 (1%)     max: 56.7 ms
73%
1 A15 +
77 ms (1%)
Octane V2 - Octane V2 Total Score
min: 47288     avg: 48727     median: 48991 (36%)     max: 49388 Points
152%
A16 +
min: 68554     avg: 73020     median: 74261 (54%)     max: 75718 Points
131%
A15 +
min: 57143     avg: 63305     median: 64026.5 (47%)     max: 65969 Points
WebXPRT 4 - WebXPRT 4 Score
100%
1 A16 +
min: 201     avg: 213     median: 202 (55%)     max: 236 Points
93%
1 A15 +
min: 188     avg: 188.3     median: 188 (52%)     max: 189 Points
WebXPRT 3 - WebXPRT 3 Score
min: 146     avg: 179.2     median: 183 (33%)     max: 202 Points
157%
A16 +
min: 286     avg: 288.3     median: 287.5 (52%)     max: 292 Points
137%
A15 +
min: 219     avg: 254.3     median: 250 (45%)     max: 279 Points
AnTuTu v7 - AnTuTu v7 MEM
min: 10494     avg: 12510     median: 12592 (39%)     max: 14443 Points
AnTuTu v7 - AnTuTu v7 UX
min: 77118     avg: 77810     median: 78032 (96%)     max: 78279 Points
AnTuTu v7 - AnTuTu v7 GPU
min: 218738     avg: 219891     median: 218937 (68%)     max: 221998 Points
AnTuTu v7 - AnTuTu v7 CPU
min: 147281     avg: 149542     median: 148191 (91%)     max: 153154 Points
AnTuTu v7 - AnTuTu v7 Total Score
min: 456891     avg: 459752     median: 459850 (81%)     max: 462516 Points
AnTuTu v8 - AnTuTu v8 UX
min: 64361     avg: 75201     median: 78294 (65%)     max: 82947 Points
AnTuTu v8 - AnTuTu v8 MEM
min: 67691     avg: 75819     median: 74262 (60%)     max: 85504 Points
AnTuTu v8 - AnTuTu v8 GPU
min: 190559     avg: 203672     median: 209164 (38%)     max: 211292 Points
AnTuTu v8 - AnTuTu v8 CPU
min: 149088     avg: 156731     median: 152919 (55%)     max: 168185 Points
AnTuTu v8 - AnTuTu v8 Total Score
min: 489463     avg: 511422     median: 510245 (49%)     max: 534558 Points
Antutu v9 - AnTuTu v9 Total Score
622382 Points (30%)
156%
A16 +
min: 949107     avg: 1066570     median: 971870 (47%)     max: 1373450 Points
129%
A15 +
min: 722973     avg: 788523     median: 800415 (39%)     max: 832548 Points
Antutu v9 - AnTuTu v9 CPU
147649 Points (37%)
167%
A16 +
min: 245636     avg: 275383     median: 246294 (61%)     max: 363306 Points
142%
A15 +
min: 192891     avg: 209810     median: 209802 (52%)     max: 227638 Points
Antutu v10 - AnTuTu v10 Total Score
904153 Points (30%)
155%
1 A16 +
min: 1388870     avg: 1413010     median: 1399540 (46%)     max: 1464080 Points
Antutu v10 - AnTuTu v10 CPU
236453 Points (7%)
158%
1 A16 +
min: 364610     avg: 375815     median: 374190 (11%)     max: 390270 Points
PassMark PerformanceTest Mobile V1 - PerformanceTest Mobile V1 CPU Tests
min: 650706     avg: 678820     median: 683897 (90%)     max: 701856 Points
10812 Points (1%)
min: 10349     avg: 10411     median: 10410.5 (1%)     max: 10472 Points
CrossMark - CrossMark Overall
min: 776     avg: 835     median: 849 (32%)     max: 864 Points
157%
A16 +
min: 1260     avg: 1307     median: 1329 (50%)     max: 1332 Points
135%
A15 +
min: 1132     avg: 1156     median: 1145 (43%)     max: 1190 Points
Power Consumption - Geekbench 5.5 Power Consumption 150cd *
7 Watt (3%)
192%
1 A16 +
min: 3.48     avg: 4.3     median: 3.7 (2%)     max: 6.25 Watt
Power Consumption - Idle Power Consumption 150cd 1min *
2.9 Watt (3%)
326%
1 A16 +
min: 0.776     avg: 1.3     median: 0.9 (1%)     max: 2.87 Watt

Average Benchmarks Apple A13 Bionic → 100% n=11

Average Benchmarks Apple A16 Bionic → 138% n=11

Average Benchmarks Apple A15 Bionic → 122% n=11

- Range of benchmark values for this graphics card
red legend - Average benchmark values for this graphics card
* Smaller numbers mean a higher performance
1 This benchmark is not used for the average calculation

v1.33
log 15. 10:50:45

#0 ran 0s before starting gpusingle class +0s ... 0s

#1 checking url part for id 11496 +0s ... 0s

#2 checking url part for id 14602 +0s ... 0s

#3 checking url part for id 13825 +0s ... 0s

#4 redirected to Ajax server, took 1755247845s time from redirect:0 +0s ... 0s

#5 did not recreate cache, as it is less than 5 days old! Created at Wed, 13 Aug 2025 05:18:40 +0200 +0s ... 0s

#6 composed specs +0.006s ... 0.006s

#7 did output specs +0s ... 0.006s

#8 getting avg benchmarks for device 11496 +0.001s ... 0.007s

#9 got single benchmarks 11496 +0.006s ... 0.013s

#10 getting avg benchmarks for device 14602 +0.001s ... 0.013s

#11 got single benchmarks 14602 +0.006s ... 0.02s

#12 getting avg benchmarks for device 13825 +0.001s ... 0.02s

#13 got single benchmarks 13825 +0.007s ... 0.027s

#14 got avg benchmarks for devices +0s ... 0.027s

#15 min, max, avg, median took s +0.028s ... 0.056s

#16 return log +0s ... 0.056s

Please share our article, every link counts!
Mail Logo
> Expert Reviews and News on Laptops, Smartphones and Tech Innovations > Benchmarks / Tech > Processor Comparison - Head 2 Head
Redaktion, 2017-09- 8 (Update: 2023-07- 1)