Review OCZ Vector 256 GB (VTR1-25SAT3-256G)

For the original German review, see here.
Indilinx was bought by OCZ in March 2011 to better control the quality of the SSDs that it was manufacturing. OCZ used to source the controller of its older Vertex SSDs (excluding the Vertex 4) from Sandforce. OCZ had very limited control over the quality of the firmware. Barefoot 2 was the first controller iteration that was introduced in the Vertex 4s. But the firmware was used on a Marvell chip and the SSDs did not find much traction with the consumer. ‘Barefoot 3’ has a lot of improvements that were needed to make the OCZ SSDs competitive.
Historically, OCZ has been selling a large number of SSDs by undercutting the prices of the competition. Now, they aim at the premium SSD market which requires the SSDs to offer excellent performance, quality and reliability. The Samsung SSD 840 Pro is currently one of the best performing SSDs and contains the tried and tested 25 nm MLC NAND flash chips. OCZ tries to follow suit by including similar innards but with its own controller, the ‘Barefoot 3’.
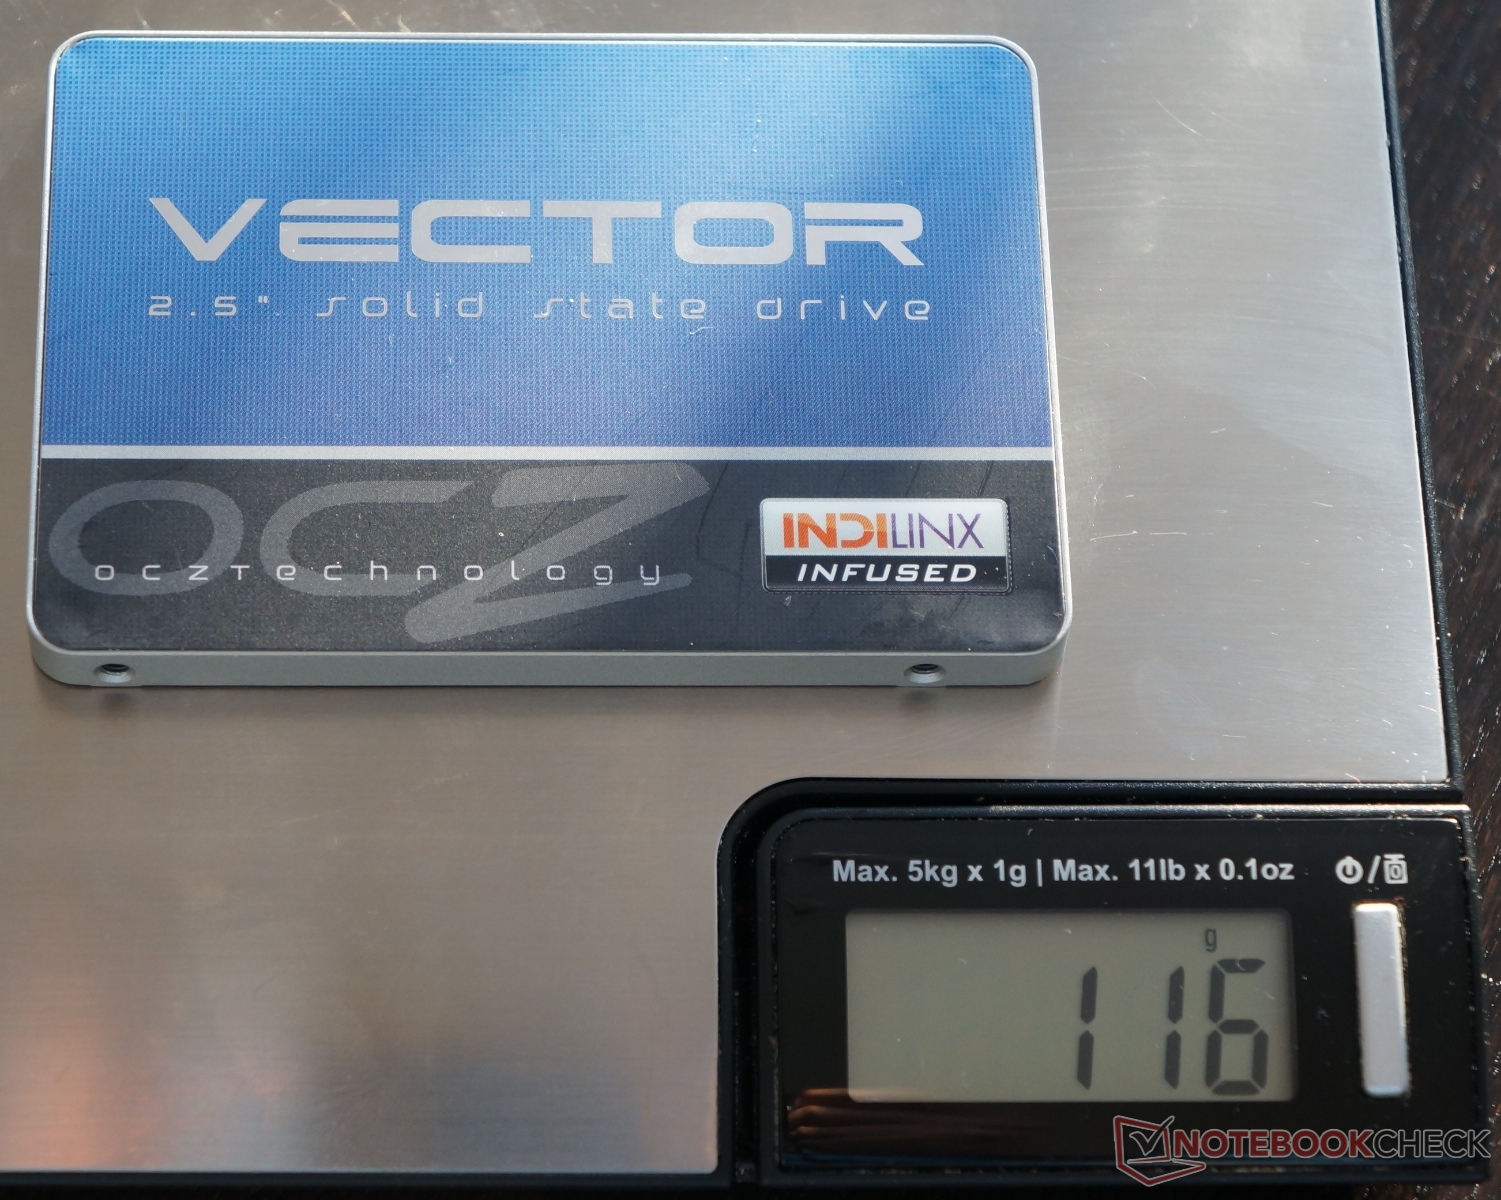
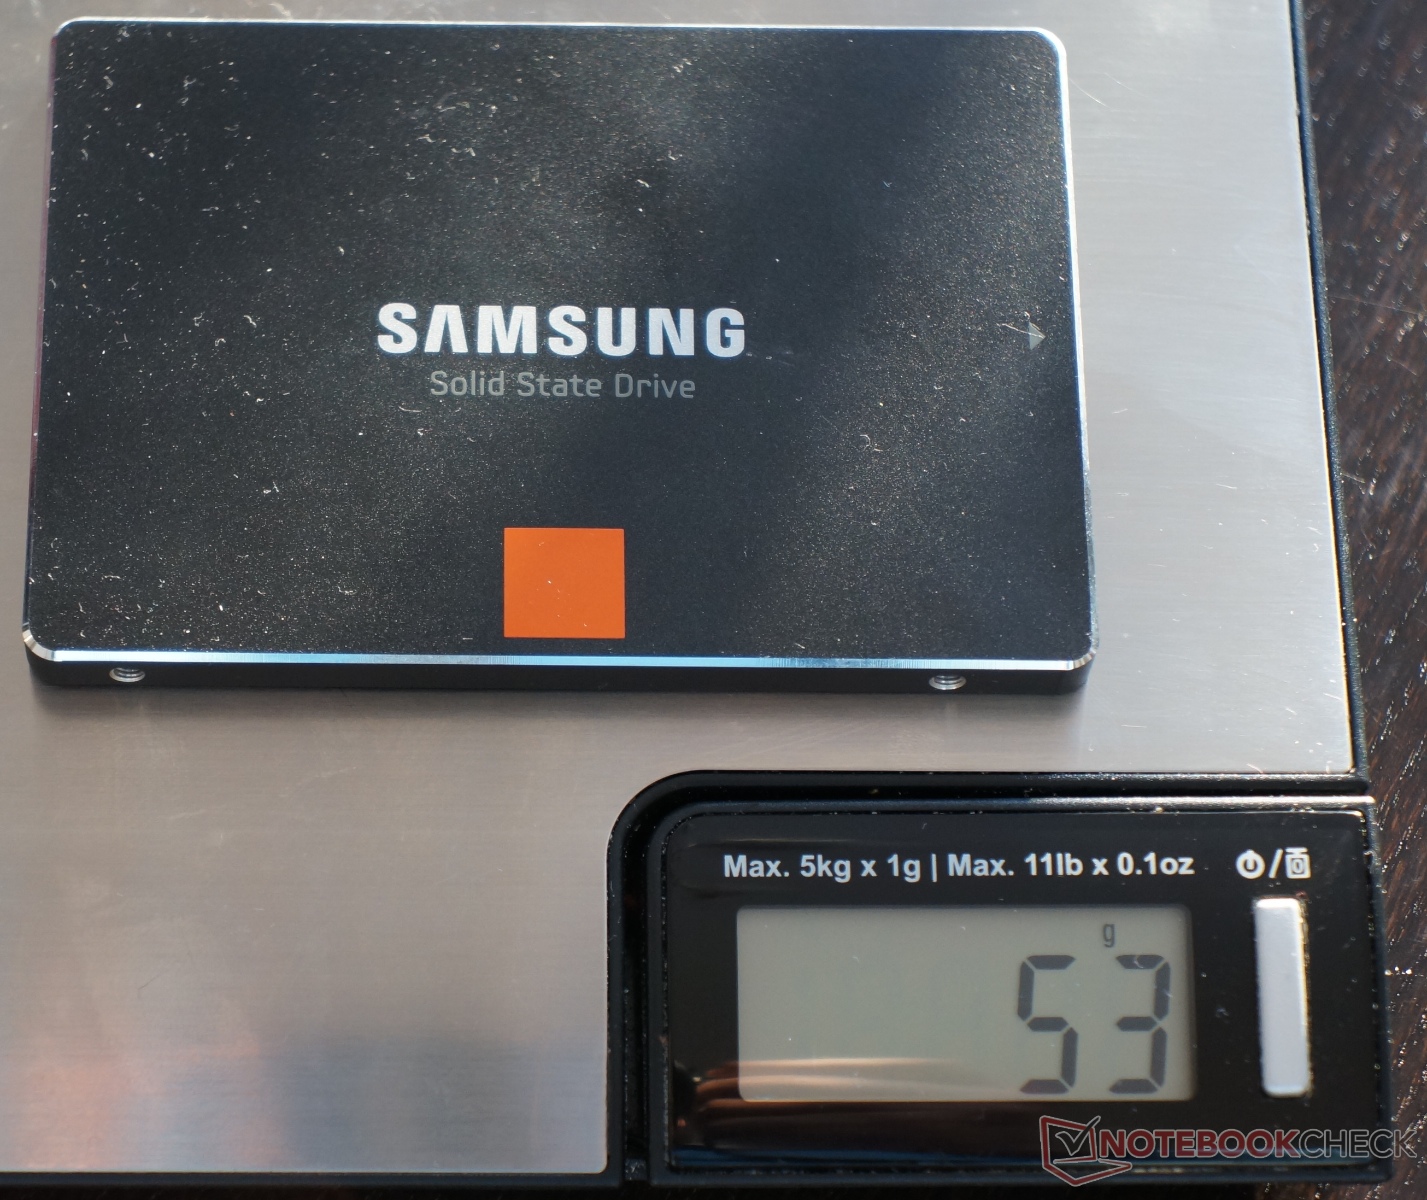
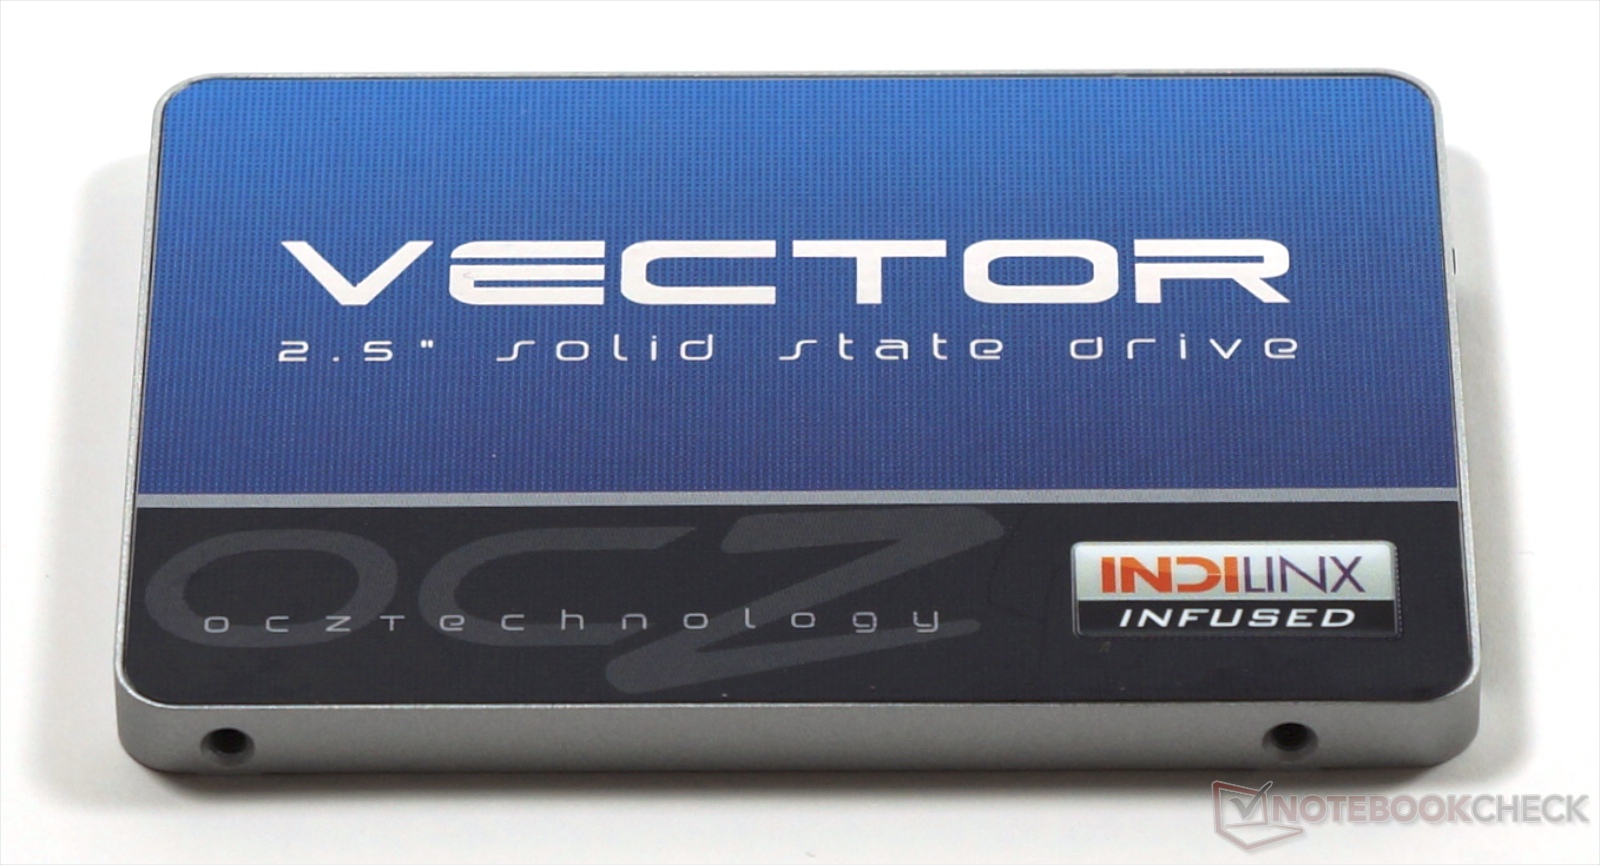
The Vector's design is simple. It comes in a heavy but stable metal case, with a label that has been well designed but haphazardly stuck on. On the scales, there is a pretty big weight disparity (116 g vs. 53 g, 4 oz vs. 1.9 oz), which is important above all for possible use in lightweight notebooks. The Samsung SSD is definitely the better looking and the much lighter device.
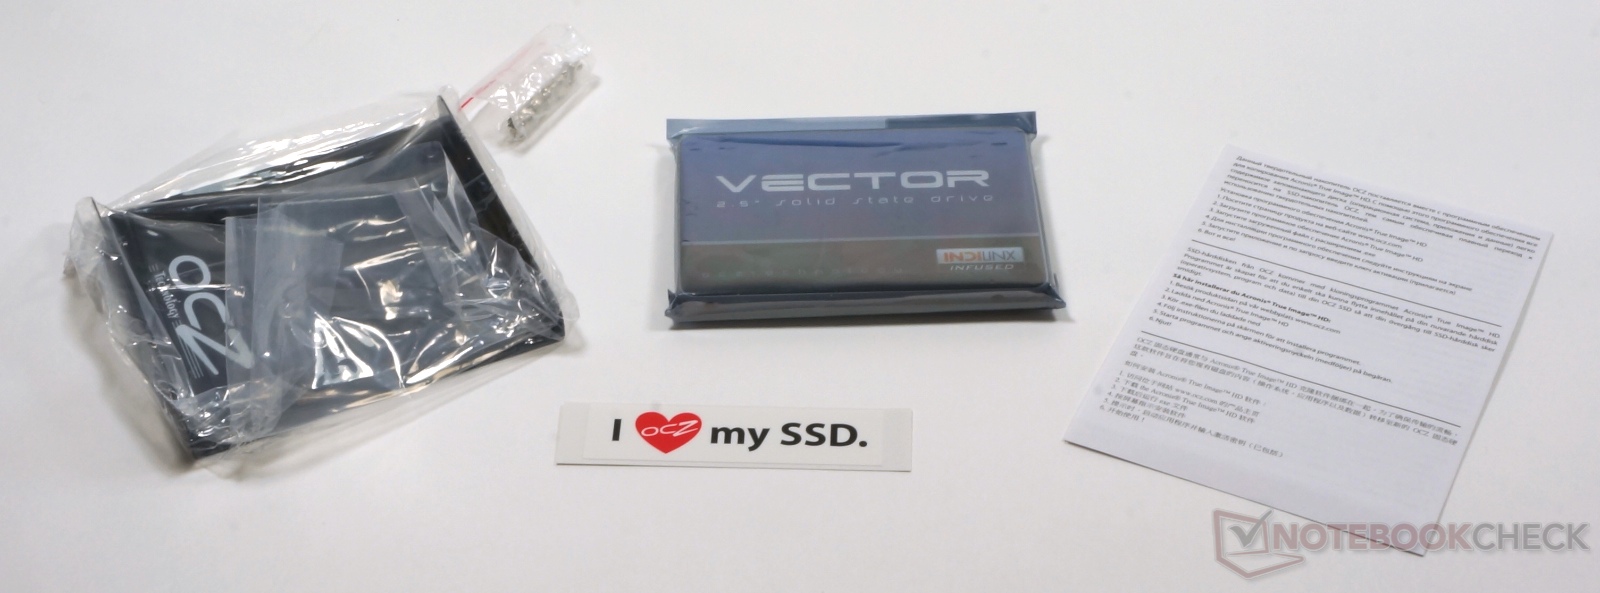
The OCZ Vector came with a 3.5-inch adapter with the necessary screws, a small information booklet and a sticker. The product also included the license for a copy of Acronis True Image Cloning software that is useful when trying to transfer data from the old HDD/SSD to the SSD.
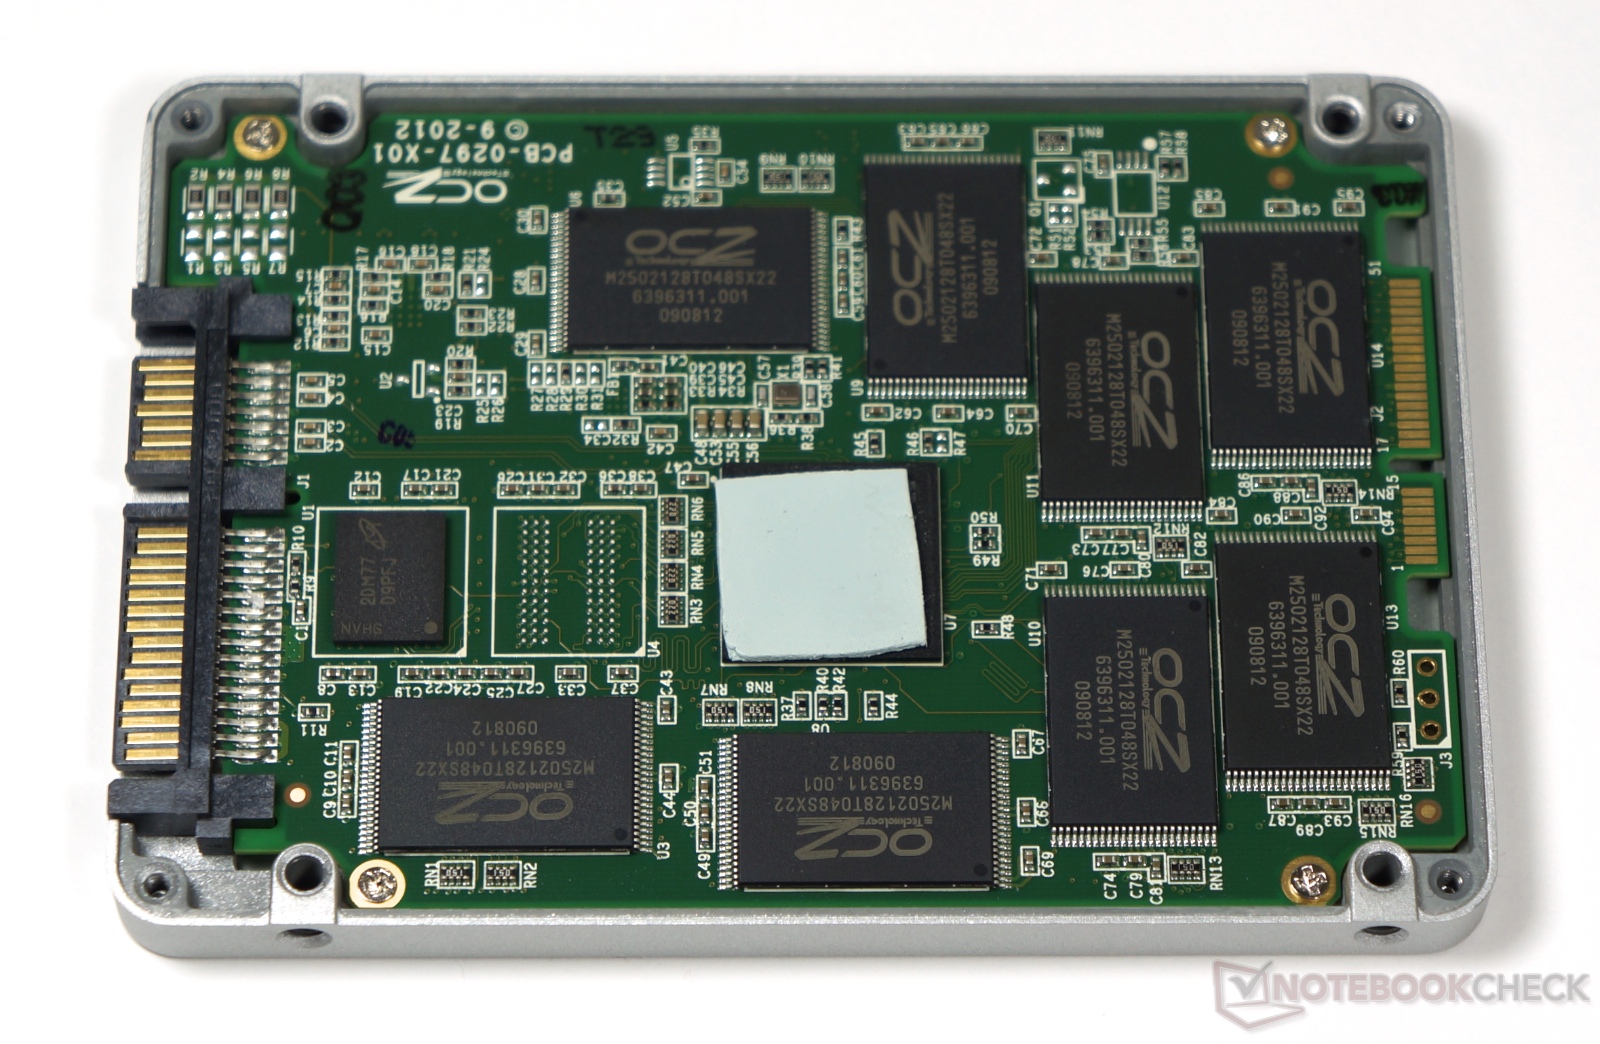
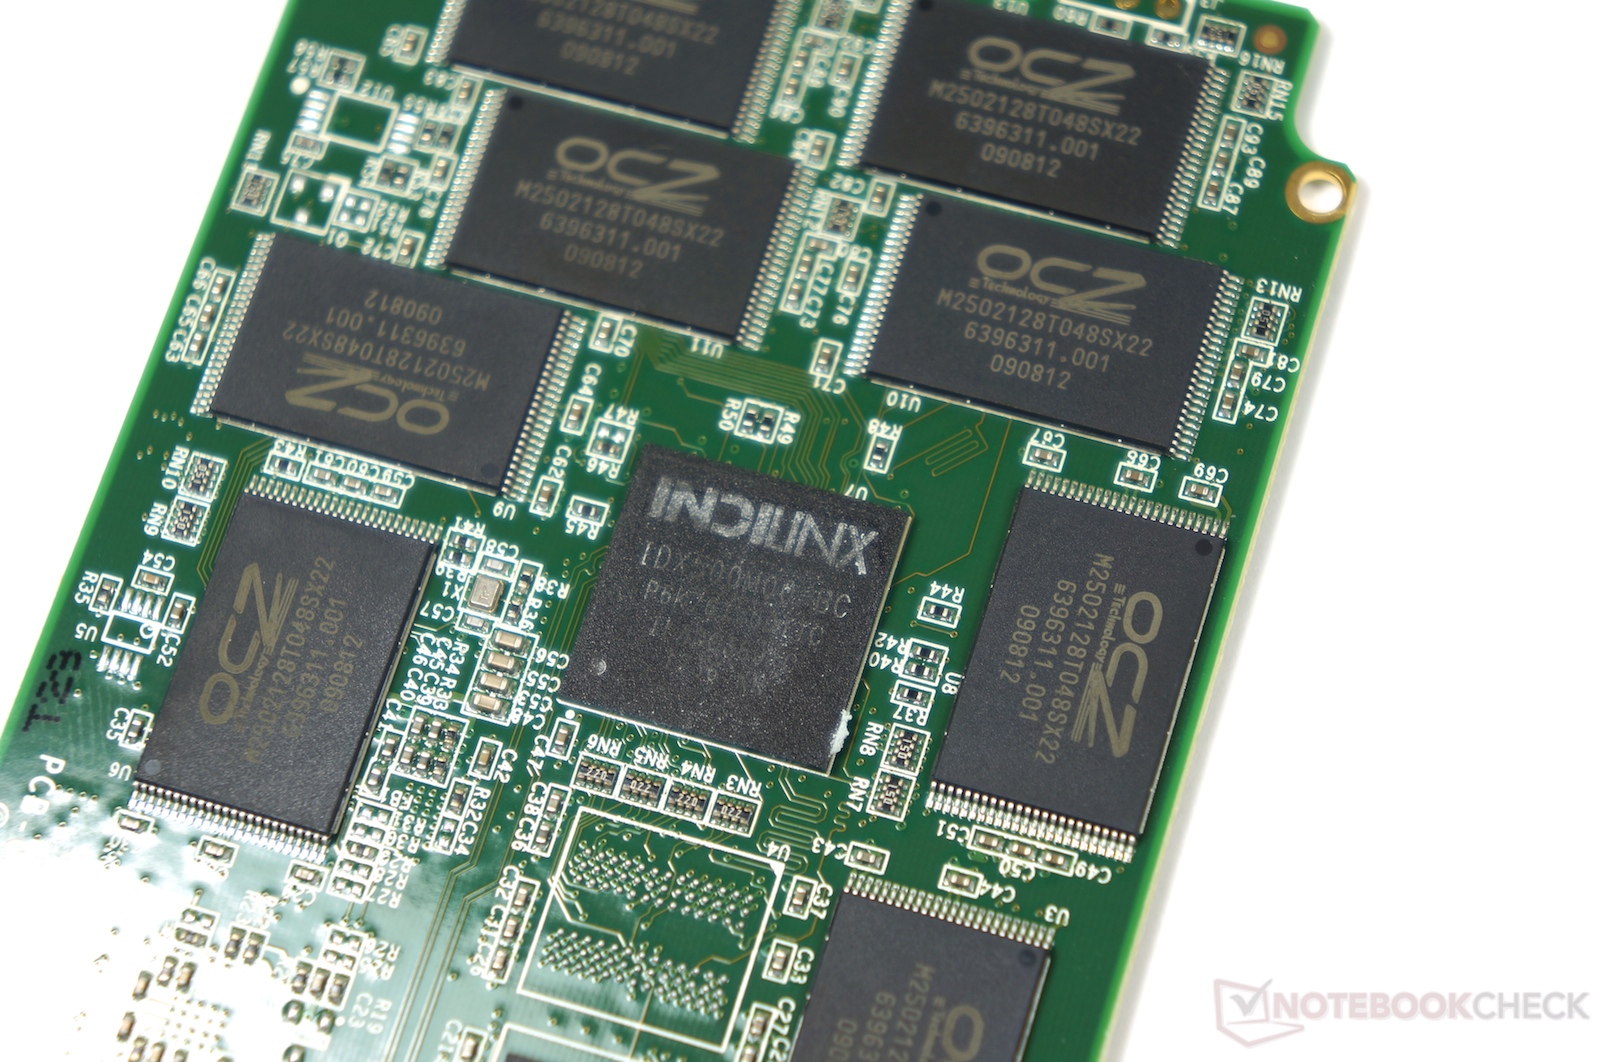
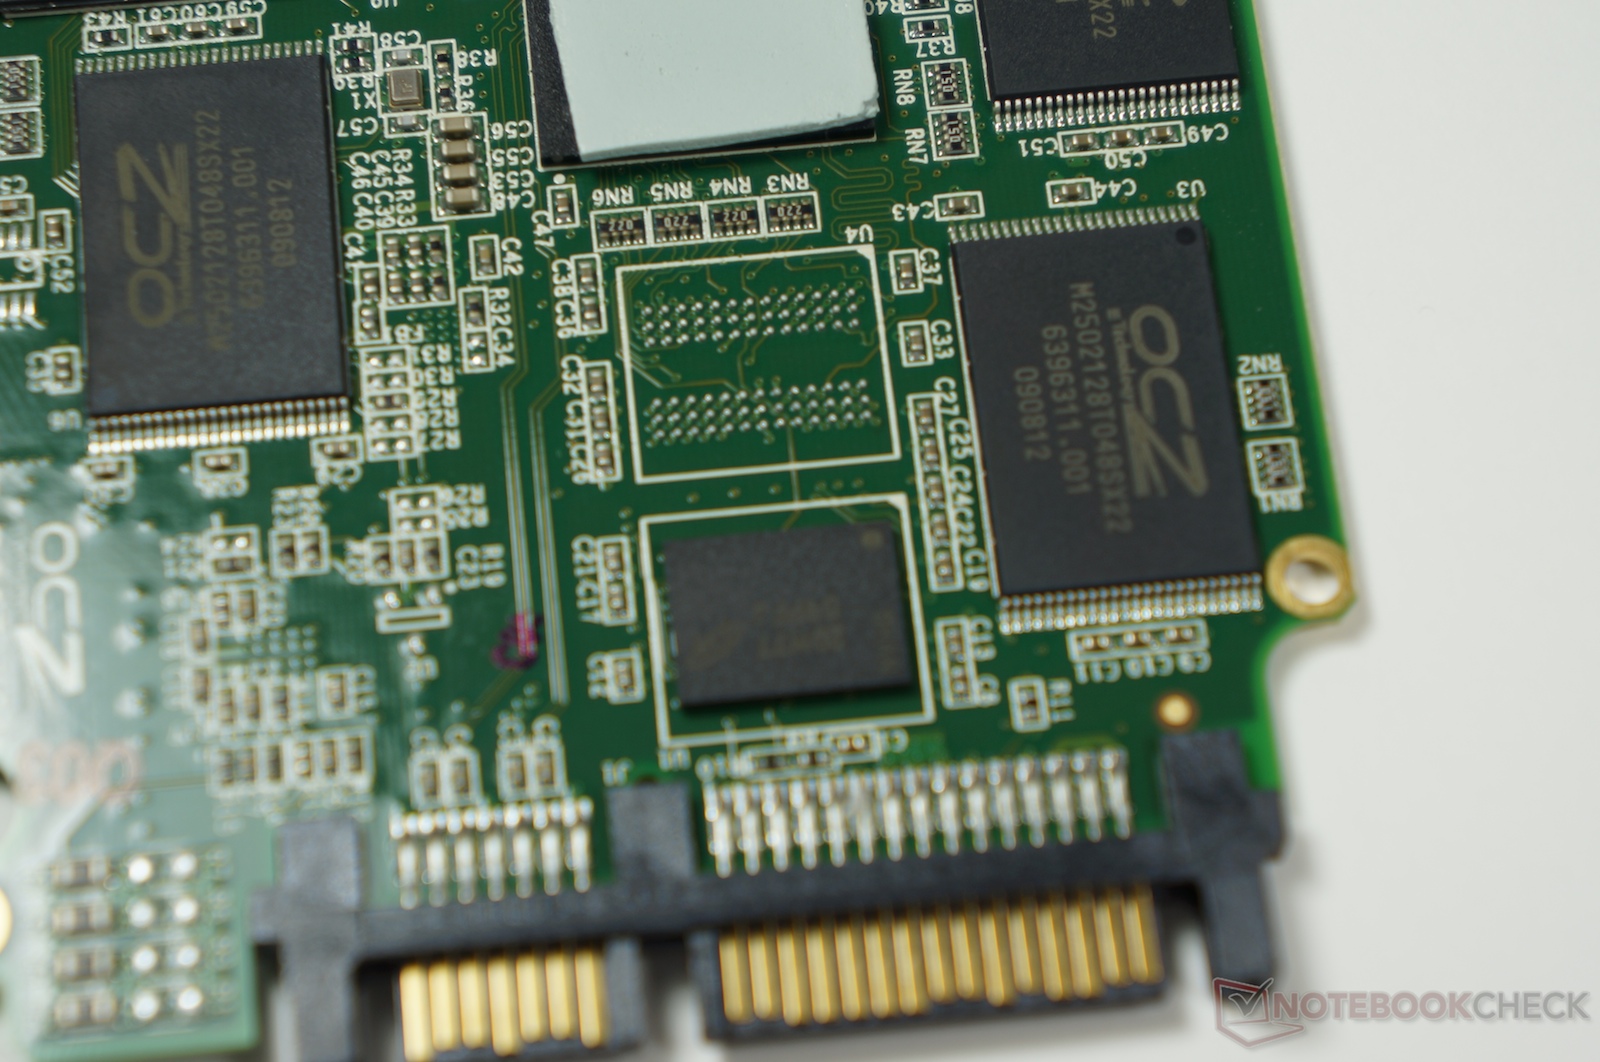
The new SATA 3.0 6 Gbit/s Indilinx 'Barefoot 3' Controller IDX50M00-BC is able to interact with the flash memory through 8 parallel data channels. Two 256 MB DDR3 DRAM chips by Micron act as cache for the controller. There is an open slot available on the PCB for a third chip. The Vector does not support automatic hardware encryption (AES). The 25 nm synchronous MLC NAND flash memory chips used in the SSD come from Intel Micron IMFT, but are cut and packed by OCZ themselves (hence the OCZ label).

Test System
Our test bed for the SSD was a desktop PC with an Intel Core i7-2600K (without overclocking), an Intel DP67BG mainboard, 8 GB DDR3 memory and an Nvidia GeForce GTX 470 graphics card. The SSD was placed in the SATA 3.0 6G Port 0 and was used with the Intel Rapid Storage driver 11.2.0.1006 under Windows 7 (64 bit).
Synthetic Benchmarks
Sequential transfer rates
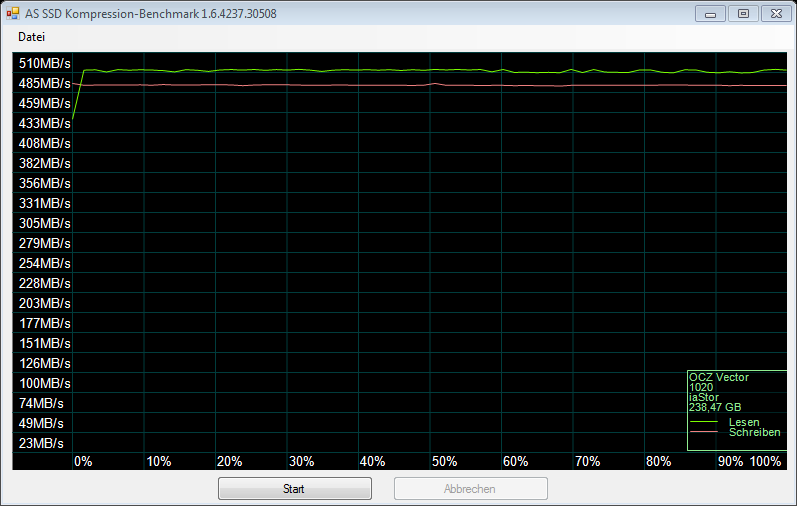
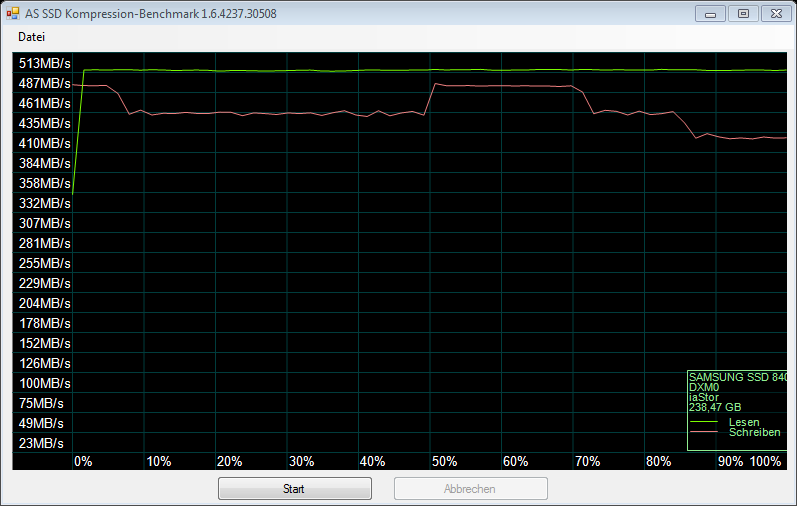
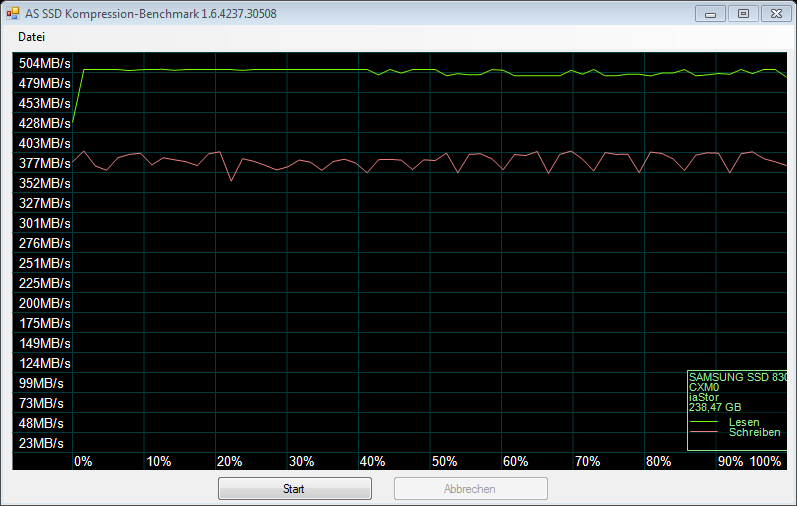
When it comes to sequential data transfer rates, the new Vector is one of the fastest SSDs out there. In the AS SSD benchmark (uses compressed data only) it is just faster than the Samsung 840 Pro. In the Crystal Disk Mark test, the ‘reads’ of the Vector fall behind that of the Samsung but the ‘writes’ are similar. Only in the HD Tune test does the Vector fall conspicuously behind the competition. It has to be noted that the Vertex 4 with the ‘Barefoot 2’ controller had similar problems in the same test.
Overall, the Vector is one of the fastest performing SSDs in the benchmarks and barely trails the Samsung 840 Pro.
| AS SSD | |
| Seq Read (sort by value) | |
| OCZ Vector 256 GB Desktop | |
| Samsung SSD 840 Pro 256 GB Desktop | |
| Samsung SSD 840 250 GB Desktop | |
| Samsung SSD 830 256 GB Desktop | |
| Intel SSD 520 Series 240GB Desktop | |
| OCZ Vertex 4 256 GB Desktop | |
| Seq Write (sort by value) | |
| OCZ Vector 256 GB Desktop | |
| Samsung SSD 840 Pro 256 GB Desktop | |
| Samsung SSD 840 250 GB Desktop | |
| Samsung SSD 830 256 GB Desktop | |
| Intel SSD 520 Series 240GB Desktop | |
| OCZ Vertex 4 256 GB Desktop | |
| CrystalDiskMark 3.0 | |
| Read Seq (sort by value) | |
| OCZ Vector 256 GB Desktop | |
| Samsung SSD 840 Pro 256 GB Desktop | |
| Samsung SSD 840 250 GB Desktop | |
| Samsung SSD 830 256 GB Desktop | |
| Intel SSD 520 Series 240GB Desktop | |
| OCZ Vertex 4 256 GB Desktop | |
| Read 512 (sort by value) | |
| OCZ Vector 256 GB Desktop | |
| Samsung SSD 840 Pro 256 GB Desktop | |
| Samsung SSD 840 250 GB Desktop | |
| Samsung SSD 830 256 GB Desktop | |
| Intel SSD 520 Series 240GB Desktop | |
| OCZ Vertex 4 256 GB Desktop | |
| Write Seq (sort by value) | |
| OCZ Vector 256 GB Desktop | |
| Samsung SSD 840 Pro 256 GB Desktop | |
| Samsung SSD 840 250 GB Desktop | |
| Samsung SSD 830 256 GB Desktop | |
| Intel SSD 520 Series 240GB Desktop | |
| OCZ Vertex 4 256 GB Desktop | |
| Write 512 (sort by value) | |
| OCZ Vector 256 GB Desktop | |
| Samsung SSD 840 Pro 256 GB Desktop | |
| Samsung SSD 840 250 GB Desktop | |
| Samsung SSD 830 256 GB Desktop | |
| Intel SSD 520 Series 240GB Desktop | |
| OCZ Vertex 4 256 GB Desktop | |
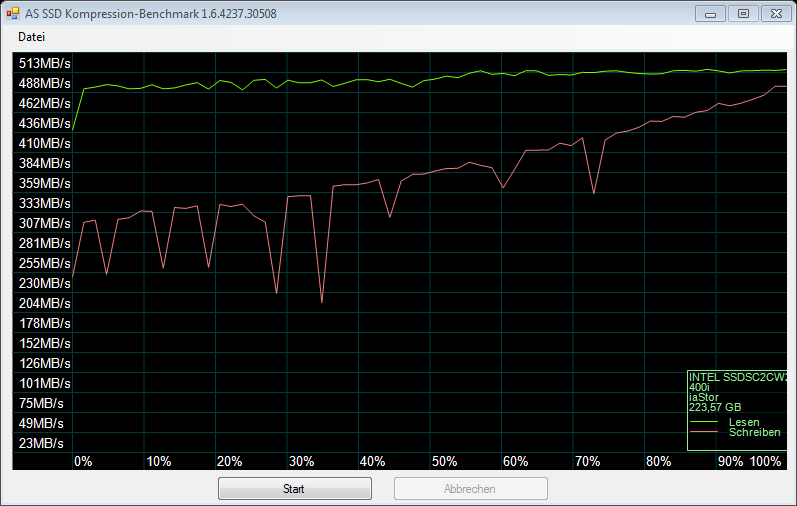
When you compare SSDs running the Sandforce SF-2xxx controllers with the Vector and the 840 Pro, the results are dependent on the type of data (compressed or uncompressed) that has been used in the tests. The results of the Intel SSD 520 clearly show how dependent the Sandforce controller is on compressible data in order to obtain maximum write speeds (dependency on type of data for read speeds is lower).
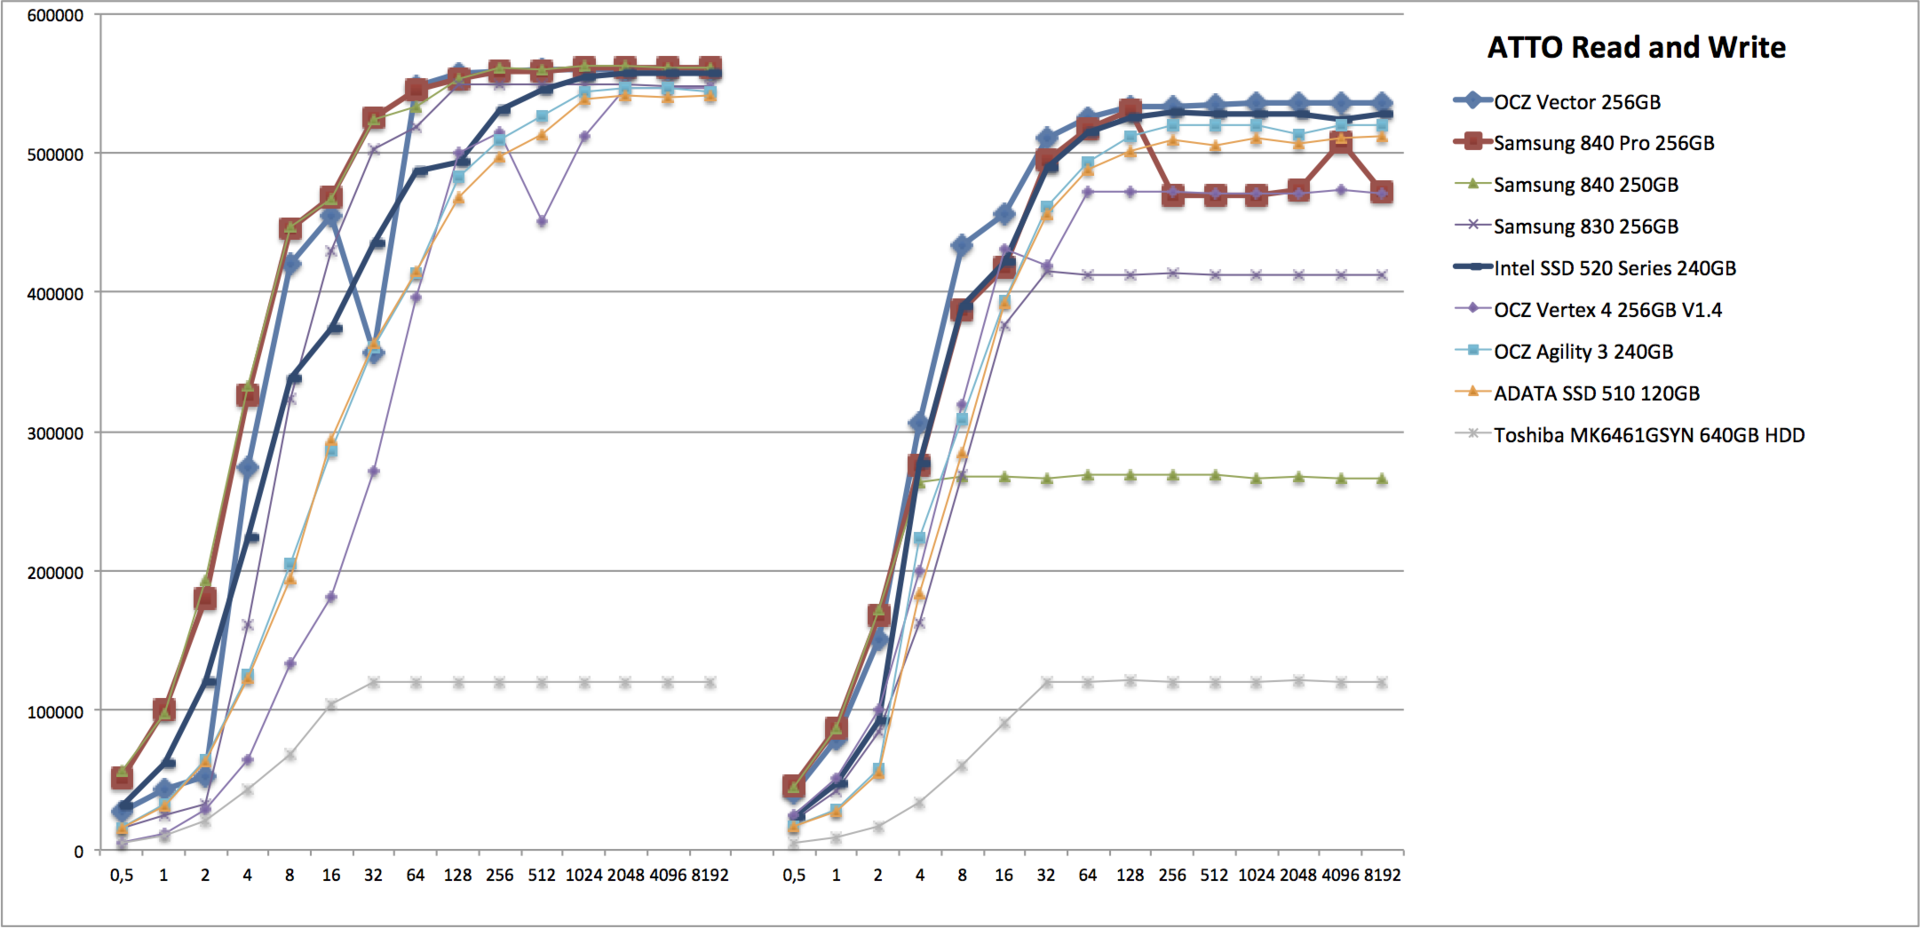
ATTO data rates
In the ATTO test, you can easily see the maximum transfer speeds for different block sizes. In the ’Read’ test, the Vector achieves the same outstanding results as the Samsung 840 Pro. There is a minor variance in the test results for the 32 KB block size.
In the ‘Write’ test, the Vector matches the performance of the Samsung 840 Pro and does overtake at certain points after the 4 KB run. Other than the hiccup in the test for read speeds, the Vector results are spectacular.
4K data rates
As far as the 4K data rates go, the Samsung SSD 840 Pro has about a 6% lead over the OCZ Vector. The Vertex 4 comes in behind the Vector with a similar gap in performance between them. The Samsung 840 Basic, Intel 520 and Samsung 830 make up the list in that order.
| AS SSD | |
| 4K Read (sort by value) | |
| OCZ Vector 256 GB Desktop | |
| Samsung SSD 840 Pro 256 GB Desktop | |
| Samsung SSD 840 250 GB Desktop | |
| Samsung SSD 830 256 GB Desktop | |
| Intel SSD 520 Series 240GB Desktop | |
| OCZ Vertex 4 256 GB Desktop | |
| 4K Write (sort by value) | |
| OCZ Vector 256 GB Desktop | |
| Samsung SSD 840 Pro 256 GB Desktop | |
| Samsung SSD 840 250 GB Desktop | |
| Samsung SSD 830 256 GB Desktop | |
| Intel SSD 520 Series 240GB Desktop | |
| OCZ Vertex 4 256 GB Desktop | |
| 4K-64 Read (sort by value) | |
| OCZ Vector 256 GB Desktop | |
| Samsung SSD 840 Pro 256 GB Desktop | |
| Samsung SSD 840 250 GB Desktop | |
| Samsung SSD 830 256 GB Desktop | |
| Intel SSD 520 Series 240GB Desktop | |
| OCZ Vertex 4 256 GB Desktop | |
| 4K-64 Write (sort by value) | |
| OCZ Vector 256 GB Desktop | |
| Samsung SSD 840 Pro 256 GB Desktop | |
| Samsung SSD 840 250 GB Desktop | |
| Samsung SSD 830 256 GB Desktop | |
| Intel SSD 520 Series 240GB Desktop | |
| OCZ Vertex 4 256 GB Desktop | |
| CrystalDiskMark 3.0 | |
| Read 4k (sort by value) | |
| OCZ Vector 256 GB Desktop | |
| Samsung SSD 840 Pro 256 GB Desktop | |
| Samsung SSD 840 250 GB Desktop | |
| Samsung SSD 830 256 GB Desktop | |
| Intel SSD 520 Series 240GB Desktop | |
| OCZ Vertex 4 256 GB Desktop | |
| Write 4k (sort by value) | |
| OCZ Vector 256 GB Desktop | |
| Samsung SSD 840 Pro 256 GB Desktop | |
| Samsung SSD 840 250 GB Desktop | |
| Samsung SSD 830 256 GB Desktop | |
| Intel SSD 520 Series 240GB Desktop | |
| OCZ Vertex 4 256 GB Desktop | |
| Read 4k QD32 (sort by value) | |
| OCZ Vector 256 GB Desktop | |
| Samsung SSD 840 Pro 256 GB Desktop | |
| Samsung SSD 840 250 GB Desktop | |
| Samsung SSD 830 256 GB Desktop | |
| Intel SSD 520 Series 240GB Desktop | |
| OCZ Vertex 4 256 GB Desktop | |
| Write 4k QD32 (sort by value) | |
| OCZ Vector 256 GB Desktop | |
| Samsung SSD 840 Pro 256 GB Desktop | |
| Samsung SSD 840 250 GB Desktop | |
| Samsung SSD 830 256 GB Desktop | |
| Intel SSD 520 Series 240GB Desktop | |
| OCZ Vertex 4 256 GB Desktop | |
Access times
The new OCZ Vector achieves extraordinary results for access time in the AS SSD benchmark. The Vector shows slower access times for writes than the Vertex 4 only. The Vertex 4, however, had clear weaknesses when it came to read access times. Once again, the Vector is one of the top performers in this test overall.
| AS SSD | |
| Access Time Read (sort by value) | |
| OCZ Vector 256 GB Desktop | |
| Samsung SSD 840 Pro 256 GB Desktop | |
| Samsung SSD 840 250 GB Desktop | |
| Samsung SSD 830 256 GB Desktop | |
| Intel SSD 520 Series 240GB Desktop | |
| OCZ Vertex 4 256 GB Desktop | |
| Access Time Write (sort by value) | |
| OCZ Vector 256 GB Desktop | |
| Samsung SSD 840 Pro 256 GB Desktop | |
| Samsung SSD 840 250 GB Desktop | |
| Samsung SSD 830 256 GB Desktop | |
| Intel SSD 520 Series 240GB Desktop | |
| OCZ Vertex 4 256 GB Desktop | |
* ... smaller is better
PCMark System Performance
We measure the SSD application performance with help of PCMark Vantage and the newer PCMark 7 benchmarks.
In the newer PCMark 7, the Vector has the highest result of all the SSDs tested in the system. The Samsung 840 Pro is behind by only 2%. The 840 Pro clambers over the Vector in the System Storage subtest by 3%. The fastest tested storage unit is incidentally found in the Asus UX51VZ with two ADATA XM11 SSDs (in RAID). But the three percent lead isn't terribly large.
In the older PCMark Vantage benchmark, the Vector falls behind the older Samsung SSD 830 and the Intel 520 SSD in terms of overall scores. The difference in scores between the Vector and the Samsung 840 Pro are miniscule at best. The ’premium’ SSDs all huddle together in a 7 percent variance window with hardly any noticeable differences. In the HDD sub-score, the Vector is positioned right behind the 840 Pro once again, which is faster by 9%.
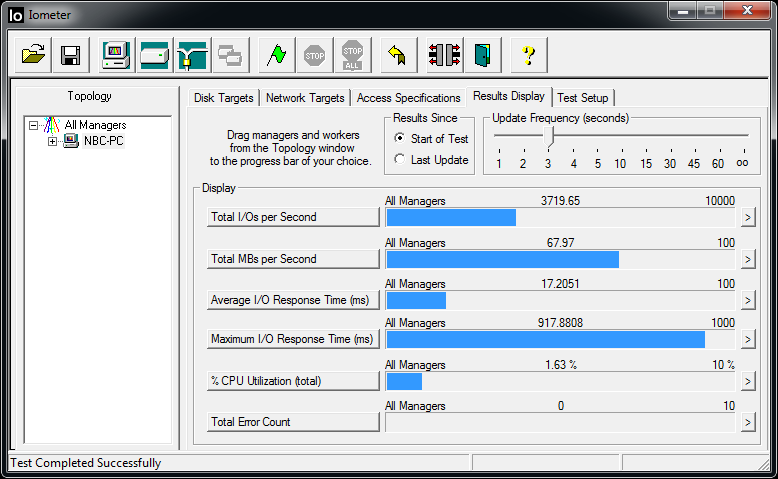
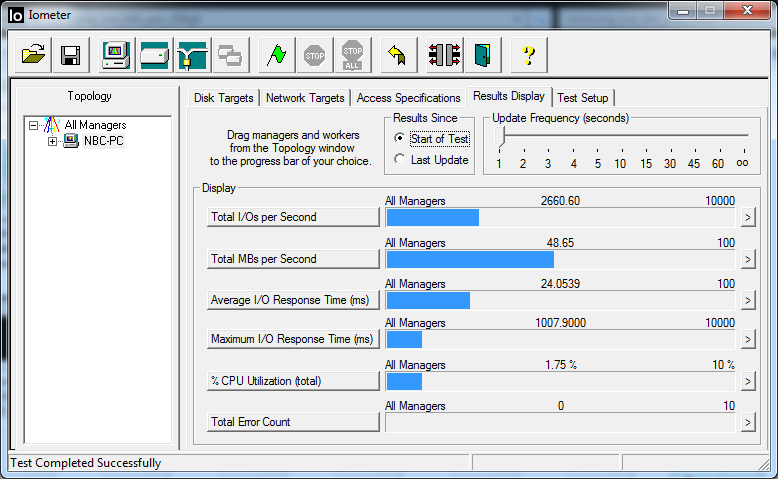
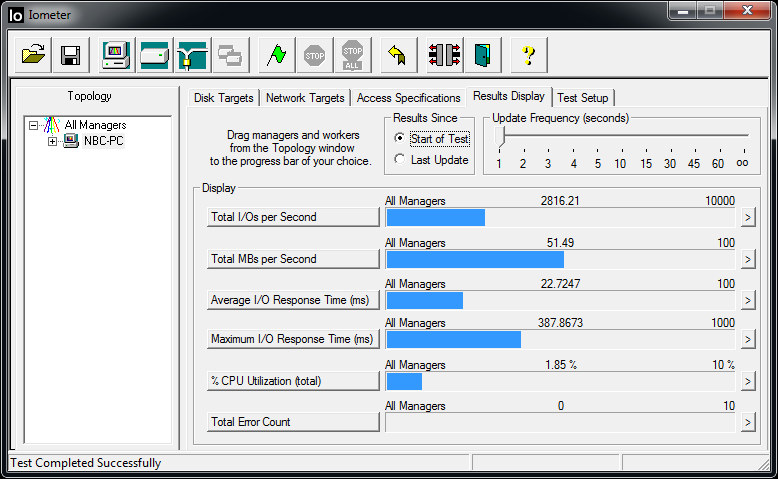
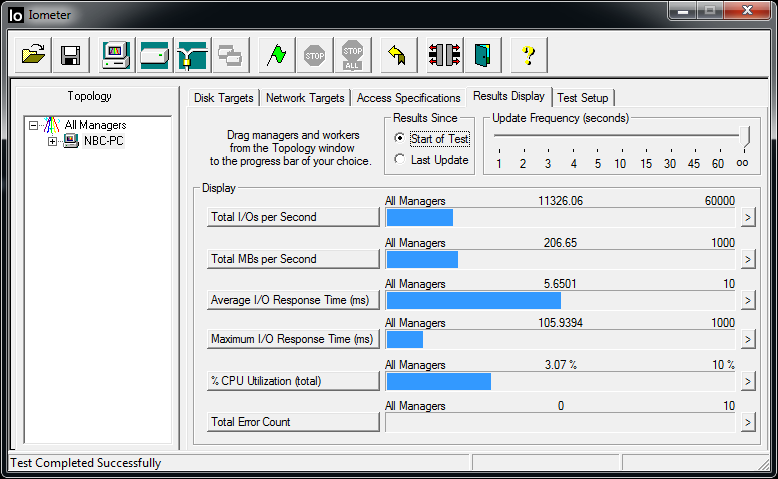
Application Profiles with IOMeter
You can also test the practical performance of an SSD with the "IOMix" - c`t Application profile and "Workstation" for the IOMeter software. Both are access profiles that try and simulate realistic usage of the SSD by regular users (IOMix) and/or a workstation. In both tests, the Vector comes away with another win in this test. Even the fast Intel SSD 520 and the Vertex 4 are clearly trumped by the Vector.
| IOMeter | |
| Workstation, 3min, 10GB Partition (sort by value) | |
| OCZ Vector 256 GB Desktop | |
| Samsung SSD 840 Pro 256 GB Desktop | |
| Samsung SSD 840 250 GB Desktop | |
| Samsung SSD 830 256 GB Desktop | |
| Intel SSD 520 Series 240GB Desktop | |
| OCZ Vertex 4 256 GB Desktop | |
| IOMix, 5min, 10GB Partition (sort by value) | |
| OCZ Vector 256 GB Desktop | |
| Samsung SSD 840 Pro 256 GB Desktop | |
| Samsung SSD 840 250 GB Desktop | |
| Samsung SSD 830 256 GB Desktop | |
| Intel SSD 520 Series 240GB Desktop | |
| OCZ Vertex 4 256 GB Desktop | |
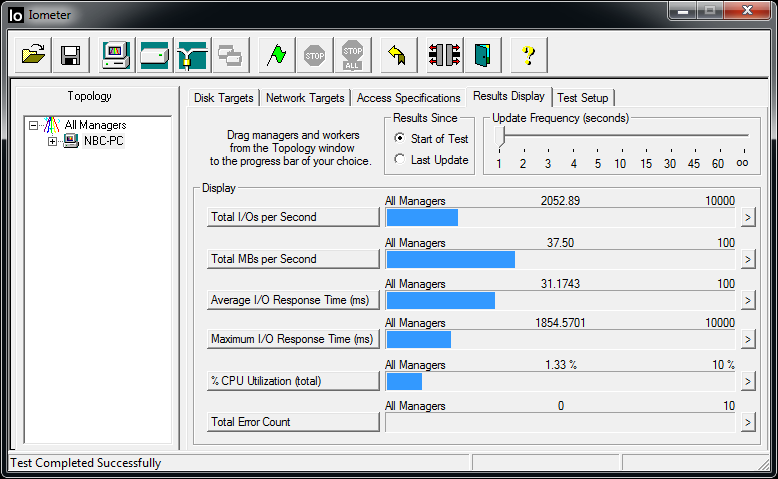
Resistance to Performance Drops
OCZ advertises the Vector as being especially resistant to drops in performance (lags/latency) when heavily loaded. In order to test this, we put SSDs through a stress test with the IOMix profile. In this test, data is written to the SSD and read repeatedly for 60 minutes. At 68 MB/s, the Vector's results are distinctly ahead of those of the Samsung SSDs (830, 840 Pro and 840). But thanks to over-provisioning, the Intel 520 Series with a Sandforce controller and larger memory reserves is clearly ahead with a result 200 MB/s taking the top spot.
Over-provisioning is a method employed by SSD manufacturers to extend the life of the SSD flash modules. It is not represented in the total available space for use. It helps in the distribution of writes and erases throughout the NAND chips and also provides a buffer for the controller to manage the writes and erase cycles. During garbage collection, over-provisioning reduces write amplification when the controller writes to the memory. The Samsung 840 Basic also has more free memory space available, which explains its minor lead over the 840 Pro.
Practical Tests
For our practical tests, we use the good ol' stopwatch to examine the performance of the SSD as a system disk. Looking at the booting of Windows 7, you can hardly tell the difference between all the SSDs. The boot times for the Samsung 830, Intel 520 and the Vector are all between 33 and 34 seconds. According to our tests, the older Samsung 470 needed one second longer to boot to the desktop.
In the copying of gaming files from the folder containing Supreme Commander - Forged Alliance, the Vector doesn't really do well when you compare it to other SSDs. The folder is 7.29 GB in size and contains 2101 files. In duplicating data on the SSD, the Vector "only" achieves the results of the Intel 520 and OCZ Vertex 4 (though the Vertex gave us varying results). Still the undisputed winner is the older Samsung 830 with an average of 42 seconds (followed by the 840 Pro in about 43-45 seconds). Older SATA 2 SSDs like the Samsung 470 need one to two minutes to complete this test.
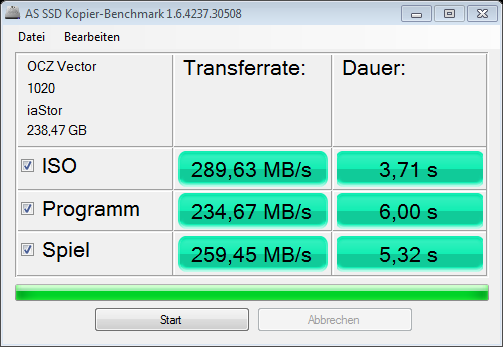
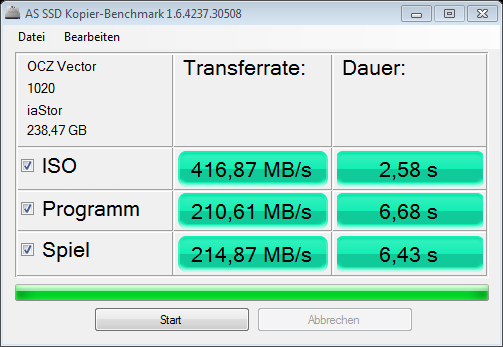
In the AS SSD copying benchmark, the Vector, like the Samsung 840 Pro, doesn't give a consistent result. At its best, the Vector does slightly better than the Samsung 840 Pro in all the subtests, but its weakest results lie distinctly lower than the weakest results of the 840 Pro.
In starting the single-player mode of Battlefield 3, all the modern SSDs need about 19-20 seconds. Even the old Samsung 470 needs a maximum of one second longer. In comparison, a traditional Toshiba MK6461GSYN 640 GB 7200rpm notebook hard drive needs 72 seconds for the same task.


| AS SSD | |
| Copy Game MB/s (sort by value) | |
| OCZ Vector 256 GB Desktop | |
| Samsung SSD 840 Pro 256 GB Desktop | |
| Samsung SSD 840 250 GB Desktop | |
| Samsung SSD 830 256 GB Desktop | |
| Intel SSD 520 Series 240GB Desktop | |
| OCZ Vertex 4 256 GB Desktop | |
| Copy Program MB/s (sort by value) | |
| OCZ Vector 256 GB Desktop | |
| Samsung SSD 840 Pro 256 GB Desktop | |
| Samsung SSD 840 250 GB Desktop | |
| Samsung SSD 830 256 GB Desktop | |
| Intel SSD 520 Series 240GB Desktop | |
| OCZ Vertex 4 256 GB Desktop | |
| Copy ISO MB/s (sort by value) | |
| OCZ Vector 256 GB Desktop | |
| Samsung SSD 840 Pro 256 GB Desktop | |
| Samsung SSD 840 250 GB Desktop | |
| Samsung SSD 830 256 GB Desktop | |
| Intel SSD 520 Series 240GB Desktop | |
| OCZ Vertex 4 256 GB Desktop | |
Power Consumption
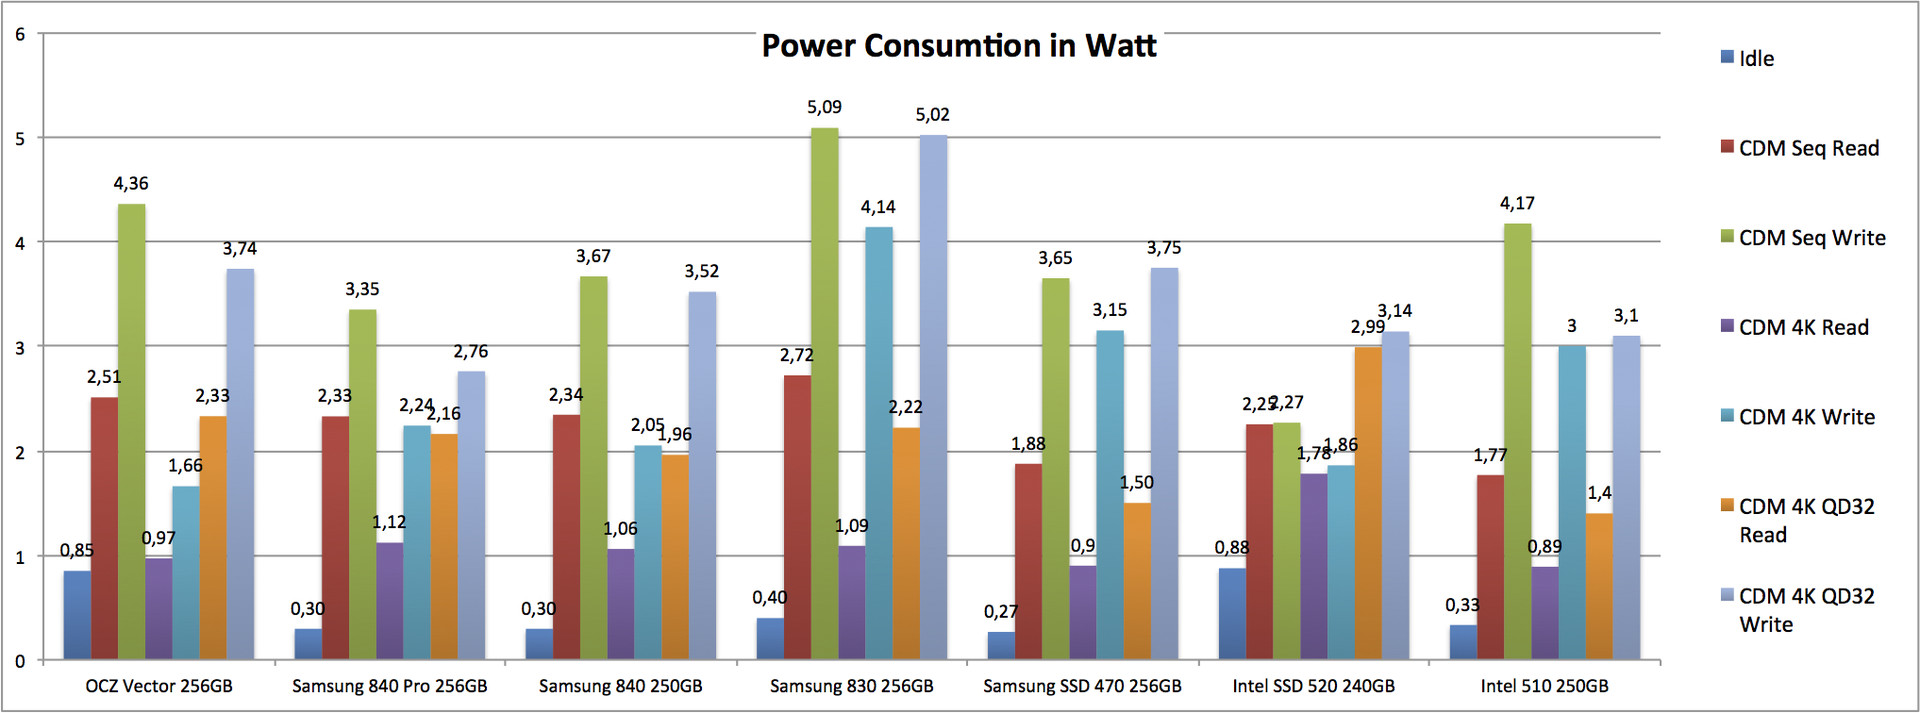
We test the SSD power consumption with two multi-meters on the same desktop used to conduct our benchmark tests. Unfortunately the system doesn't offer any DMPI support, though all notebooks do, which means the power consumption in idle mode doesn't fall like it can in mobile systems (so far we only know of the Samsung SSD 840 Series that takes full advantage of this and drops to 0.04 Watts).
On average, taking all measured values into account, the OCZ Vector does extraordinarily well - coming in in second place, right behind the Samsung SSD 840 Pro. Unfortunately for notebook users, there's a slight drawback. Without load, the power consumption level is considerably higher than that of the competition. Since this load state is the most common in mobile use, this is clearly reflected in the results.
Verdict
The OCZ Vector is OCZ's first ’premium’ SSD with its own controller (software and hardware). The performance measurements in our test system speak for themselves and are, on average, at the same level as the Samsung SSD 840 Pro. The Vector makes an excellent impression, especially when using the application profiles IOMix and Workstation in the IOMeter and the PCMark 7 test. The relatively small performance drop in the stress test is also a clear plus factor.
The relatively high weight and the high idle power consumption unfortunately disqualify the Vector for use in lightweight subnotebooks.
Price-wise, the Vector currently sells at around the same price as the Samsung 840 Pro, making it cheaper than the Intel 520.
As is always the case, when new controllers are introduced, reliability is unknown. The Vector has to prove its reliability. But with a 5-year warranty, OCZ strongly expresses their confidence in the Vector.
In conclusion, the Vector is a very good product from OCZ that sets bar high in many areas and is especially suited for use in desktop machines.
Appendix
In the following table, we present all the test values in comparison to the Samsung SSD 840 Pro, the Intel SSD 520 and the Vertex 4. On average, the 840 Pro just barely supersedes the Vector 256 GB. You can clearly see the improvement in performance in comparison to the old OCZ Vertex 4.
| OCZ Vector 256 GB Desktop GeForce GTX 470, 2600K, OCZ Vector 256 GB | Samsung SSD 840 Pro 256 GB Desktop GeForce GTX 470, 2600K, Samsung SSD 840 Pro 256GB MZ7PD256HAFV-0Z000 | Intel SSD 520 Series 240GB Desktop GeForce GTX 470, 2600K, Intel SSD 520 Series SSDSC2CW240A | OCZ Vertex 4 256 GB Desktop GeForce GTX 470, 2600K, OCZ Vertex 4 256 GB VTX4-25SAT3-256G | |
|---|---|---|---|---|
| PCMark 7 | 0% | -0% | -4% | |
| System Storage (Points) | 5371 | 5519 3% | 5216 -3% | 5085 -5% |
| Computation (Points) | 4658 | 4589 -1% | 4962 7% | 4573 -2% |
| Creativity (Points) | 5401 | 5405 0% | 5310 -2% | 5176 -4% |
| Entertainment (Points) | 4823 | 4700 -3% | 4739 -2% | 4662 -3% |
| Productivity (Points) | 4782 | 4905 3% | 4808 1% | 4611 -4% |
| Lightweight (Points) | 5172 | 5236 1% | 5068 -2% | 4900 -5% |
| Score (Points) | 5028 | 4945 -2% | 4941 -2% | 4835 -4% |
| IOMeter | -43% | -27% | -20% | |
| Workstation, 3min, 10GB Partition (MB/s) | 269 | 135.8 -50% | 165.7 -38% | 225.2 -16% |
| IOMix, 5min, 10GB Partition (MB/s) | 275 | 177.5 -35% | 230.2 -16% | 211.9 -23% |
| ATTO Disk Benchmark | 17% | -1% | -26% | |
| 8192KB write (KB/s) | 535680 | 468882 -12% | 527637 -2% | 470939 -12% |
| 4096KB write (KB/s) | 535532 | 474058 -11% | 523776 -2% | 473014 -12% |
| 2048KB write (KB/s) | 535532 | 468882 -12% | 527637 -1% | 470939 -12% |
| 1024KB write (KB/s) | 535532 | 470939 -12% | 527637 -1% | 470939 -12% |
| 512KB write (KB/s) | 534199 | 467424 -13% | 527637 -1% | 470939 -12% |
| 256KB write (KB/s) | 532634 | 468532 -12% | 528689 -1% | 471628 -11% |
| 128KB write (KB/s) | 532634 | 528689 -1% | 524802 -1% | 471859 -11% |
| 64KB write (KB/s) | 524802 | 518914 -1% | 512507 -2% | 471986 -10% |
| 32KB write (KB/s) | 510722 | 493887 -3% | 489443 -4% | 419037 -18% |
| 16KB write (KB/s) | 455901 | 419037 -8% | 421028 -8% | 431325 -5% |
| 8KB write (KB/s) | 433373 | 389865 -10% | 389865 -10% | 319635 -26% |
| 4KB write (KB/s) | 306323 | 275937 -10% | 276959 -10% | 199753 -35% |
| 2KB write (KB/s) | 150601 | 170655 13% | 92477 -39% | 100388 -33% |
| 1KB write (KB/s) | 78884 | 90690 15% | 46986 -40% | 50944 -35% |
| 0.5KB write (KB/s) | 40832 | 45454 11% | 23757 -42% | 25216 -38% |
| 8192KB read (KB/s) | 559240 | 560538 0% | 556663 0% | 546588 -2% |
| 4096KB read (KB/s) | 559240 | 560538 0% | 556663 0% | 546588 -2% |
| 2048KB read (KB/s) | 559240 | 560538 0% | 556663 0% | 546588 -2% |
| 1024KB read (KB/s) | 559240 | 560538 0% | 554109 -1% | 512525 -8% |
| 512KB read (KB/s) | 559240 | 556663 0% | 545354 -2% | 481498 -14% |
| 256KB read (KB/s) | 557784 | 557784 0% | 529998 -5% | 514709 -8% |
| 128KB read (KB/s) | 557104 | 553047 -1% | 492676 -12% | 500029 -10% |
| 64KB read (KB/s) | 547777 | 545078 0% | 486146 -11% | 397109 -28% |
| 32KB read (KB/s) | 356554 | 527106 48% | 434335 22% | 271203 -24% |
| 16KB read (KB/s) | 454764 | 467021 3% | 373701 -18% | 181554 -60% |
| 8KB read (KB) | 420035 | 446592 6% | 337950 -20% | 133549 -68% |
| 4KB read (KB) | 274916 | 326803 19% | 223854 -19% | 64191 -77% |
| 2KB read (KB) | 52213 | 178761 242% | 120356 131% | 28682 -45% |
| 1KB read (KB) | 43264 | 105508 144% | 62208 44% | 11883 -73% |
| 0.5KB read (KB/s) | 27136 | 56448 108% | 30976 14% | 5476 -80% |
| AS SSD | 1% | -61% | -16% | |
| Copy Game MB/s (MB/s) | 274 | 269 -2% | 214 -22% | 229 -16% |
| Copy Program MB/s (MB/s) | 247 | 222 -10% | 143.9 -42% | 196 -21% |
| Copy ISO MB/s (MB/s) | 448 | 429 -4% | 368 -18% | 347 -23% |
| Score Total (Points) | 1100 | 1165 6% | 802 -27% | 1052 -4% |
| Score Write (Points) | 432 | 453 5% | 339 -22% | 429 -1% |
| Score Read (Points) | 438 | 465 6% | 309 -29% | 408 -7% |
| Access Time Write * (ms) | 0.04 | 0.046 -15% | 0.212 -430% | 0.03 25% |
| Access Time Read * (ms) | 0.049 | 0.056 -14% | 0.126 -157% | 0.13 -165% |
| 4K-64 Write (MB/s) | 302 | 329 9% | 231.8 -23% | 306 1% |
| 4K-64 Read (MB/s) | 362 | 381 5% | 236.2 -35% | 332 -8% |
| 4K Write (MB/s) | 79.3 | 73.5 -7% | 72 -9% | 76.7 -3% |
| 4K Read (MB/s) | 24.38 | 32.3 32% | 24.41 0% | 26.3 8% |
| Seq Write (MB/s) | 500 | 498 0% | 288.4 -42% | 459 -8% |
| Seq Read (MB/s) | 516 | 513 -1% | 496.1 -4% | 503 -3% |
| CrystalDiskMark 3.0 | 4% | -19% | -10% | |
| Write 4k QD32 (MB/s) | 372 | 370 -1% | 266.3 -28% | 342 -8% |
| Read 4k QD32 (MB/s) | 383 | 402 5% | 239.9 -37% | 349 -9% |
| Write 4k (MB/s) | 103 | 88.9 -14% | 91.2 -11% | 85 -17% |
| Read 4k (MB/s) | 27.8 | 35.7 28% | 29.74 7% | 29.6 6% |
| Write 512 (MB/s) | 506 | 501 -1% | 299.5 -41% | 470 -7% |
| Read 512 (MB/s) | 438 | 471 8% | 441.2 1% | 308 -30% |
| Write Seq (MB/s) | 514 | 513 0% | 307.8 -40% | 470 -9% |
| Read Seq (MB/s) | 513 | 531 4% | 497.7 -3% | 486 -5% |
| HD Tune Transfer Rate Minimum | ||||
| Transfer Rate Minimum (MB/s) | 288 | 400 39% | 356.8 24% | 238 -17% |
| HD Tune Transfer Rate Maximum | ||||
| Transfer Rate Maximum (MB/s) | 305 | 417 37% | 405.8 33% | 283 -7% |
| HD Tune Transfer Rate Average | ||||
| Transfer Rate Average (MB/s) | 295 | 414 40% | 376.2 28% | 271 -8% |
| HD Tune Access Time | ||||
| Access Time * (ms) | 0.1 | 0.14 | ||
| HD Tune Burst Rate | ||||
| Burst Rate (MB/s) | 345 | 199 -42% | 300.6 -13% | 123.6 -64% |
| PCMark Vantage | 0% | -2% | -12% | |
| 1024x768 HDD Score (Points) | 50320 | 54763 9% | 45907 -9% | 36056 -28% |
| 1024x768 Productivity Score (Points) | 28295 | 27046 -4% | 25406 -10% | 23055 -19% |
| 1024x768 Communications Score (Points) | 18284 | 16400 -10% | 19022 4% | 16316 -11% |
| 1024x768 Music Score (Points) | 20564 | 21711 6% | 21465 4% | 18004 -12% |
| 1024x768 Gaming Score (Points) | 22689 | 23183 2% | 22422 -1% | 20746 -9% |
| 1024x768 TV and Movies Score (Points) | 7377 | 7544 2% | 7038 -5% | 7294 -1% |
| 1024x768 Memories Score (Points) | 13754 | 13721 0% | 13283 -3% | 11982 -13% |
| 1024x768 Result (Points) | 19638 | 19147 -3% | 20391 4% | 18602 -5% |
| Total Average (Program / Settings) | 5% /
7% | -4% /
-14% | -18% /
-18% |
* ... smaller is better
