

Leagoo Kiicaa Mix Smartphone Review
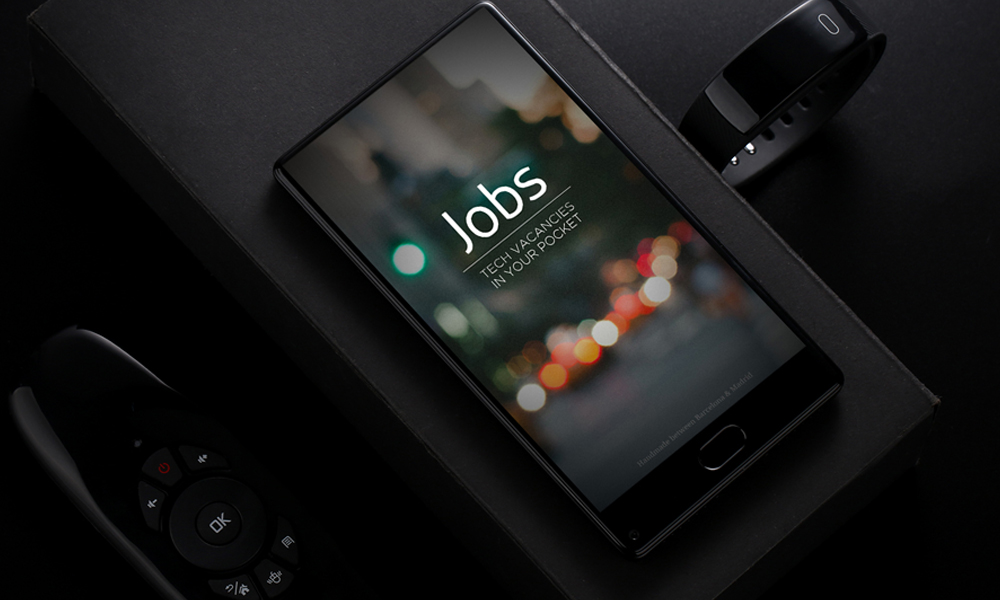
The Leagoo Kiicaa Mix is one of the smallest 5.5-inch Android smartphones available with a 1080p display. Unlike the narrow bezels of the LG V30 or Samsung Galaxy Note 8, the Kicaa Mix is narrow on three of its four sides for an even more compact form factor. The design is not new, however, as Sharp popularized the concept with the Aquos Crystal back in 2012.
For this short review, we'll be analyzing the performance of the Kiicaa Mix to see how it compares to other affordable alternatives. The Leagoo smartphone currently retails for around $120 USD. The full specifications list can be found on the GearBest product page and Leagoo's official site.
Case
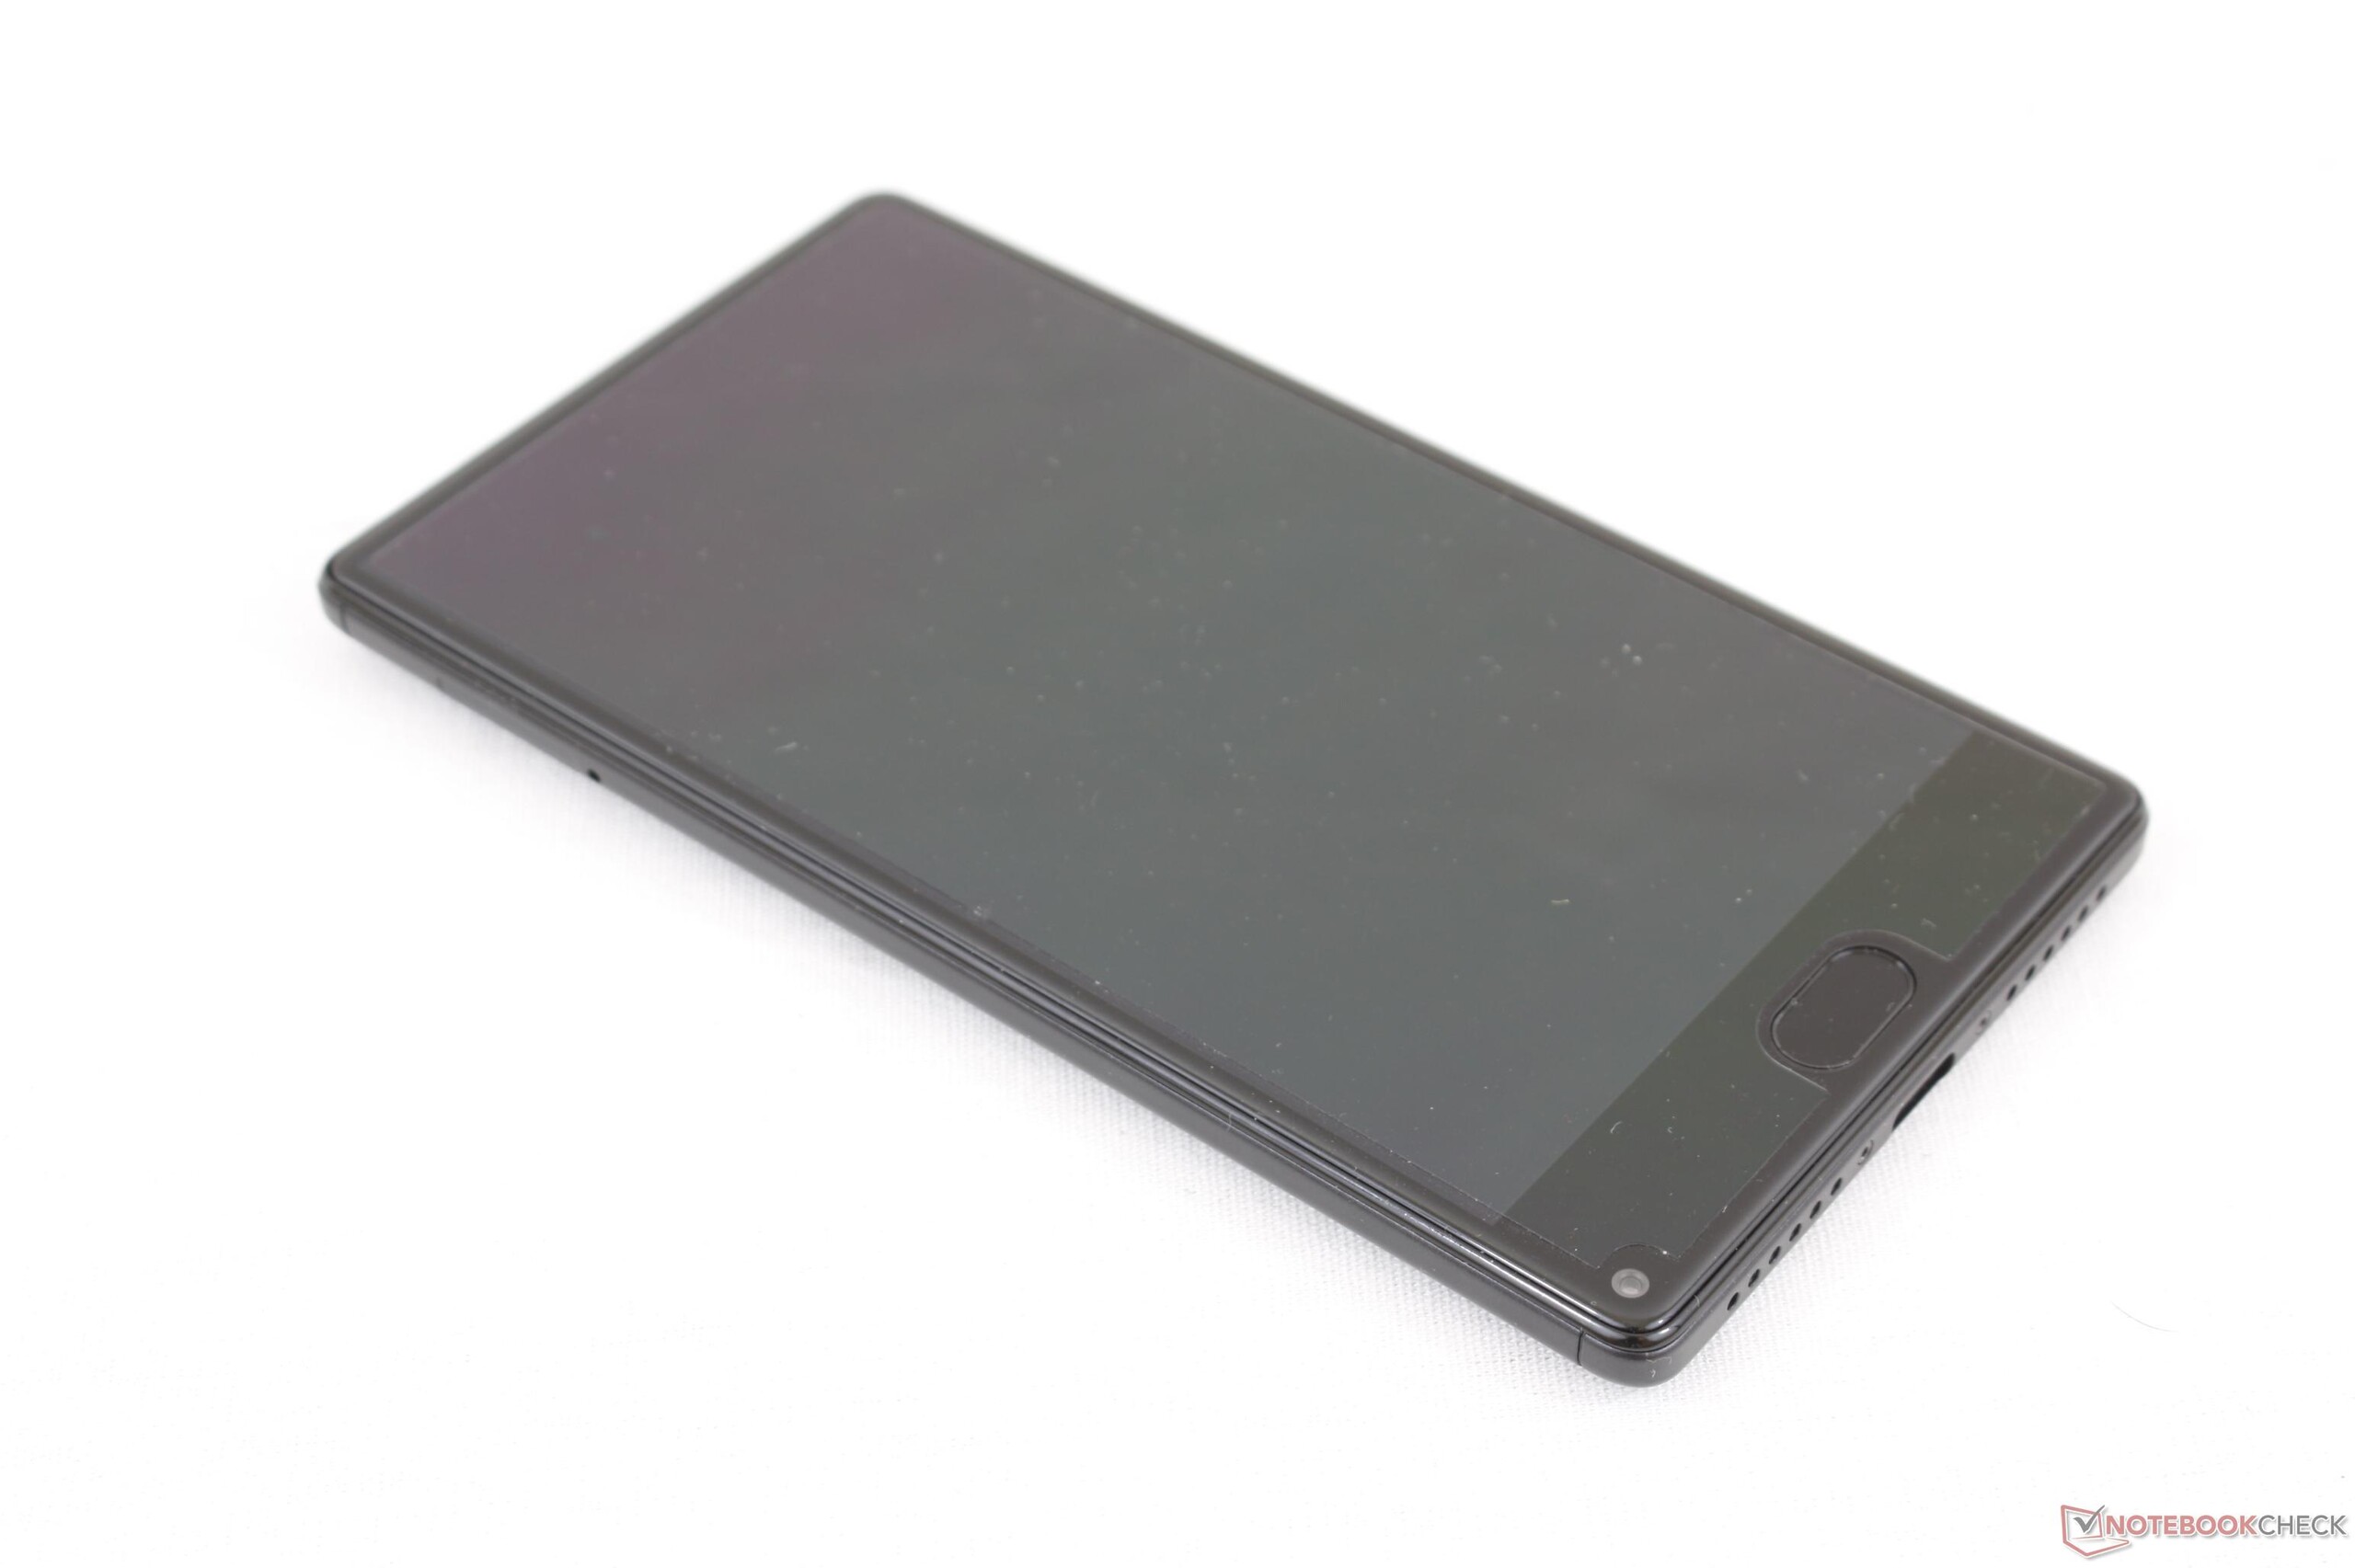
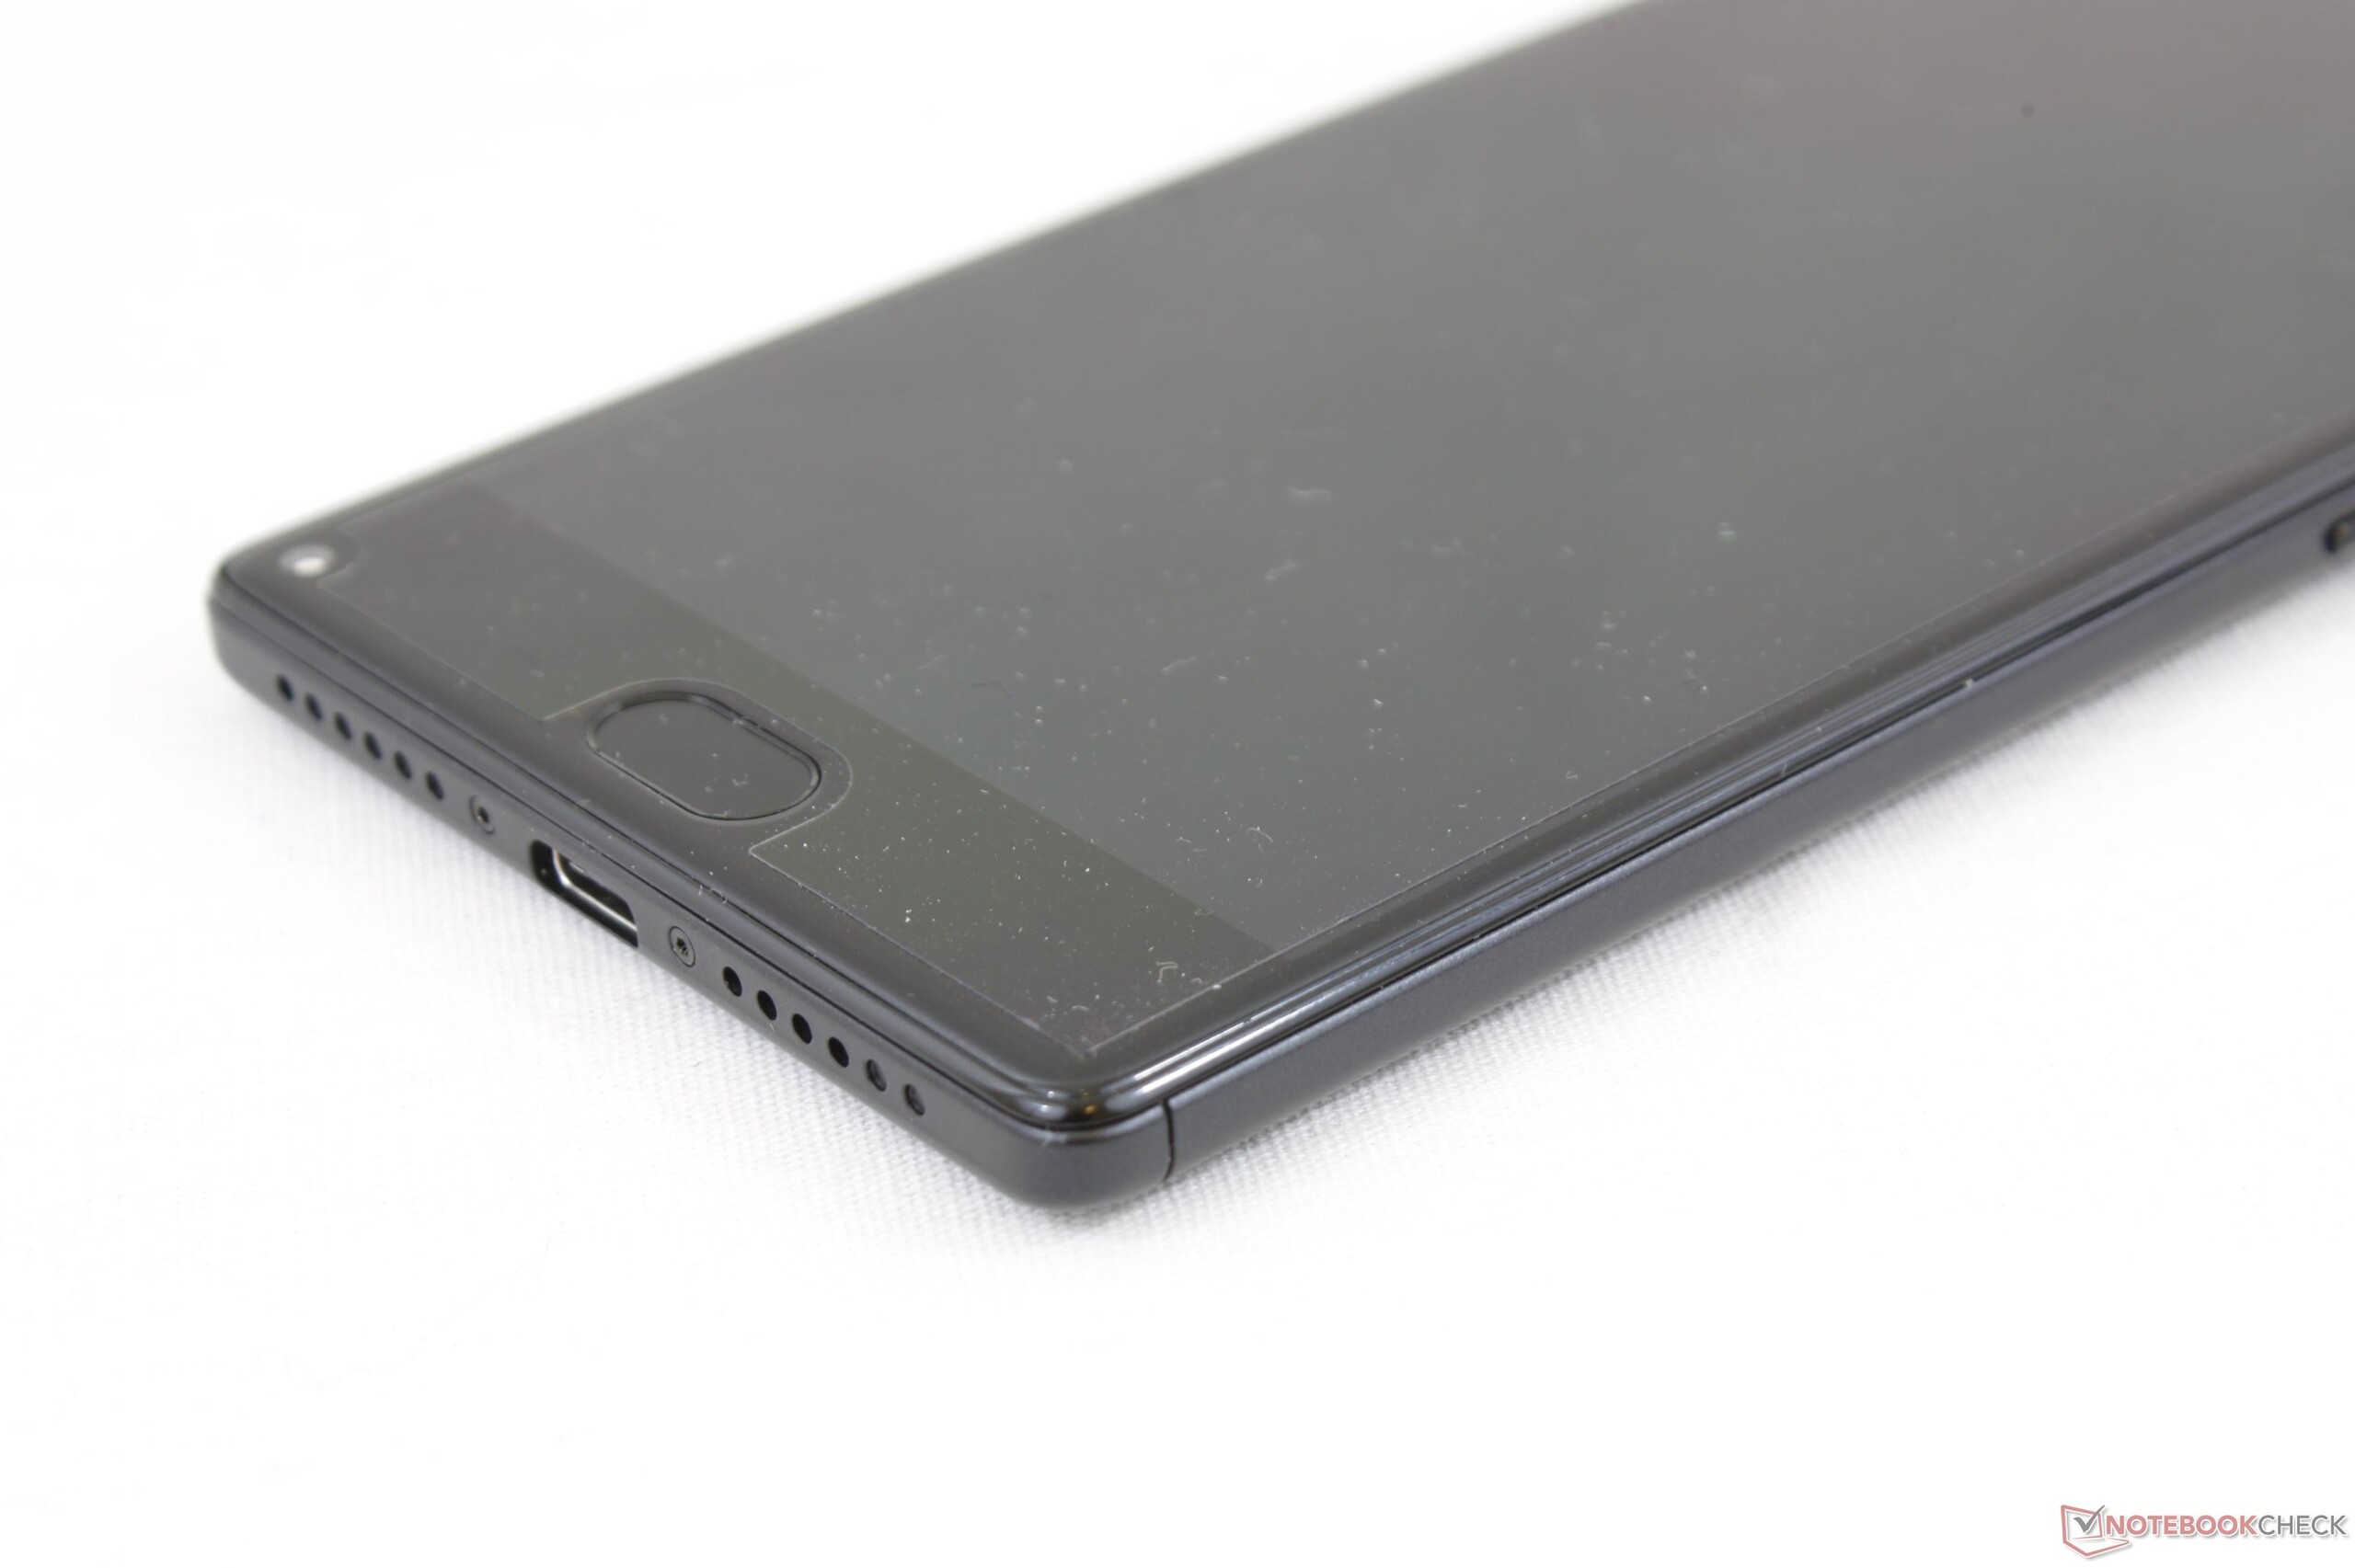
With a very high screen-to-body ratio of 90 percent, the Kiicaa Mix is an attractive device for the price. The plastic chassis is firm but suffers from some creaking when attempting to twist the unit.
Note that the front-facing camera is now on the bottom left corner of the smartphone since there is no room along the top edge not unlike on the Dell XPS 13. This is not a good smartphone for selfies due to the awkward angle and placement of the front camera.
The narrow bezels and small size make the Kicaa Mix very light at just 153 g compared to the 198 g Doogee Mix. Its length is especially shorter by over 1 cm compared to the LG X Power2.
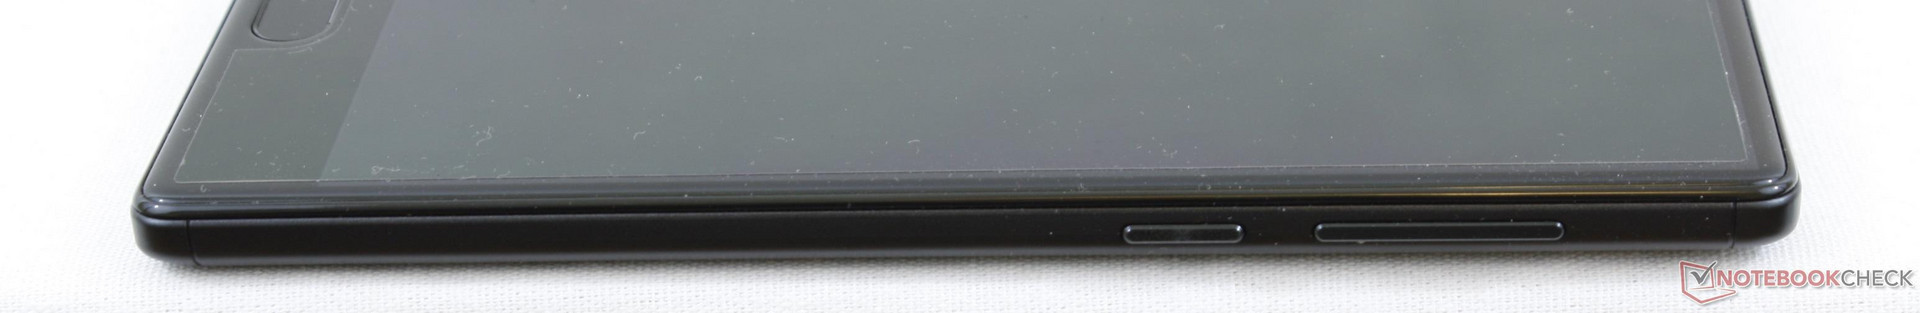
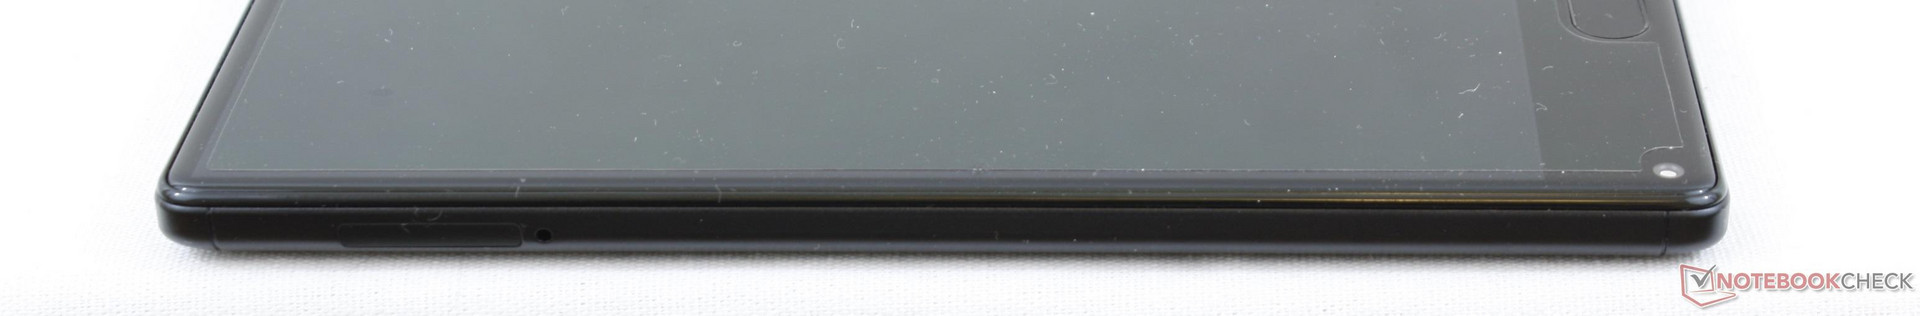
Connectivity
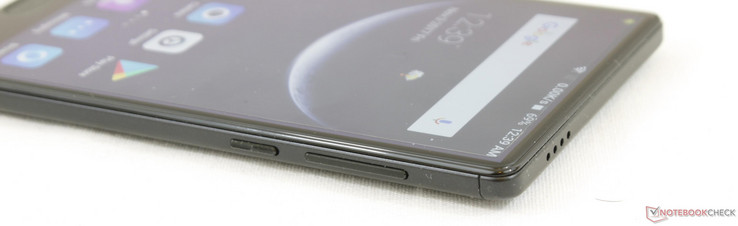
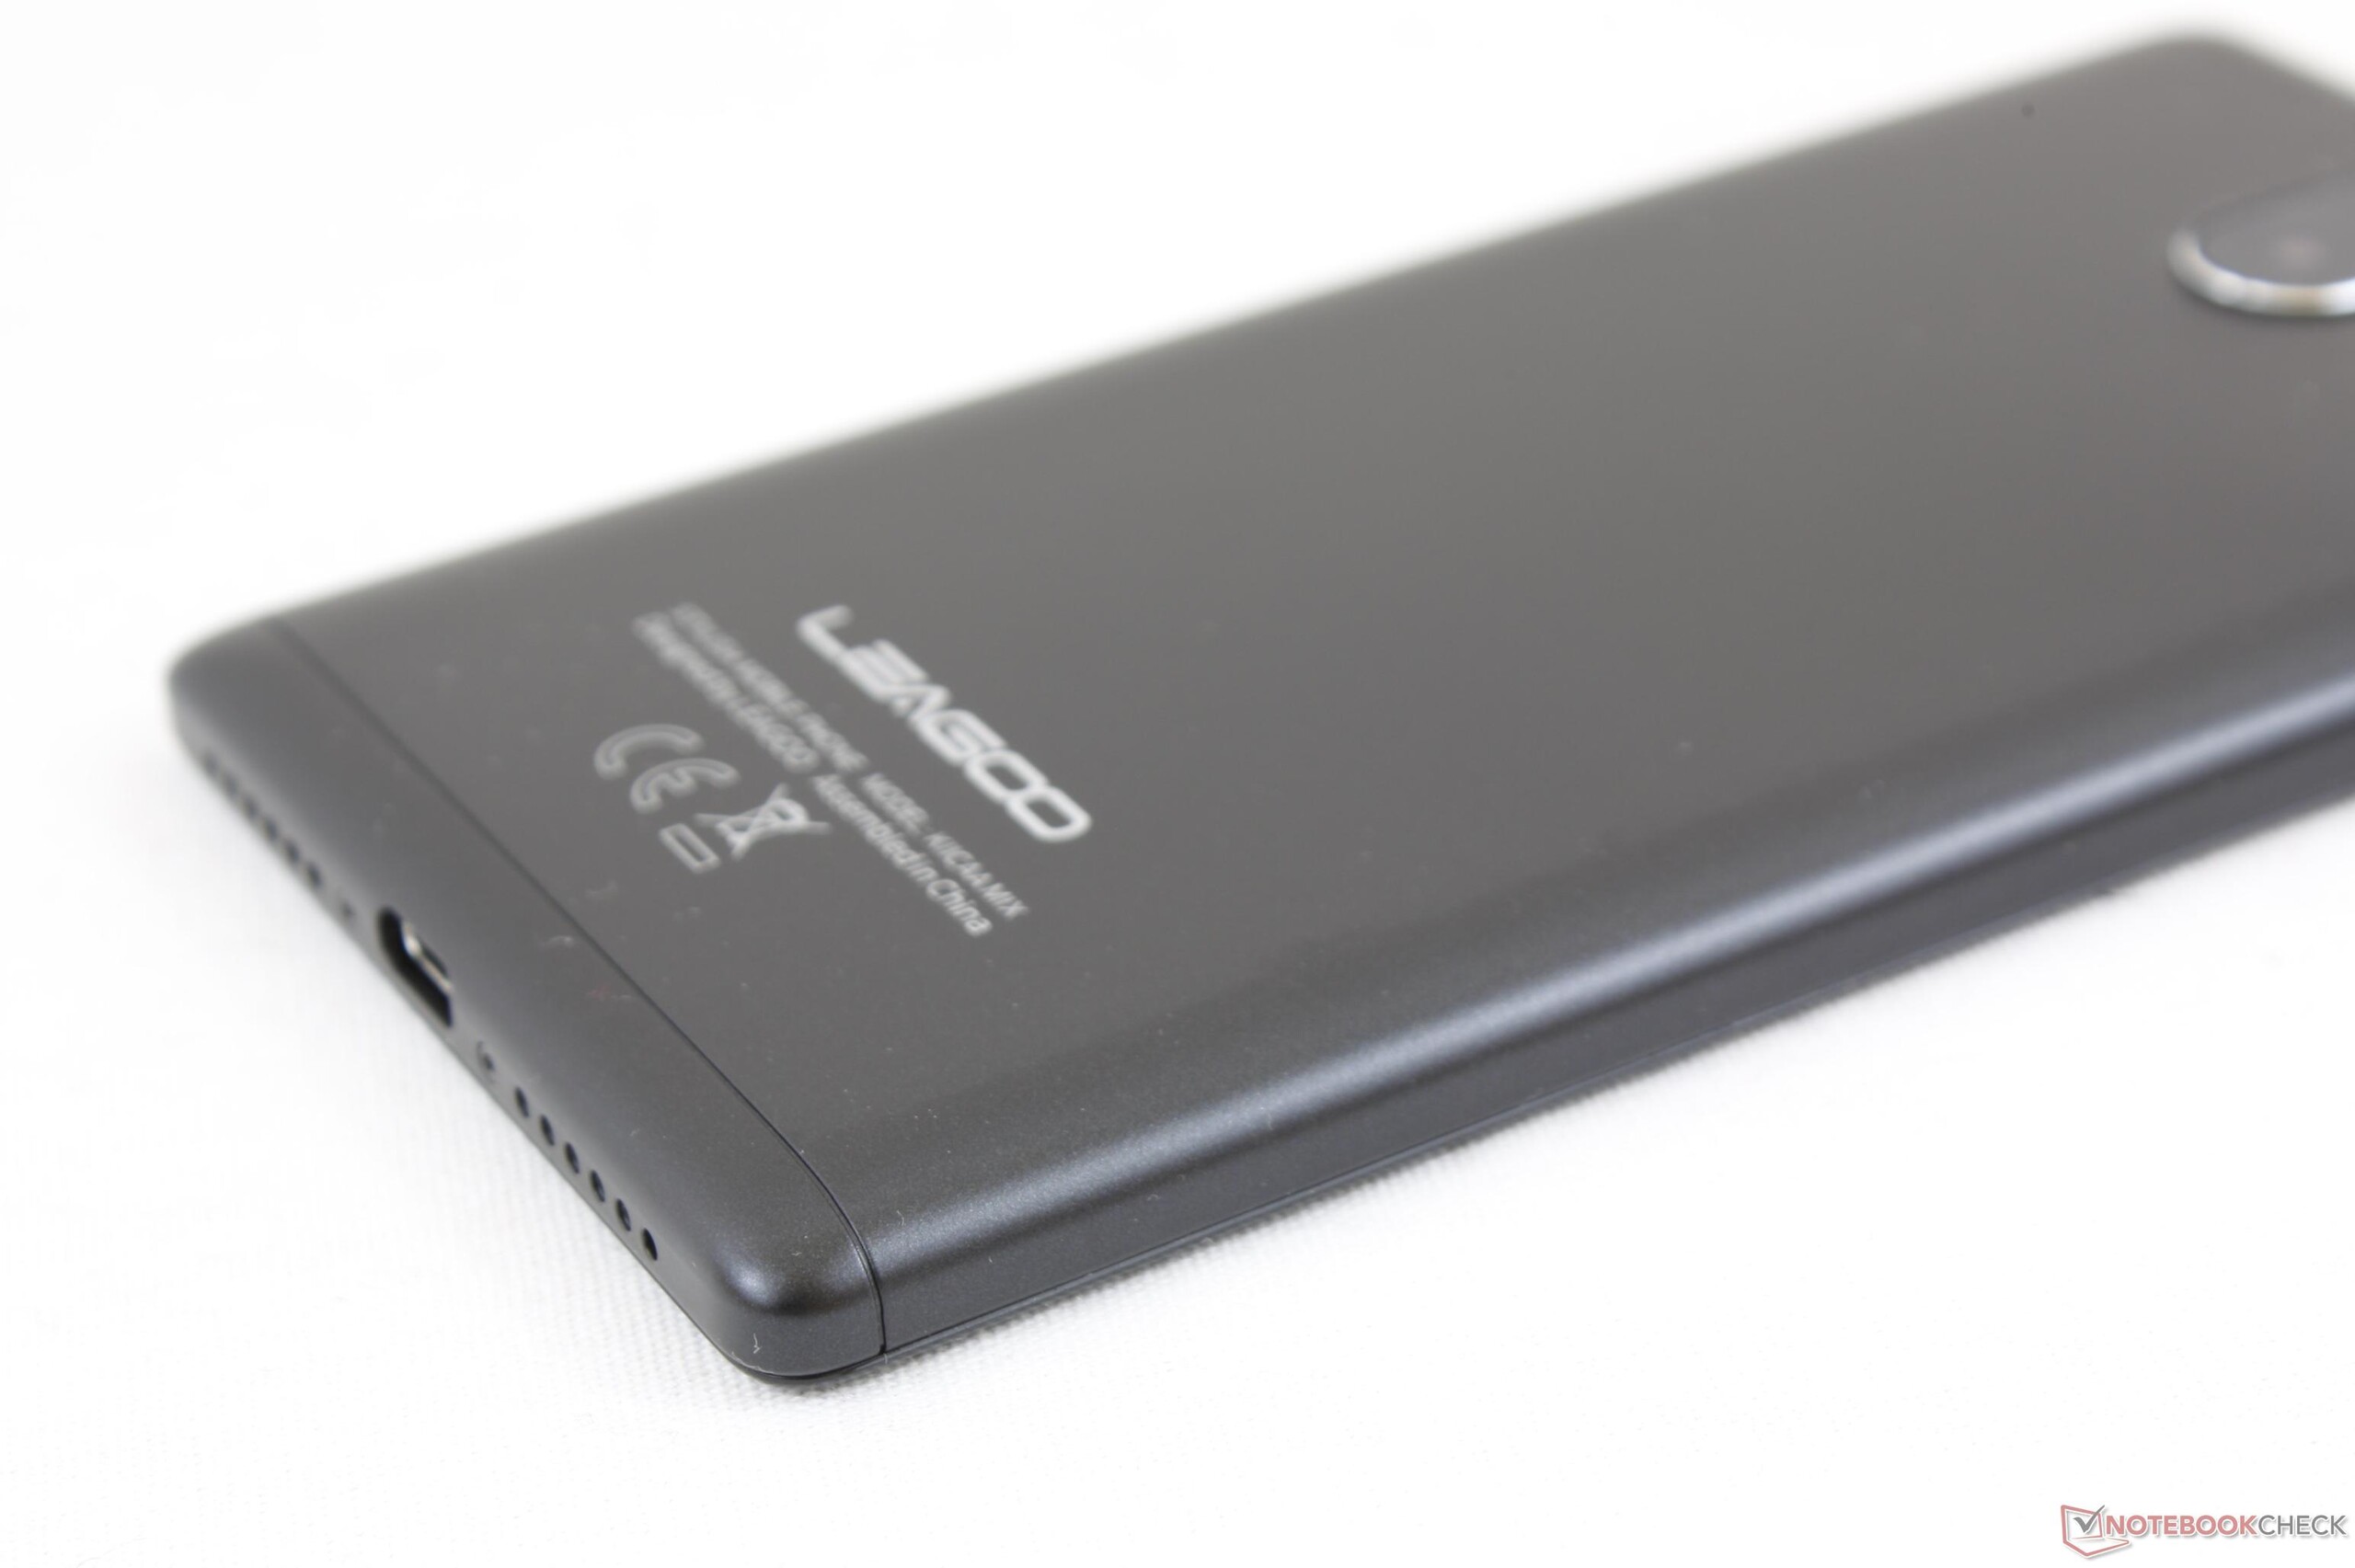
The only physical ports available are the USB Type-C port and dual nano-SIM slot with MicroSD support. There is no 3.5 mm audio jack, NFC, WiFi calling, or IR blaster. Bluetooth, 802.11n, and Android Cast are available for wireless connectivity.


SD Card Reader
Like most dual-SIM smartphones, the second SIM slot doubles as a MicroSD card reader. Transferring 1 GB worth of photos from our Toshiba THN-M401S0640E2 MicroSD card to internal storage takes about 19 seconds.
| SD Card Reader - average JPG Copy Test (av. of 3 runs) | |
| Dell XPS 13 i7-8550U | |
| Samsung Notebook 9 NP900X3N-K01US | |
| Leagoo Kiicaa Mix | |
Communication
WLAN is supported up to 802.11n. Standing next to our Linksys EA8500 test router returns an average transfer rate of 45 Mbps. Connection is reliable and we experienced no issues.
Although the Kiicaa Mix is advertised as a 4G smartphone, it does not carry the compatible LTE bands necessary for 4G connectivity amongst major US carriers. When connected to the T-Mobile network, for example, even 3G speeds are not possible. We recommend checking the official Kicaa Mix specifications to see if it carries the necessary bands for your region.
Call quality is poor as volume is far too soft for both the caller and receiver even with optimal cell reception. Although we didn't experience any dropped calls, it will be very difficult to hear clearly when outdoors with ambient chatter and zooming cars.
We are unable to test the accuracy of the GPS with Google Maps since the smartphone is incompatible with our carrier. US ssers who intend to use the Leagoo for turn-by-turn driving directions may be out of luck.
| Networking | |
| iperf3 transmit AX12 | |
| Samsung Galaxy Note 8 | |
| Samsung Galaxy J7 2017 | |
| Leagoo Kiicaa Mix | |
| iperf3 receive AX12 | |
| Samsung Galaxy Note 8 | |
| Samsung Galaxy J7 2017 | |
| Leagoo Kiicaa Mix | |
Cameras
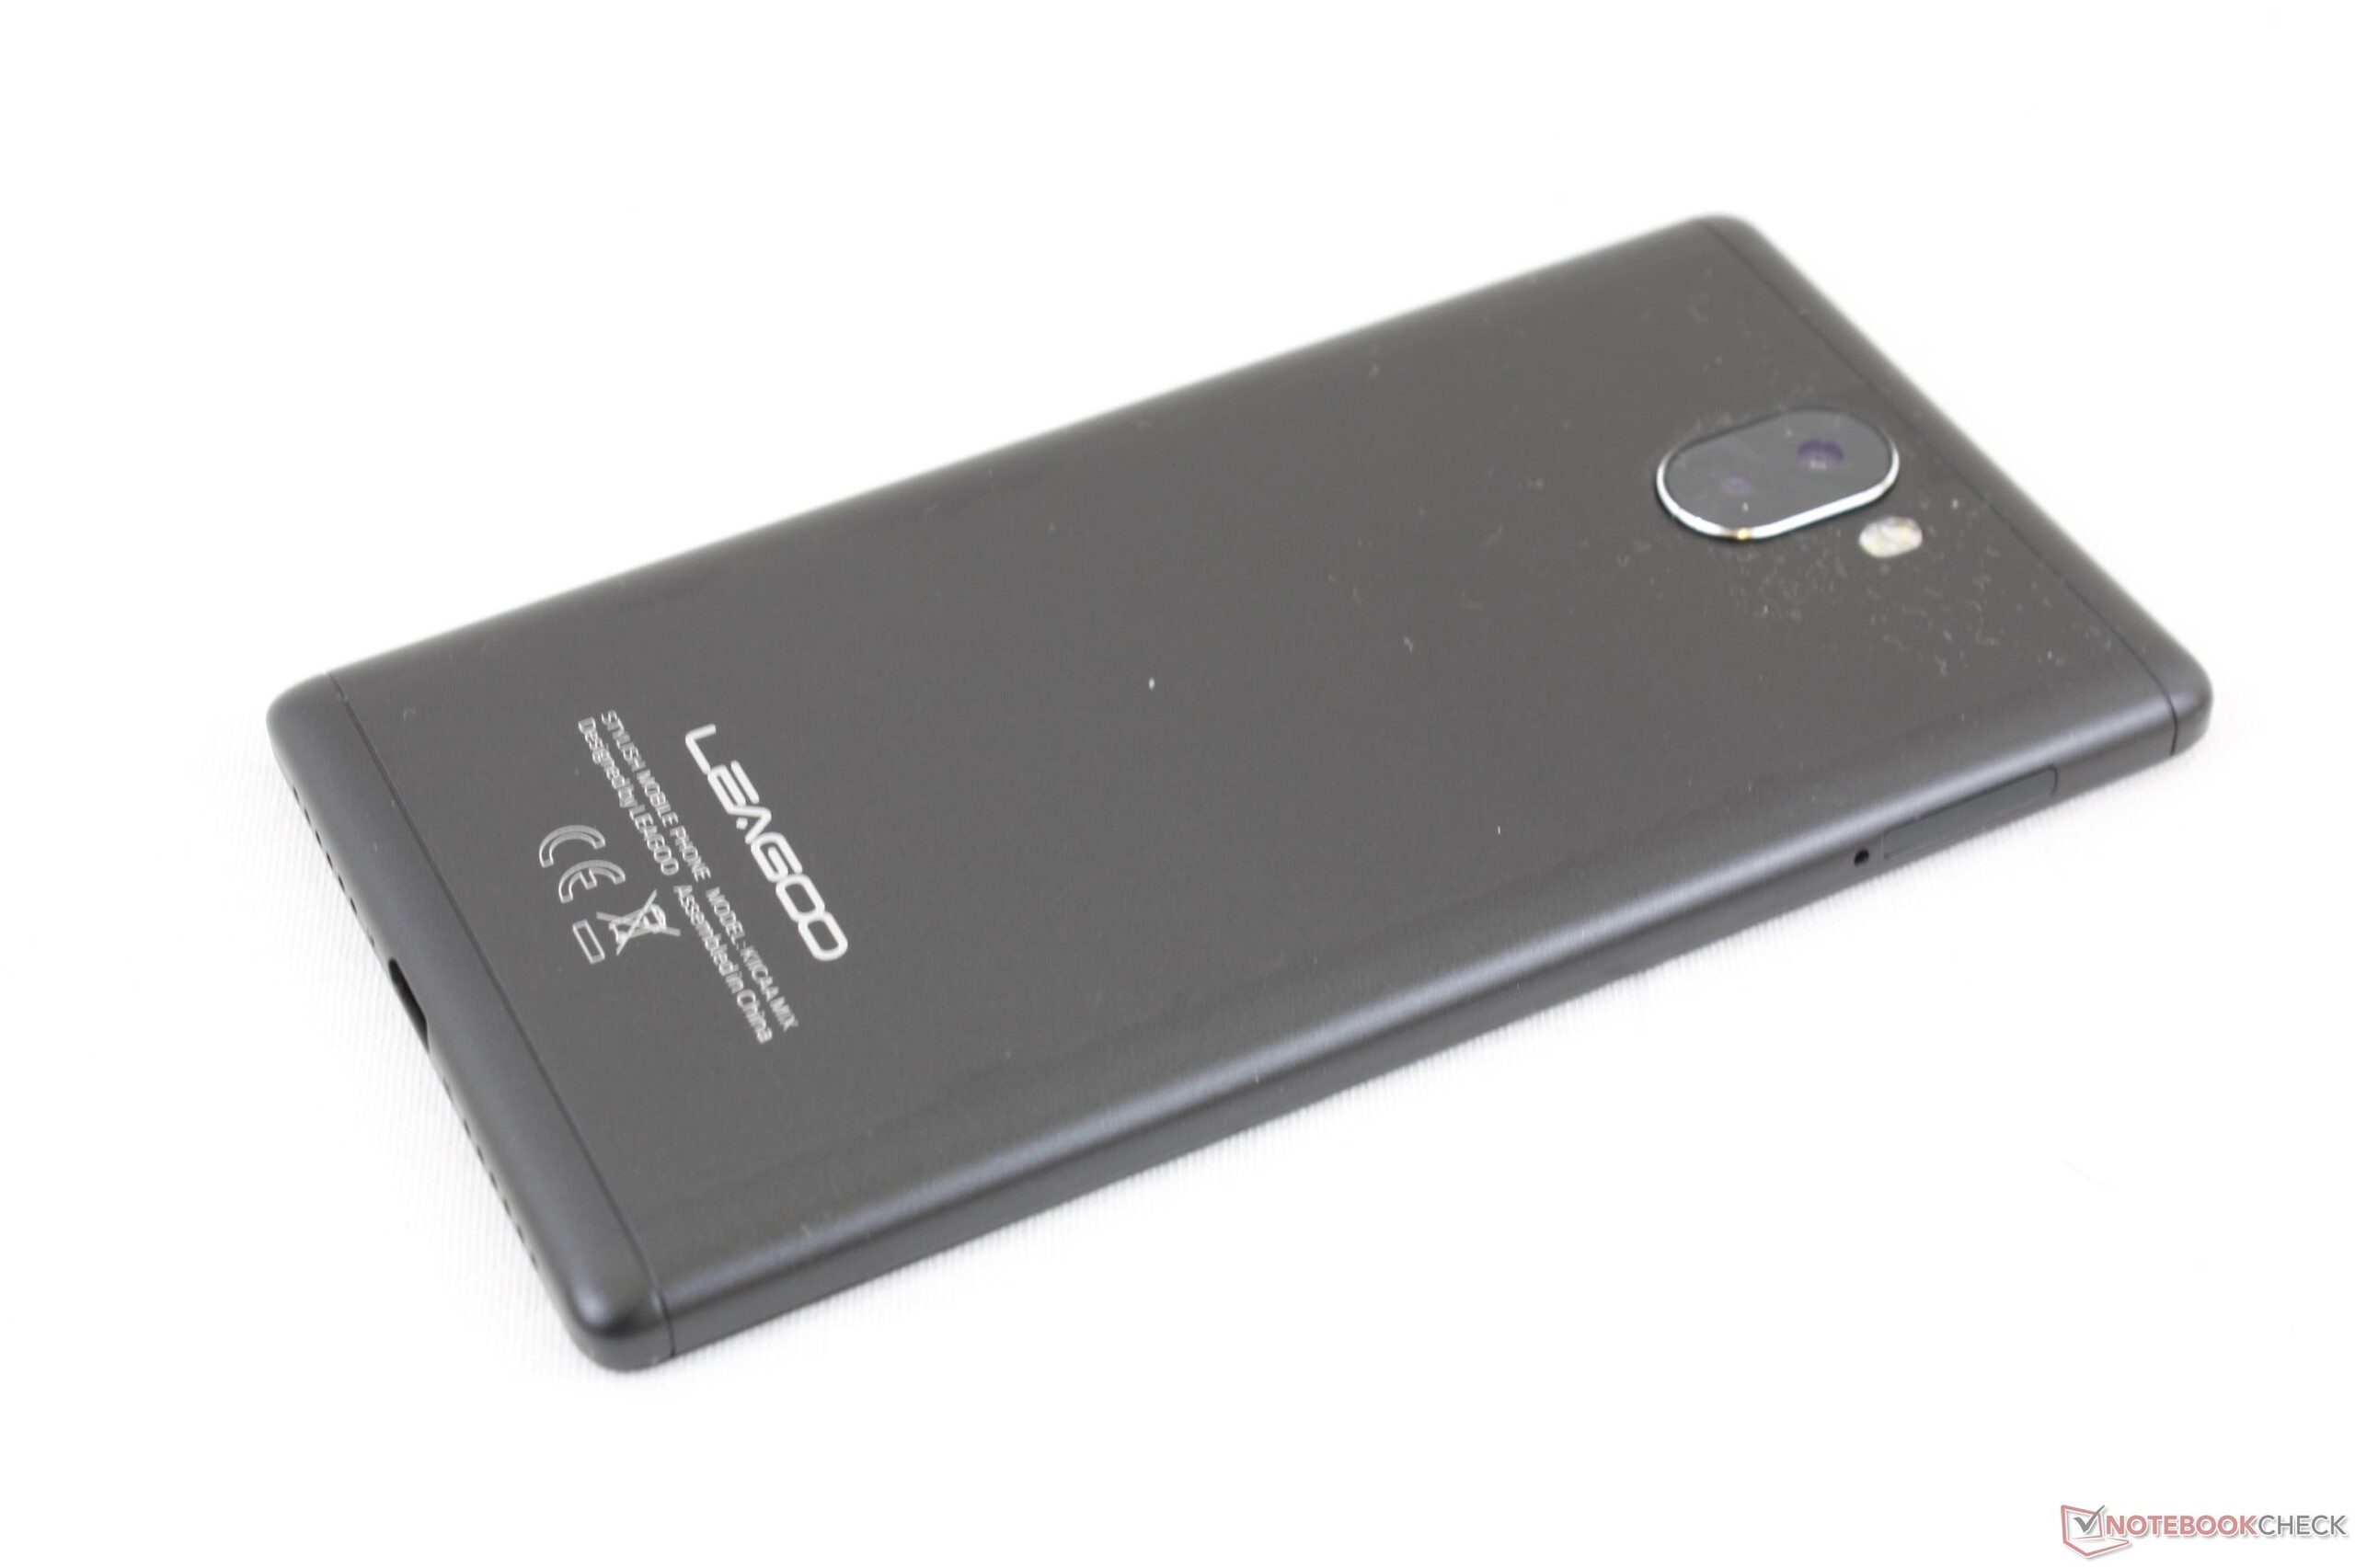
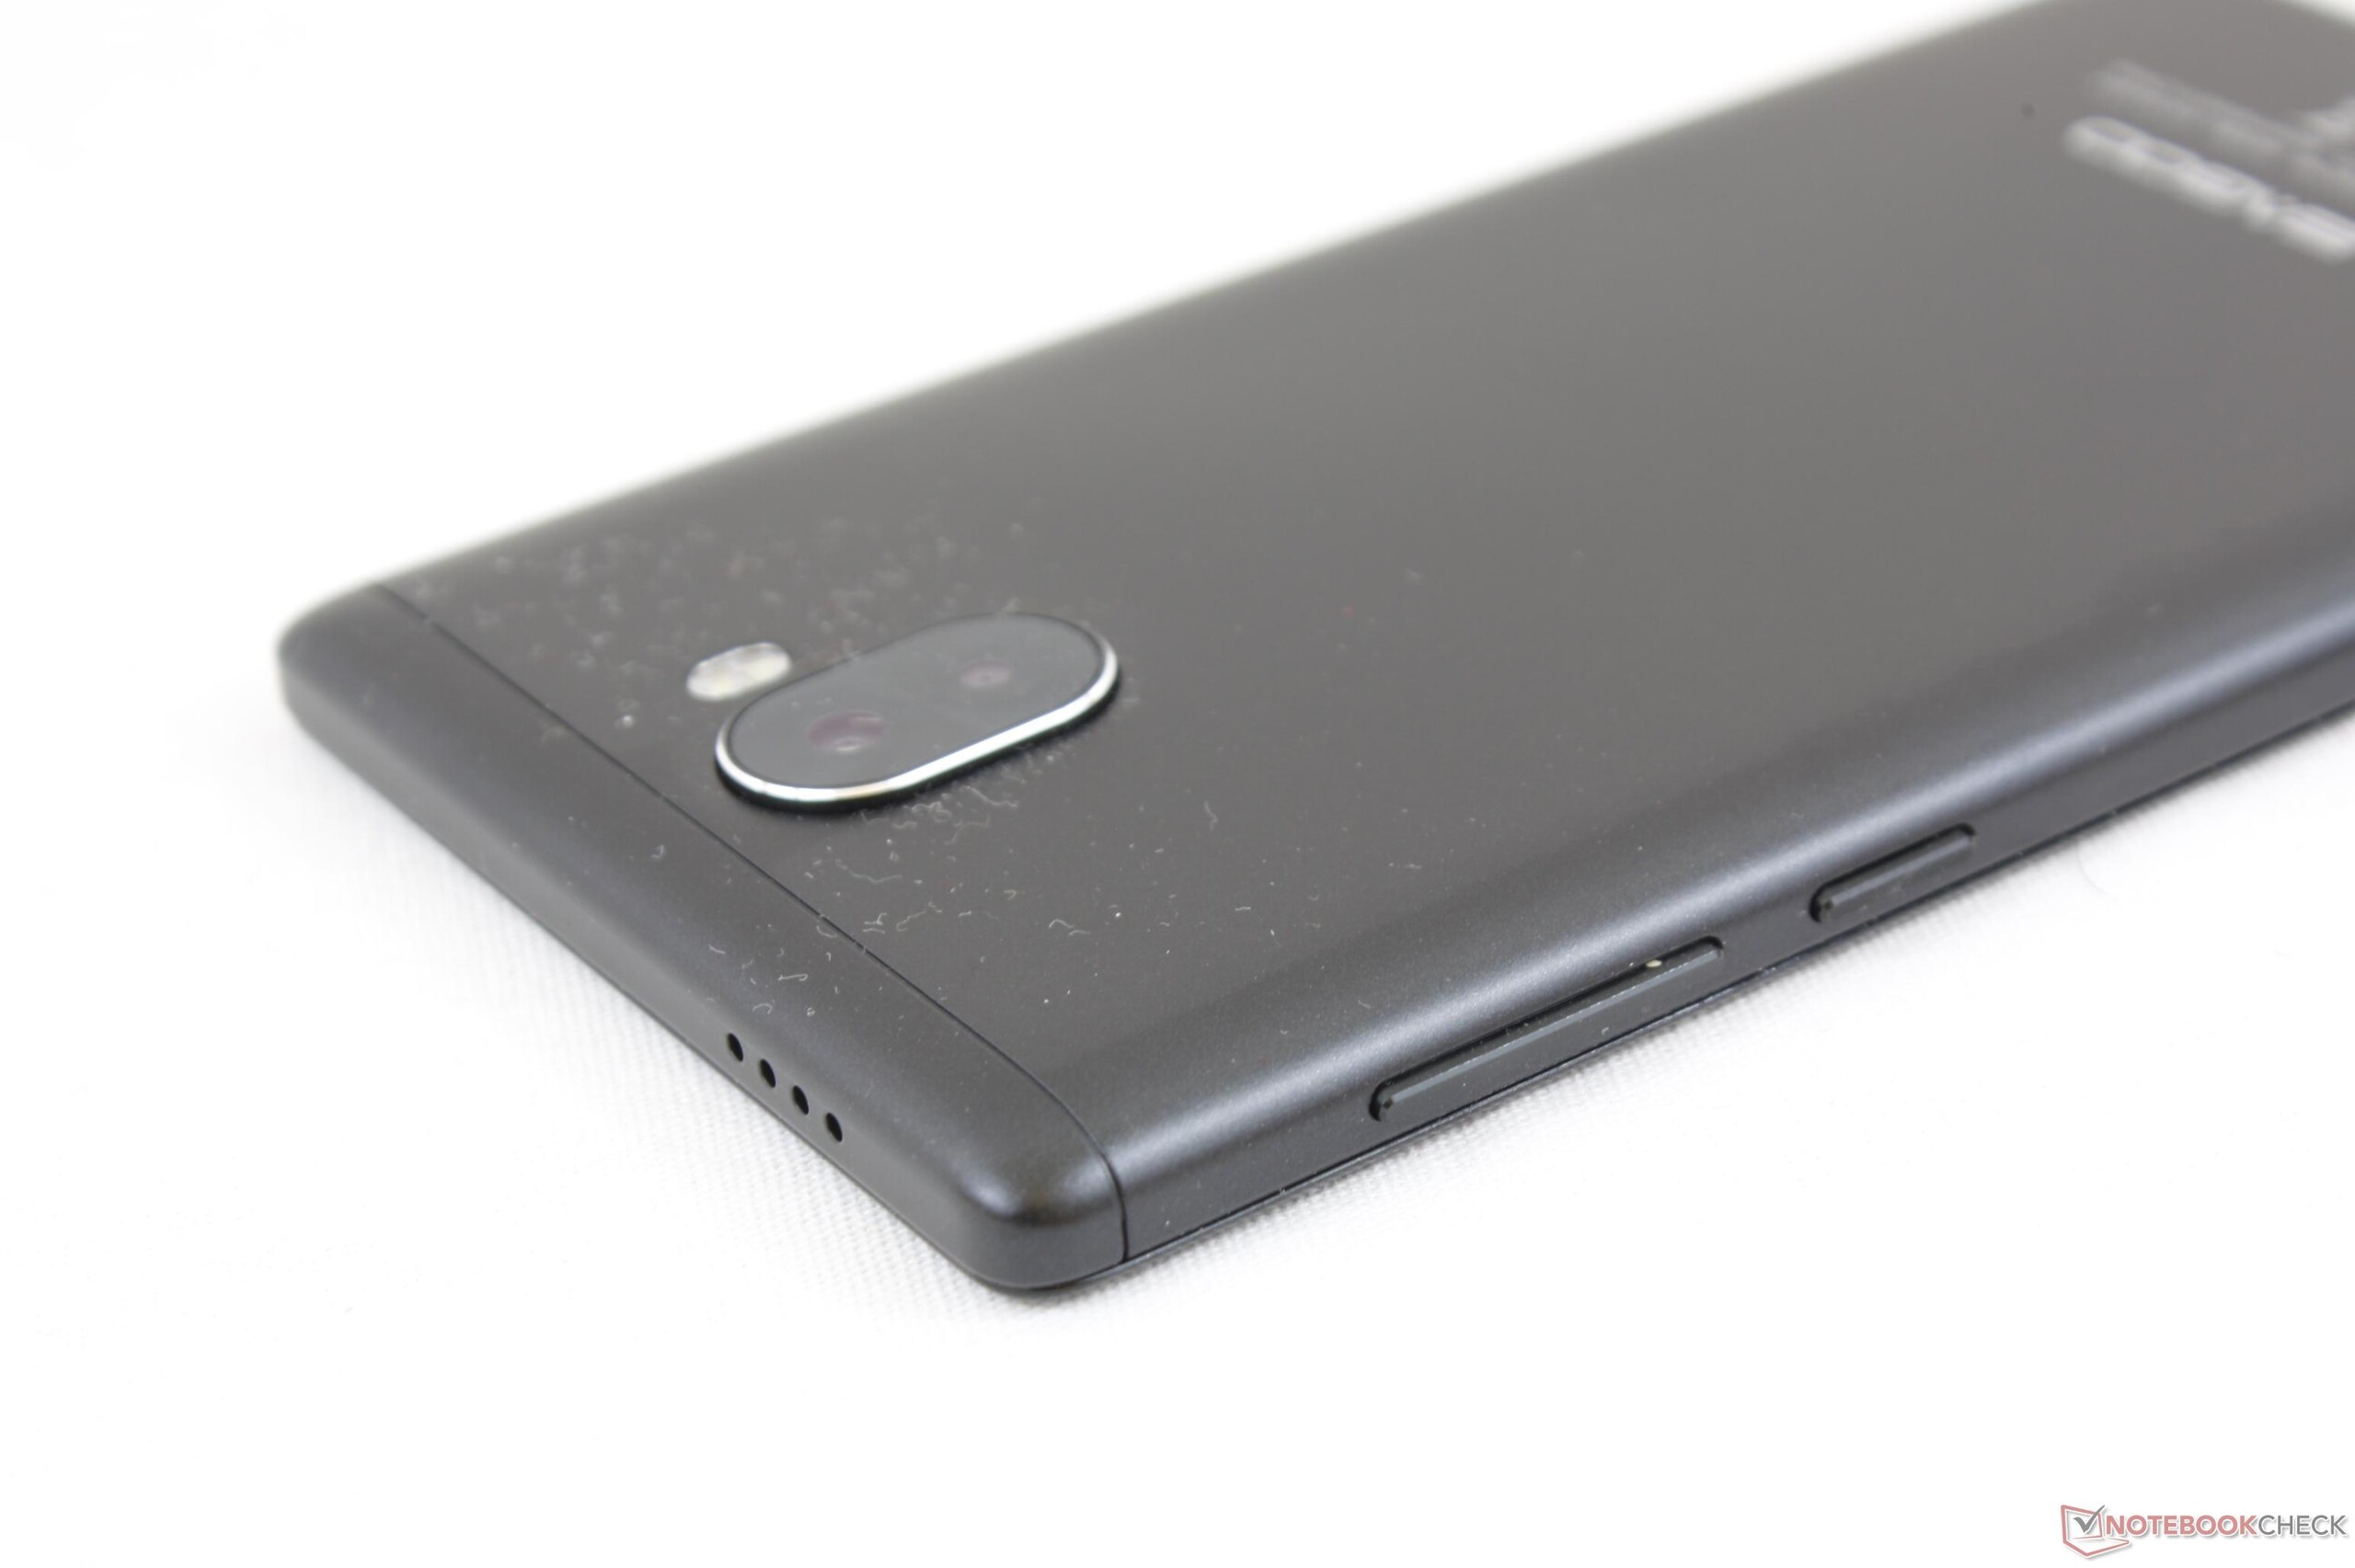
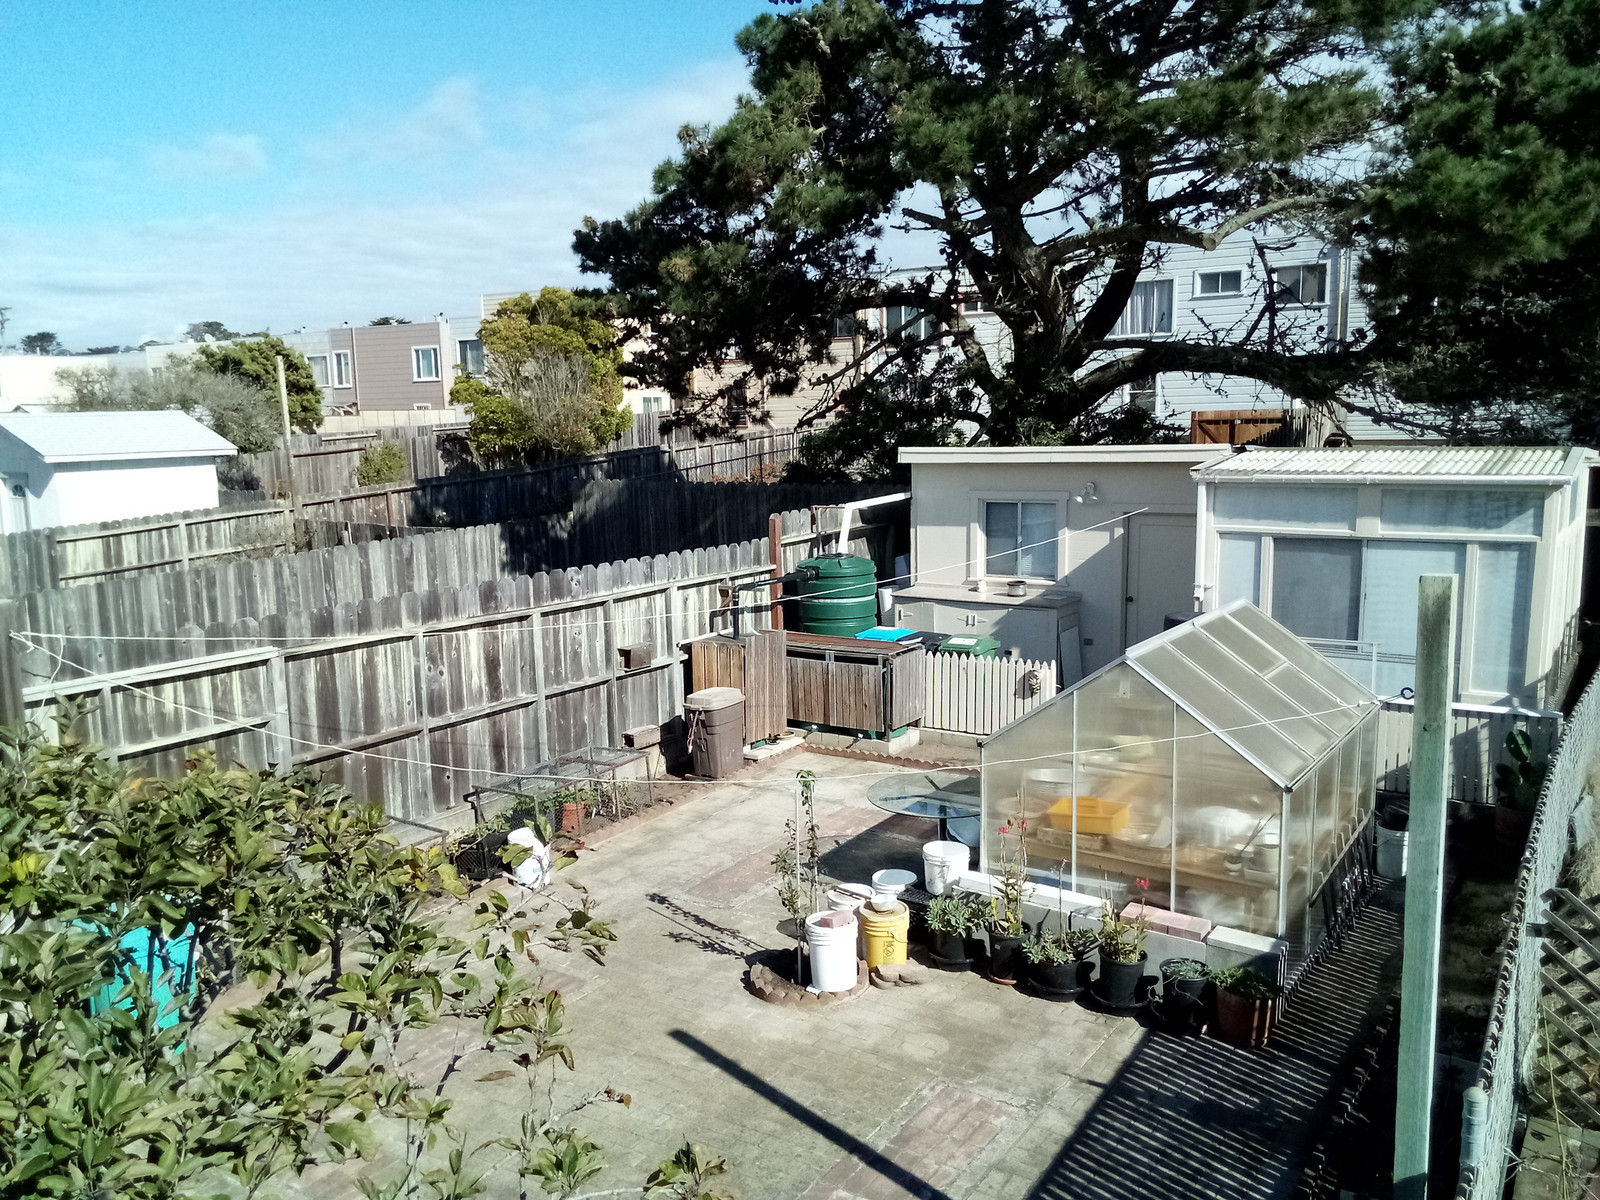
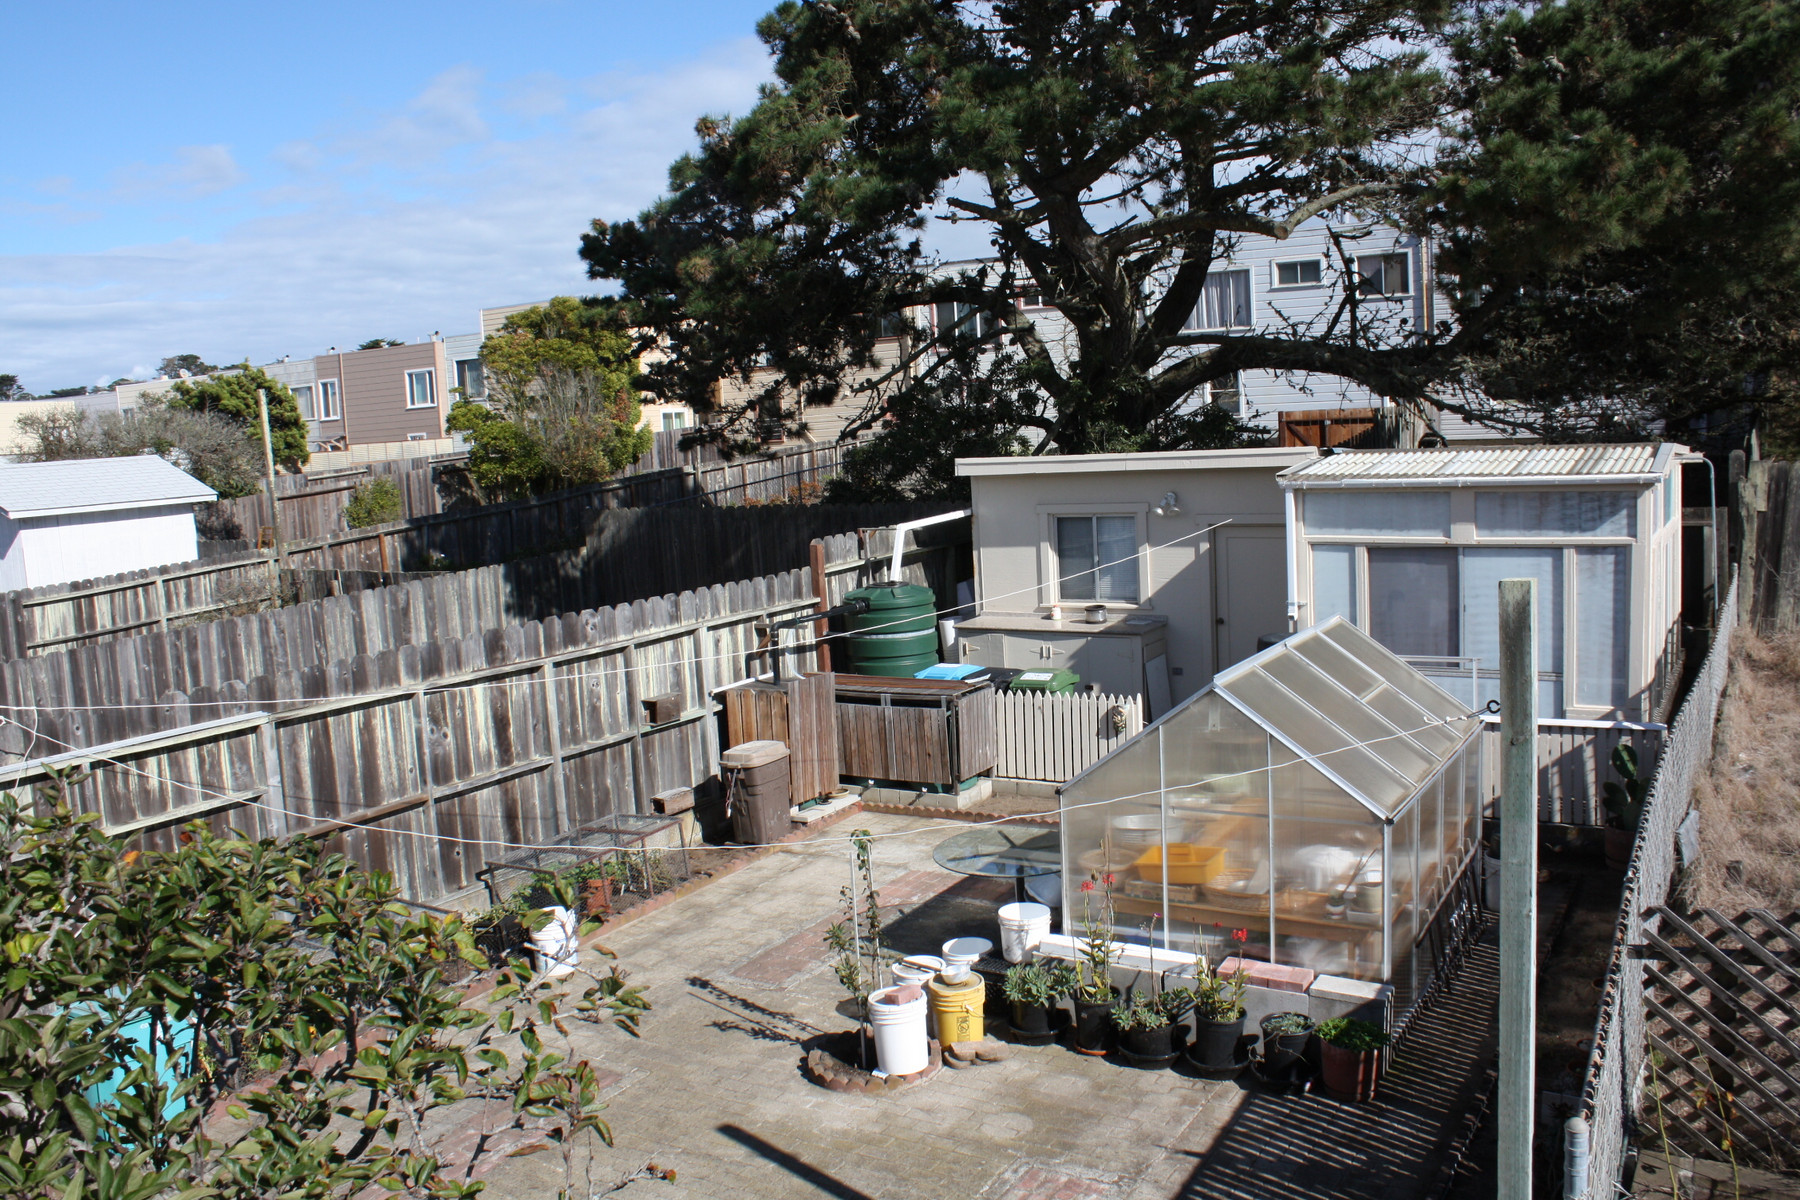
Camera quality is average at best. Images are overexposed, overly green, and with muddy details. Like most cameras on cheap Android smartphones, quality becomes even worse when indoors where noise is a bigger factor. Meanwhile, the 13 MP front-facing camera does little to alleviate the blurriness and lack of focus.

Accessories and Warranty
Accessories include a SIM needle, Quick Start guide, Warranty card, European-style wall charger, USB Type-C cable, USB Type-C earphones, and a plastic cover case. Manufacturer warranty is the standard one-year period. Please see our Guarantees, Return Policies & Warranties FAQ for country-specific information. It is too bad that there is no USB Type-C to 3.5 mm adapter should users prefer older earbuds.
Input Devices and Operation
Touchscreen
The 10-point capacitive touchscreen is responsive as one would expect. However, the onscreen delay can be very noticeable when switching between applications or during moderate multi-tasking. Fast typists, for example, will sometimes have their last few keys registered all at once after a short delay if websites or other background activity are loading.
Because of the narrow bezels on three of the four sides, touch-typing in the landscape orientation will feel awkward. One side of the keyboard will always be closer to the palm than the other for an uneven experience.
The fingerprint reader works surprisingly fast for such a cheap device. The smartphone unlocks quickly and reliably even after just a light tap on the sensor.
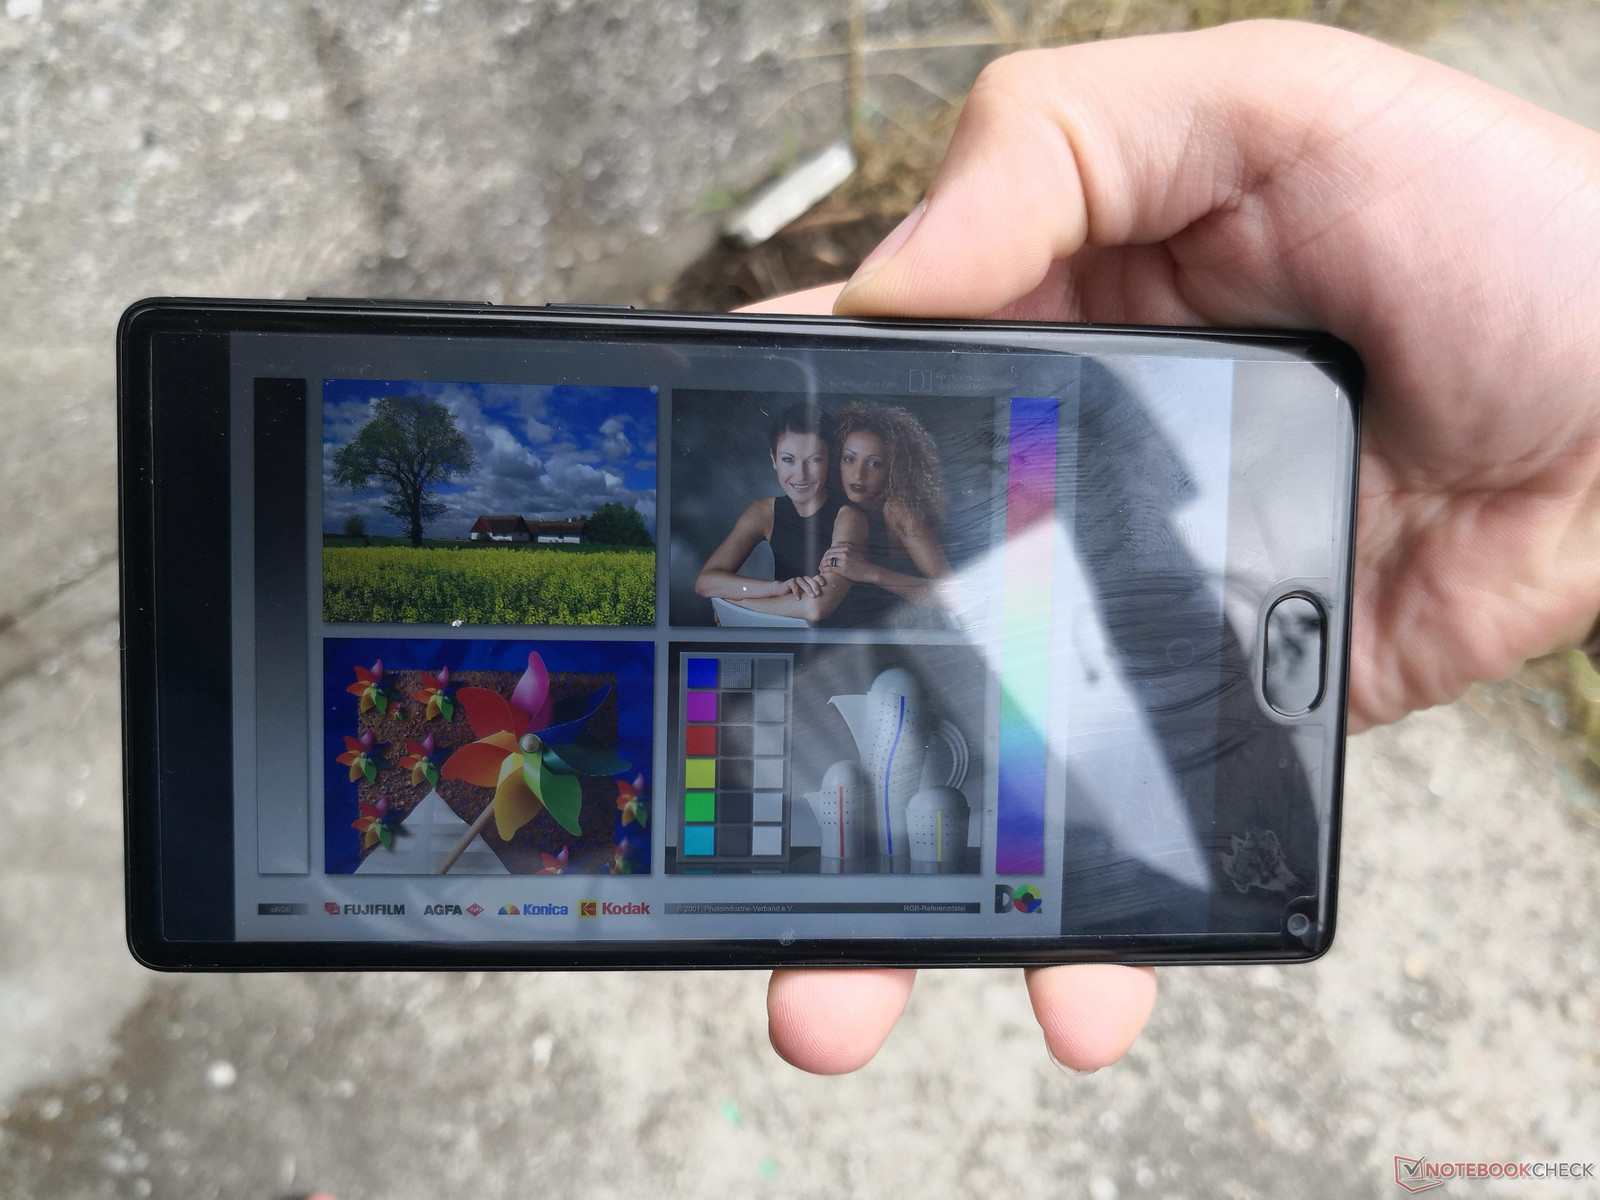
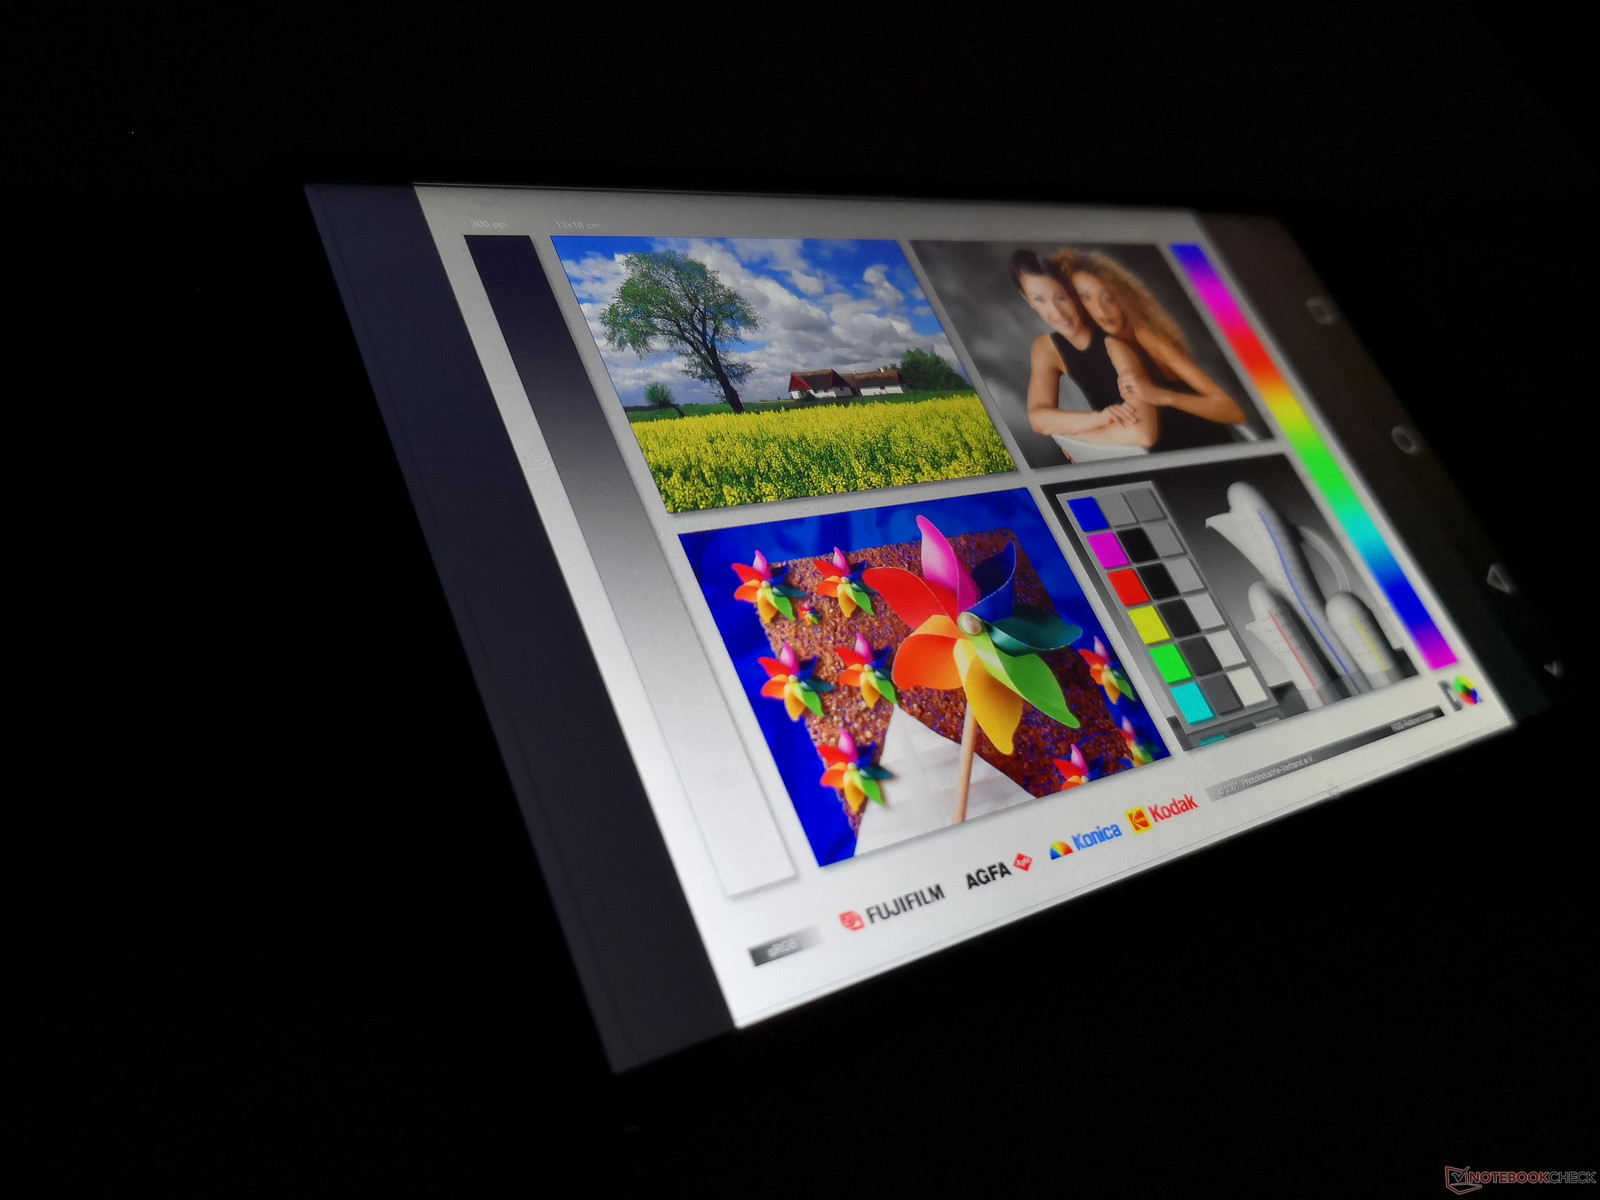
Display
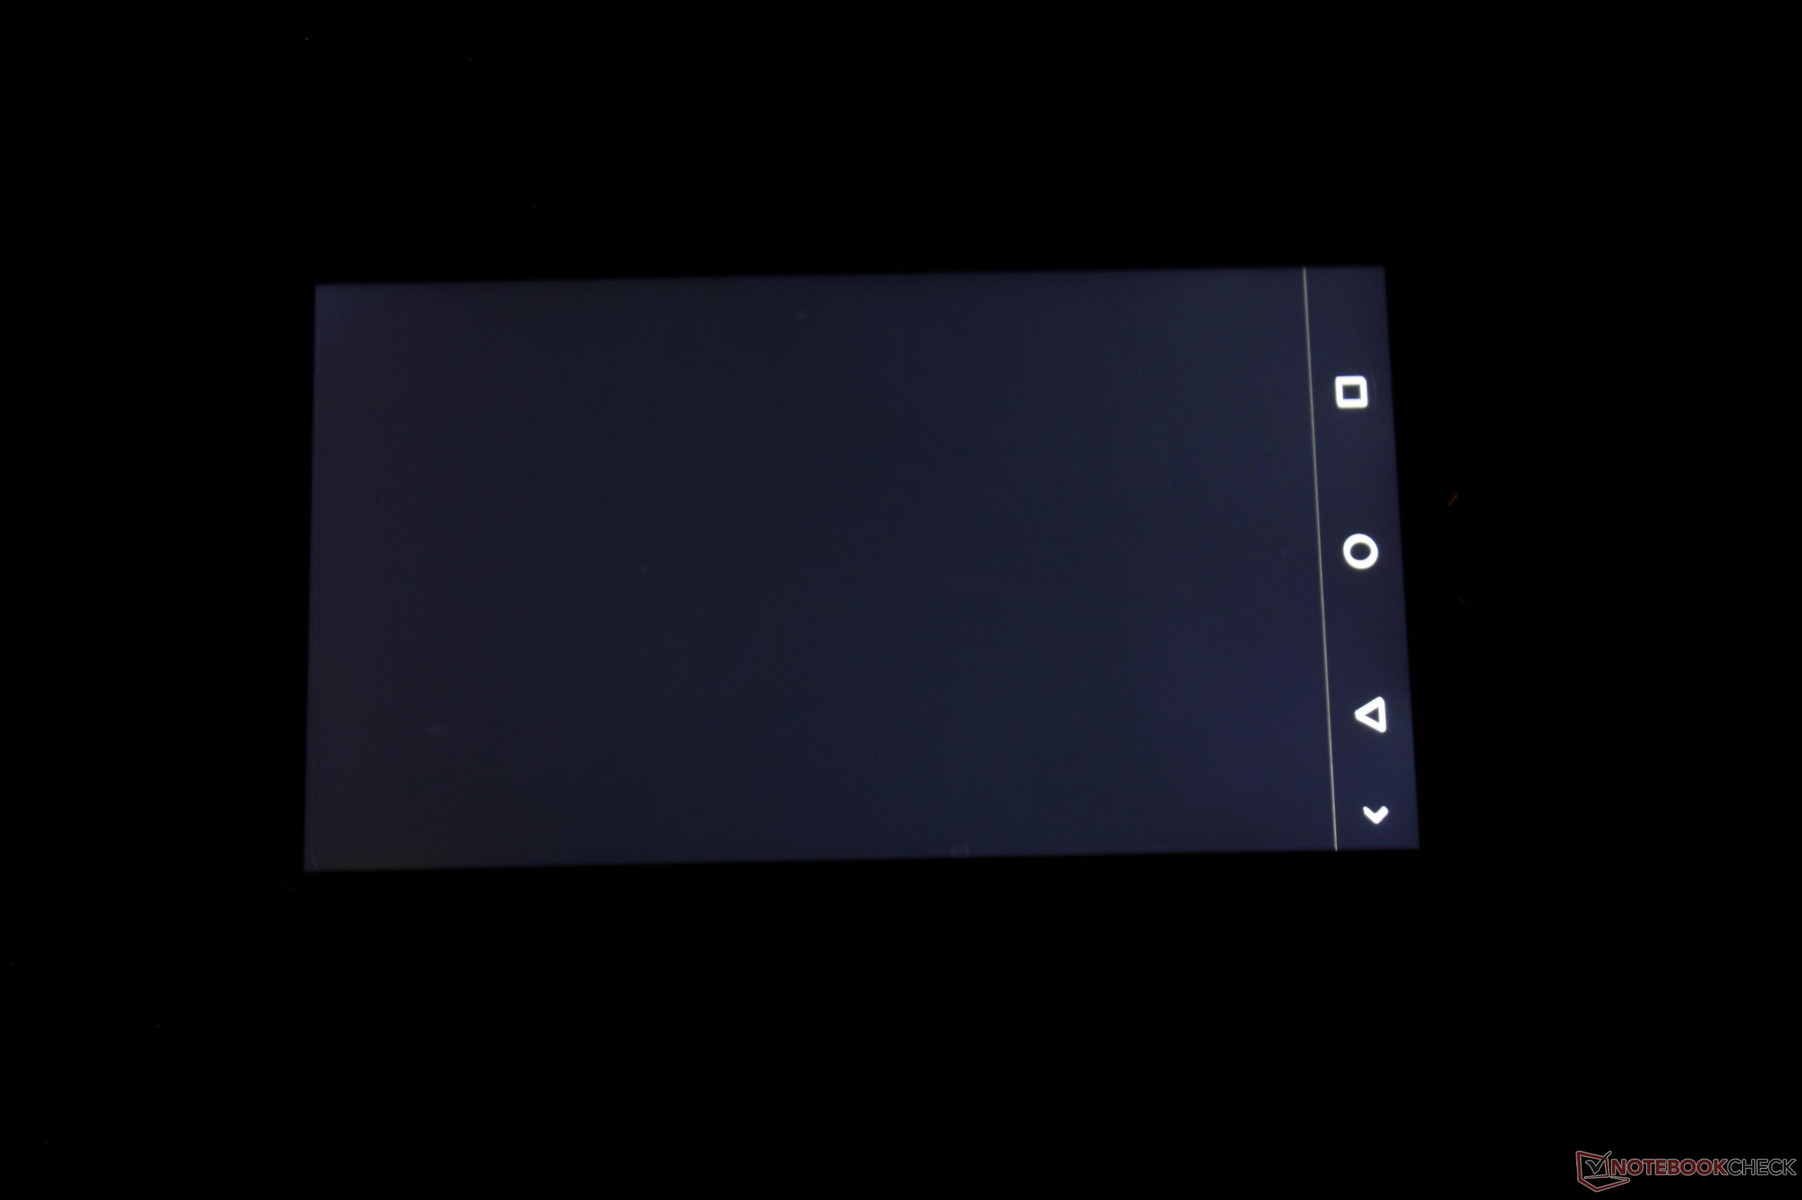
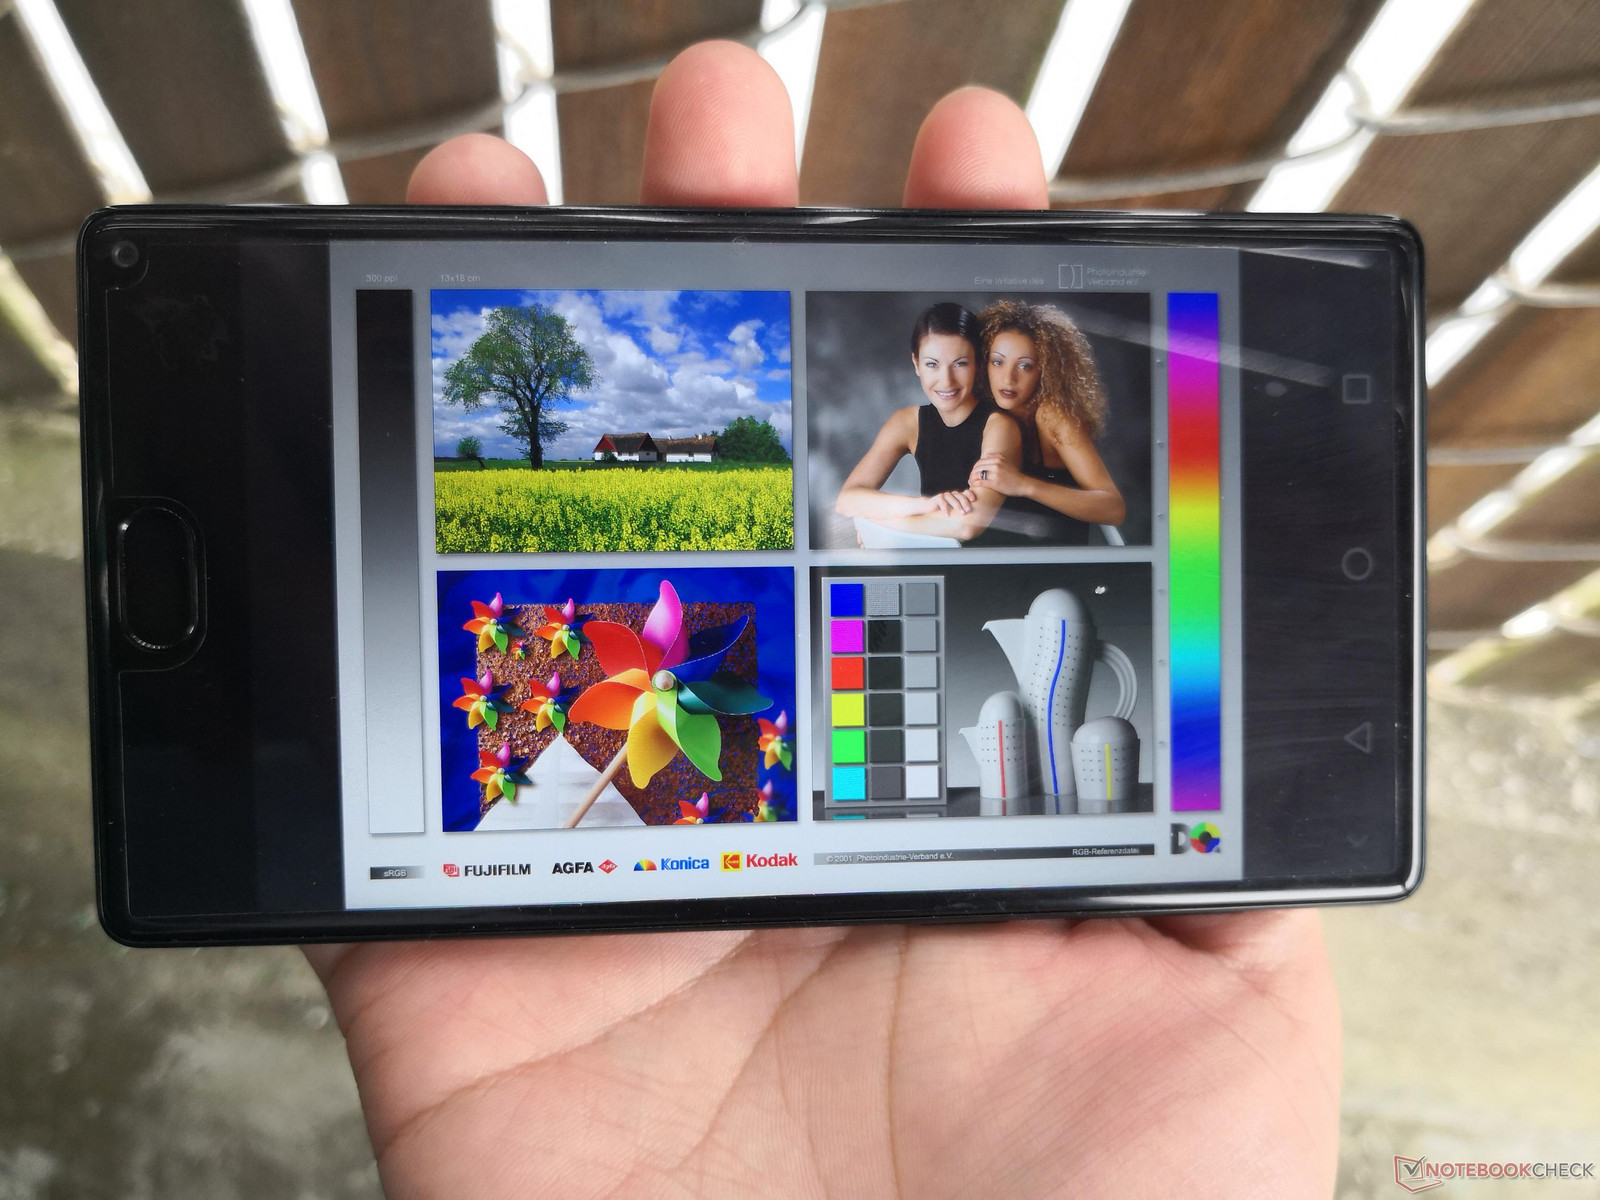
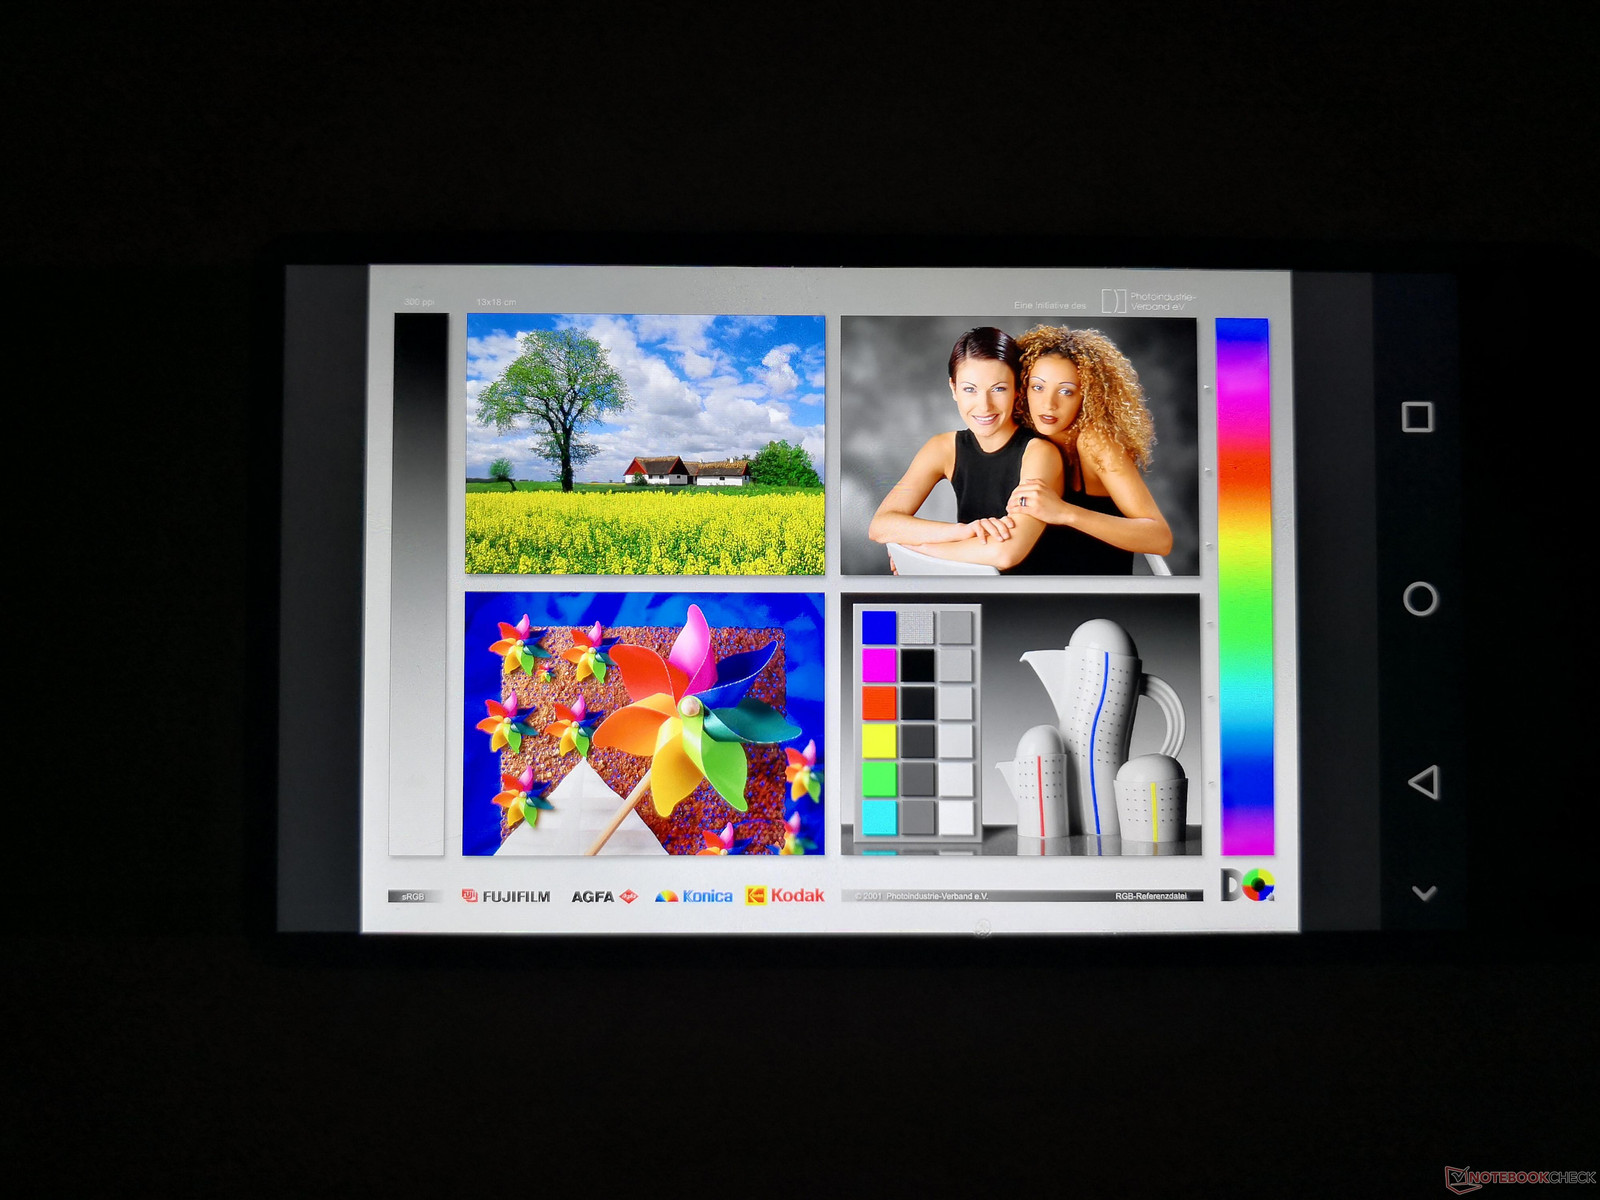
The 5.5-inch 1080p screen is crisp and very bright. While the manufacturer advertises a 400 nit backlight, we are able to measure a slightly higher average brightness of 444 nits. Contrast is excellent at about 1000:1 and response times are not significantly different from the competition.
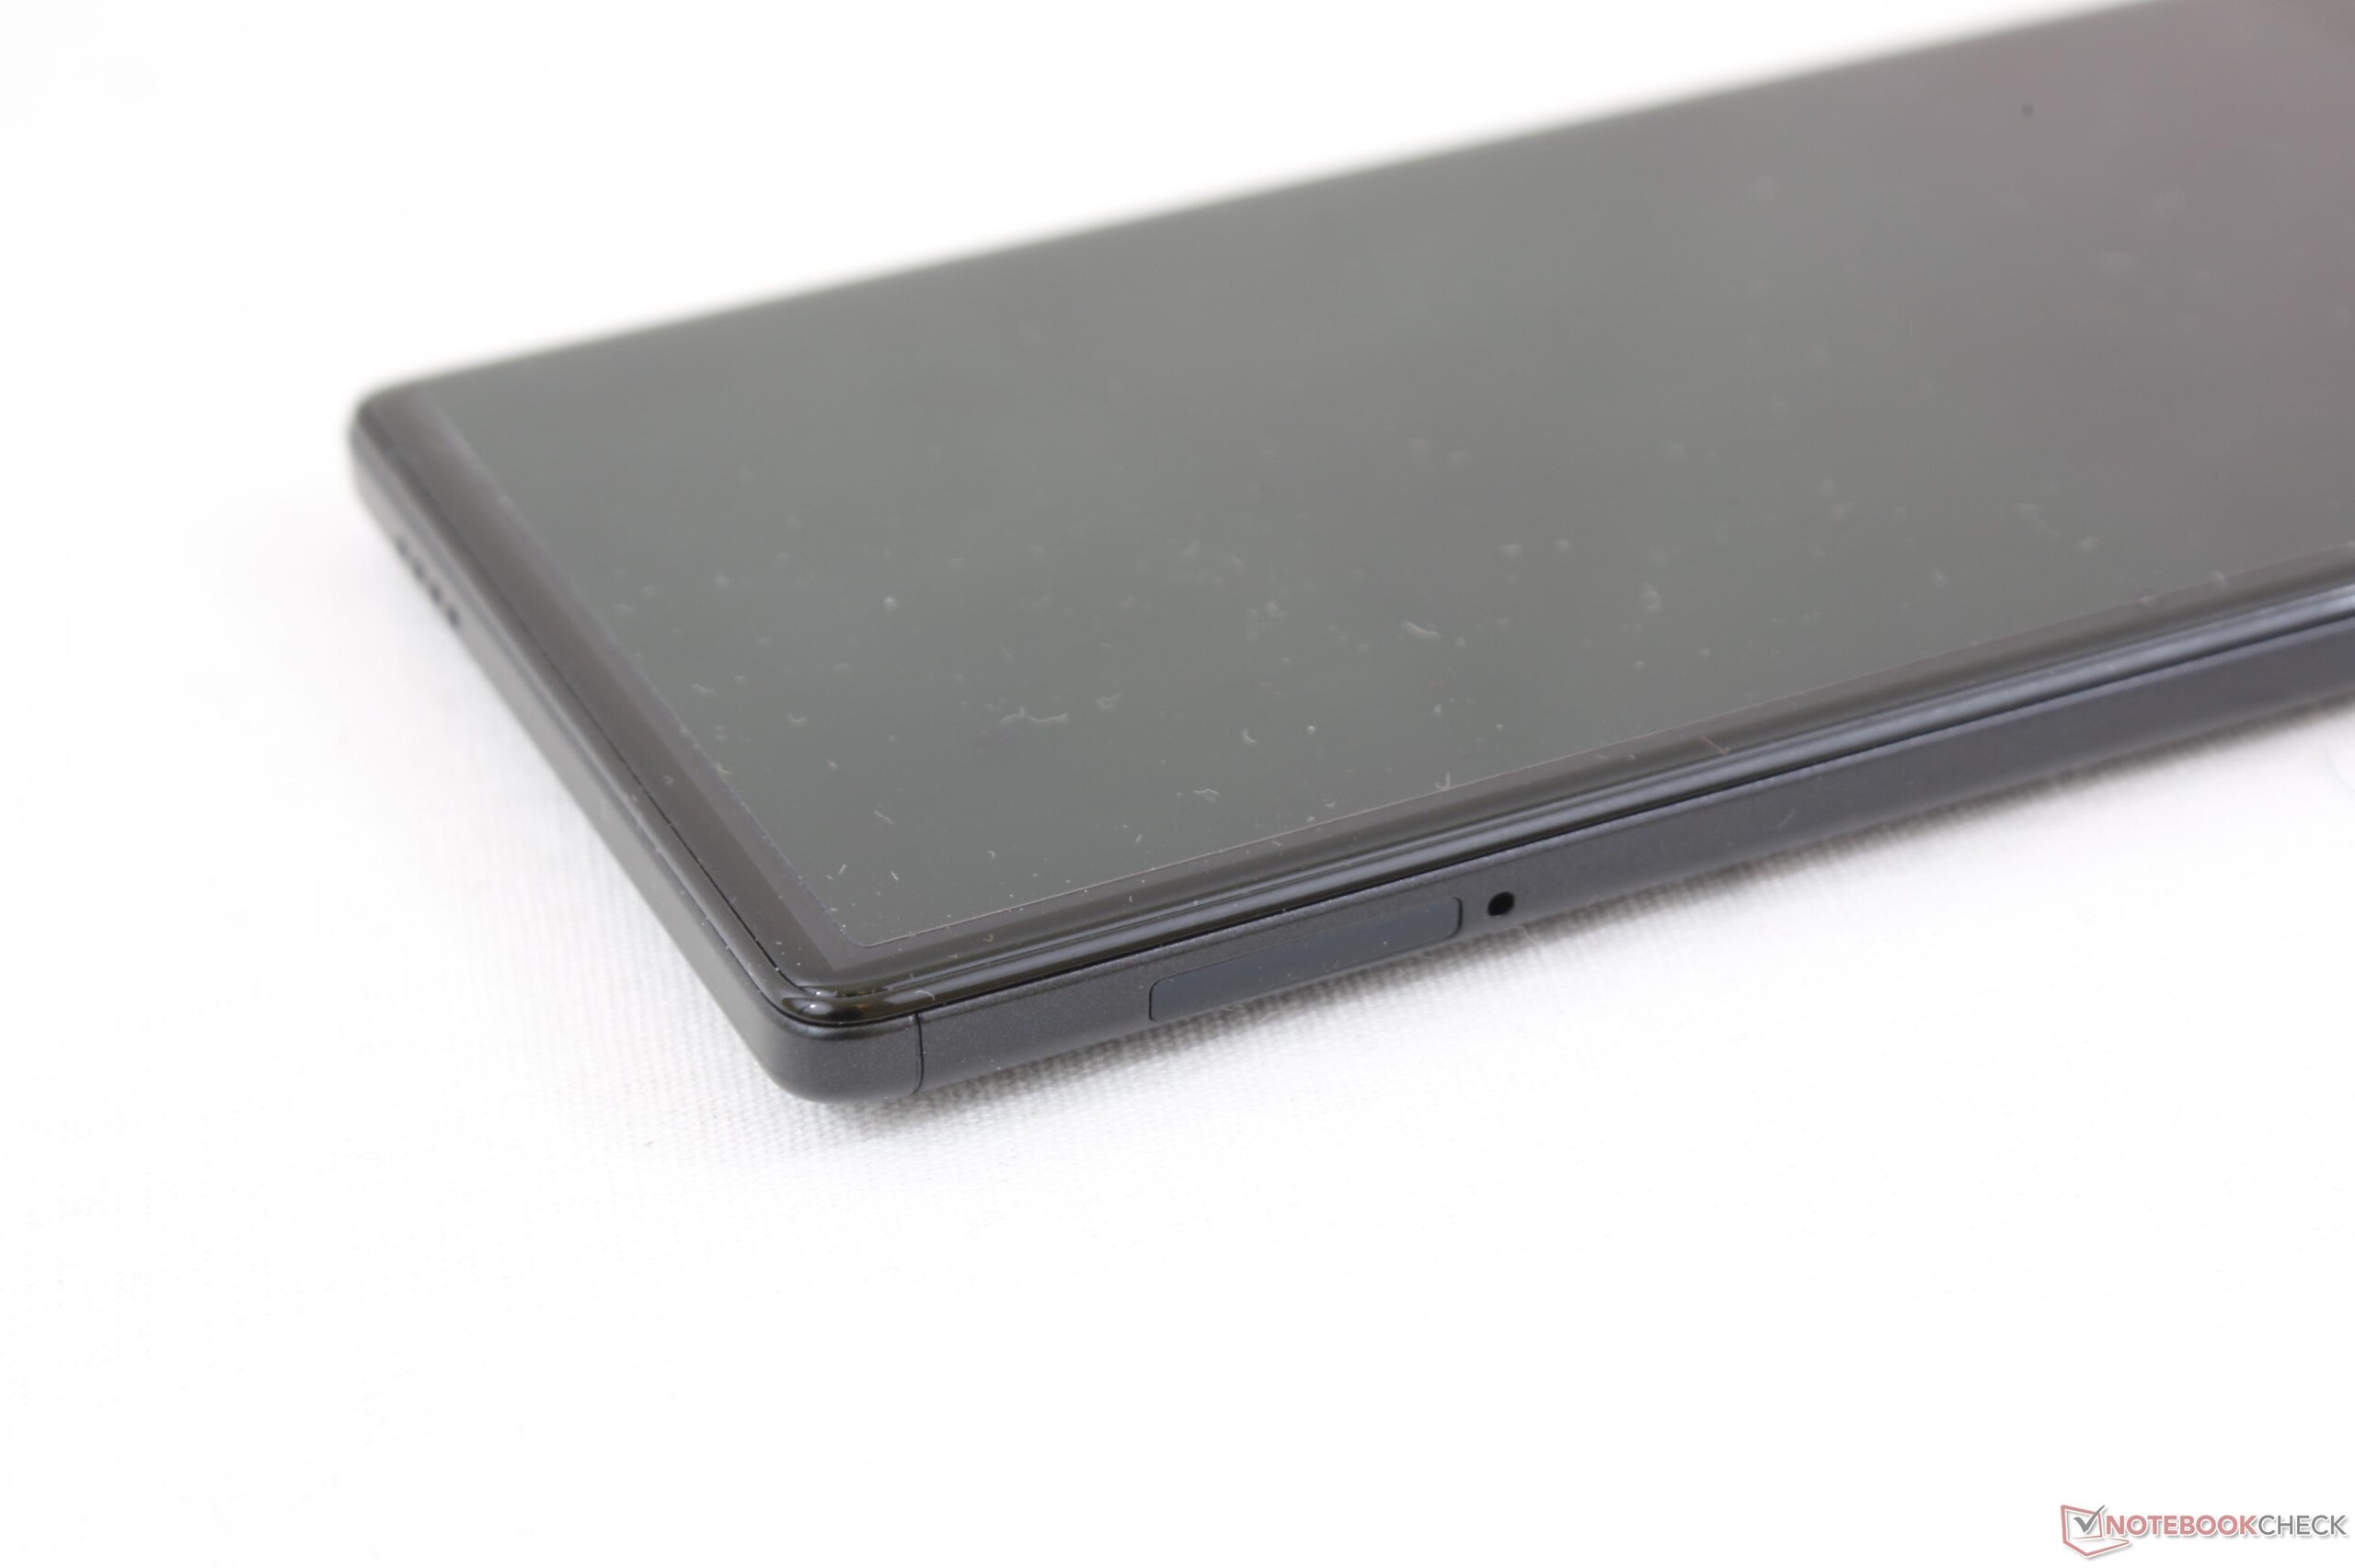
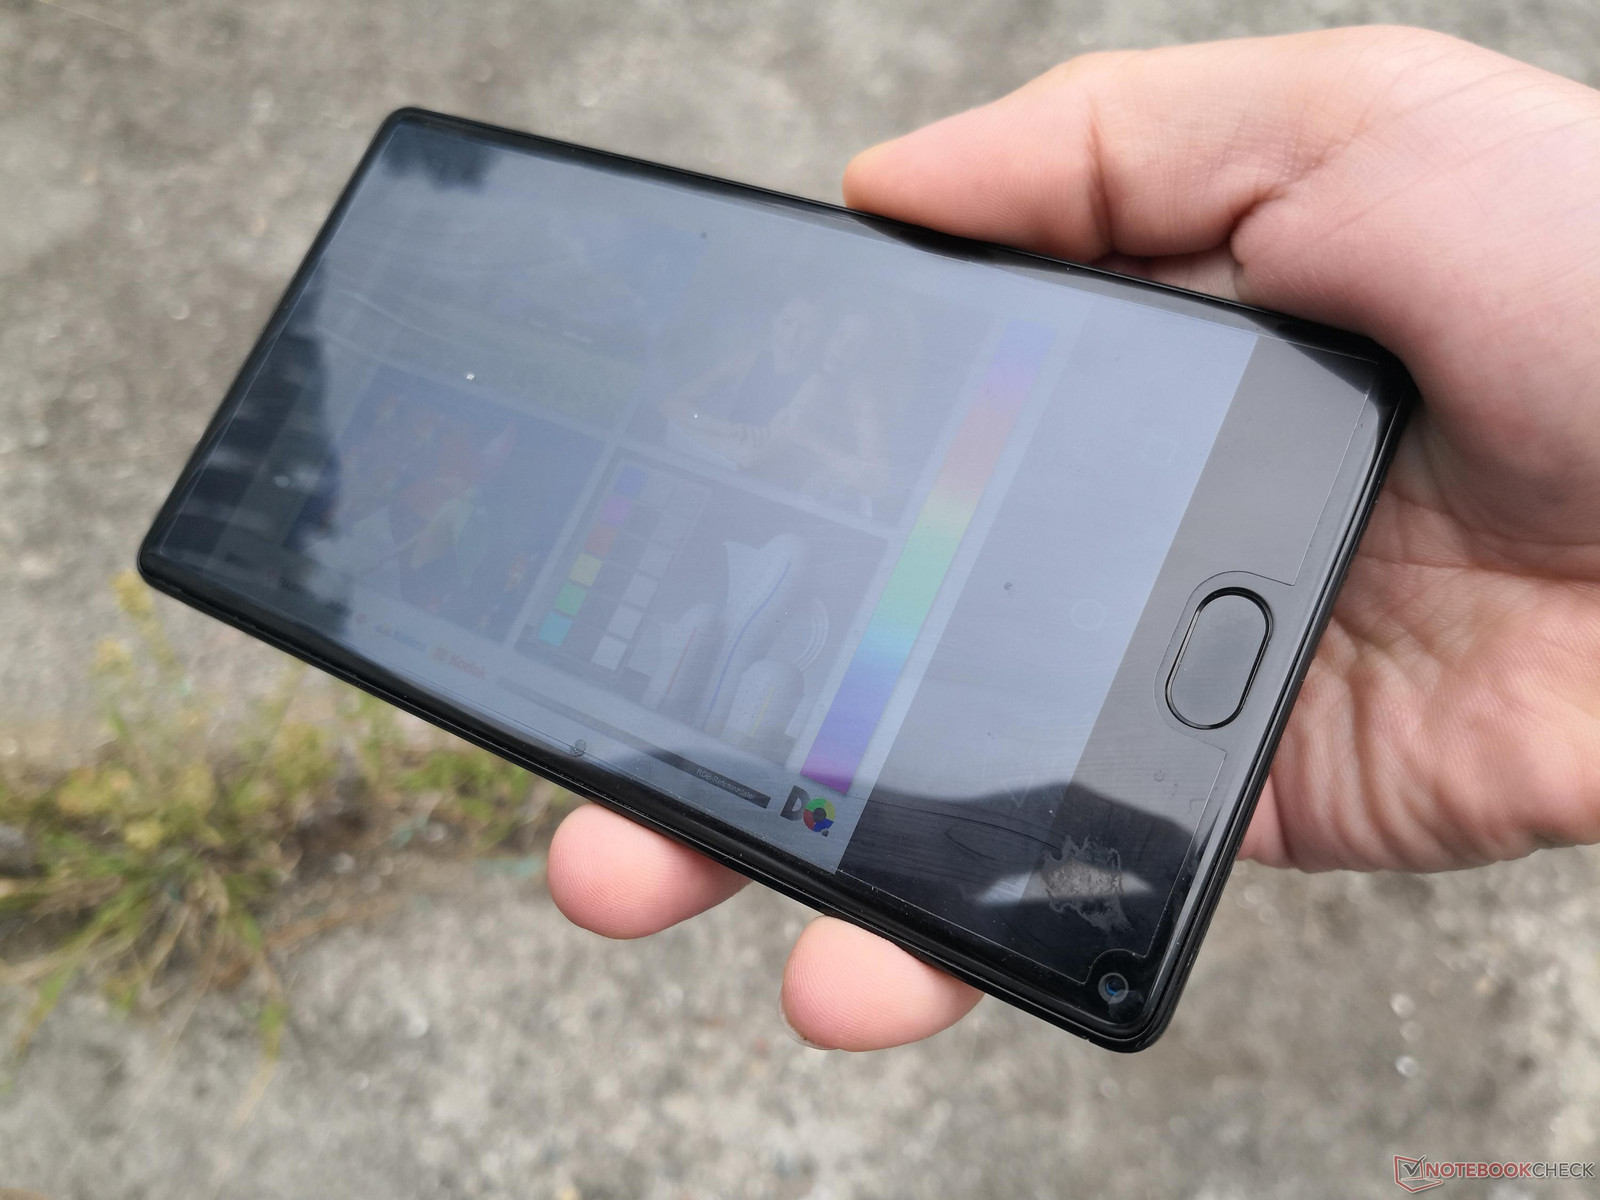
The main drawback of the display is its thick glass overlay. As a result, colors and onscreen content are under deeper layers and do not pop or appear as vibrant as on flagship smartphones.

| |||||||||||||||||||||||||
Brightness Distribution: 91 %
Center on Battery: 441 cd/m²
Contrast: 1002:1 (Black: 0.44 cd/m²)
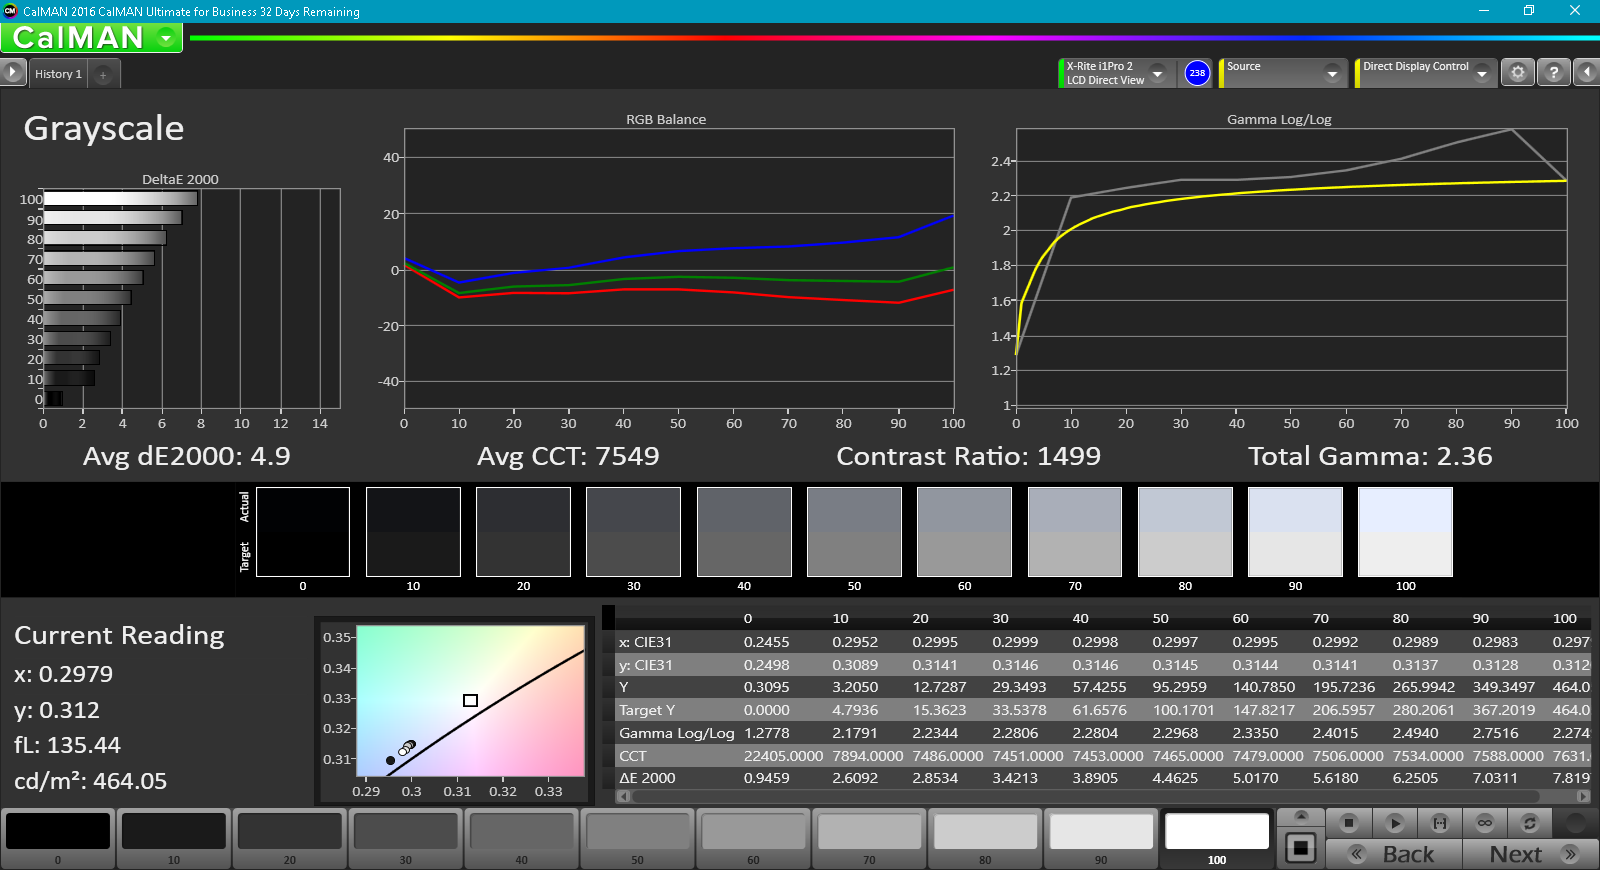
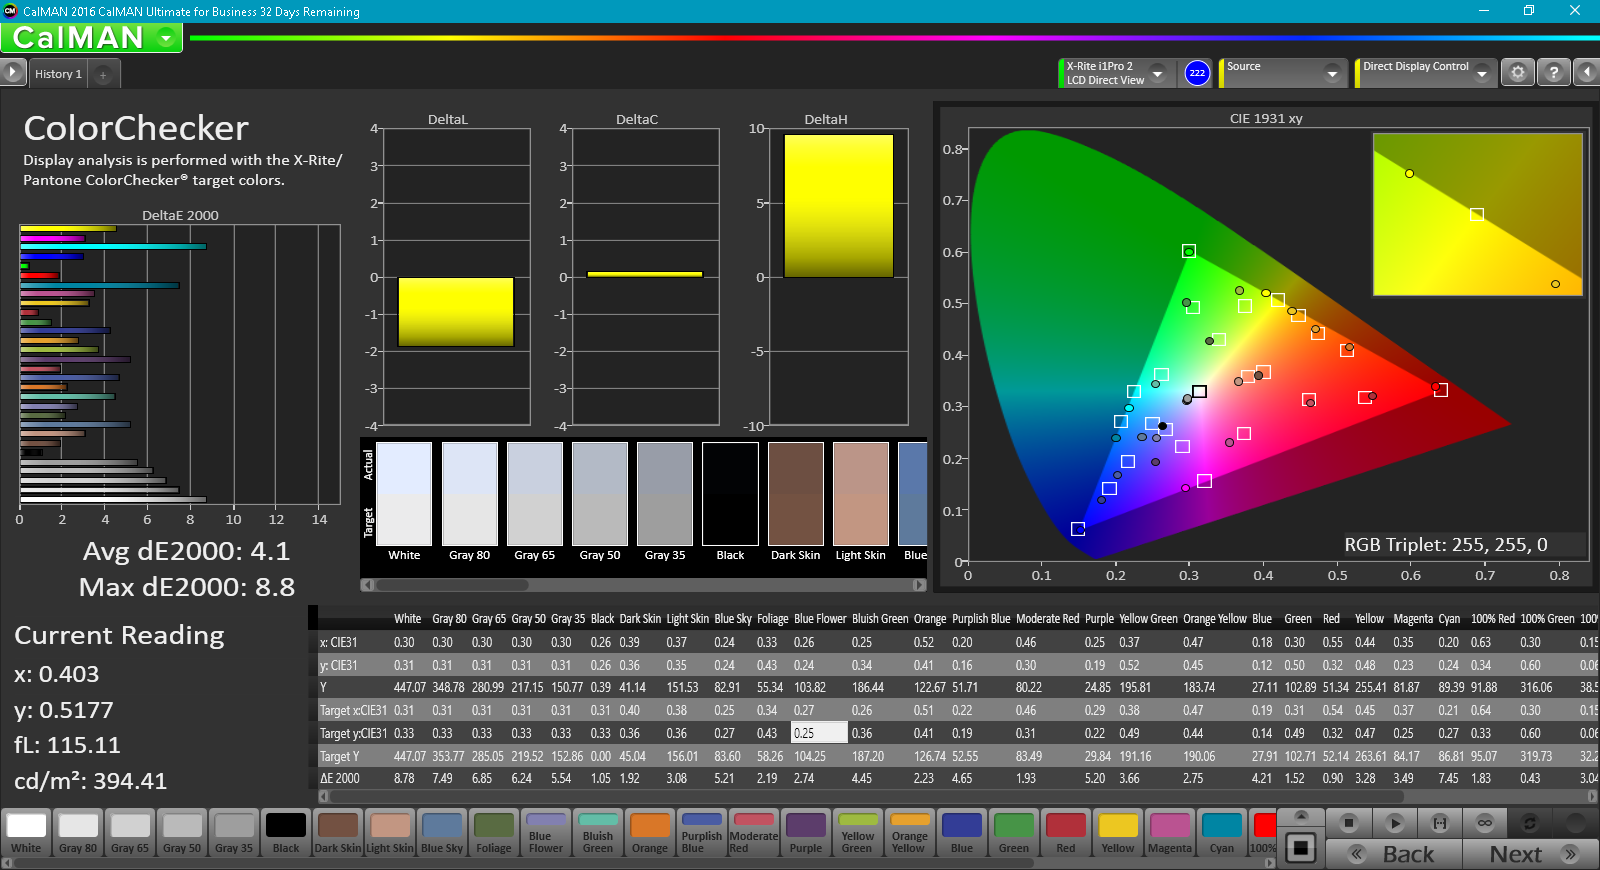
ΔE ColorChecker Calman: 4.1 | ∀{0.5-29.43 Ø4.79}
ΔE Greyscale Calman: 4.9 | ∀{0.09-98 Ø5}
Gamma: 2.36
CCT: 7549 K
| Leagoo Kiicaa Mix IPS, 5.5", 1920x1080 | Huawei Y7 IPS, 5.5", 1280x720 | Gretel GT6000 IPS, 5.5", 1280x720 | Doogee Mix AMOLED, 5.5", 1280x720 | Nokia 6 IPS, 5.5", 1920x1080 | LG X power2 IPS, 5.5", 1280x720 | |
|---|---|---|---|---|---|---|
| Response Times | -25% | 11% | 82% | -41% | -64% | |
| Response Time Grey 50% / Grey 80% * (ms) | 34.4 ? | 59.2 ? -72% | 33.6 ? 2% | 5.6 ? 84% | 48 ? -40% | 55.2 ? -60% |
| Response Time Black / White * (ms) | 24 ? | 18.4 ? 23% | 19.2 ? 20% | 4.8 ? 80% | 34 ? -42% | 40 ? -67% |
| PWM Frequency (Hz) | 2315 ? | 62.5 | ||||
| Screen | 11% | 19% | -12% | -4% | -5% | |
| Brightness middle (cd/m²) | 441 | 467 6% | 669 52% | 358 -19% | 512 16% | 237 -46% |
| Brightness (cd/m²) | 444 | 456 3% | 644 45% | 354 -20% | 501 13% | 237 -47% |
| Brightness Distribution (%) | 91 | 92 1% | 92 1% | 90 -1% | 94 3% | 92 1% |
| Black Level * (cd/m²) | 0.44 | 0.39 11% | 0.36 18% | 0.36 18% | 0.13 70% | |
| Contrast (:1) | 1002 | 1197 19% | 1858 85% | 1422 42% | 1823 82% | |
| Colorchecker dE 2000 * | 4.1 | 4.3 -5% | 4.4 -7% | 4.9 -20% | 6.4 -56% | 5.5 -34% |
| Colorchecker dE 2000 max. * | 8.8 | 6.8 23% | 9 -2% | 11.8 -34% | 10.9 -24% | 12.7 -44% |
| Greyscale dE 2000 * | 4.9 | 3.5 29% | 6.9 -41% | 3.9 20% | 7.2 -47% | 6.1 -24% |
| Gamma | 2.36 93% | 2.35 94% | 2.34 94% | 2.33 94% | 2.28 96% | 2.07 106% |
| CCT | 7549 86% | 7273 89% | 6675 97% | 7260 90% | 7904 82% | 7943 82% |
| Total Average (Program / Settings) | -7% /
4% | 15% /
17% | 35% /
11% | -23% /
-12% | -35% /
-17% |
* ... smaller is better
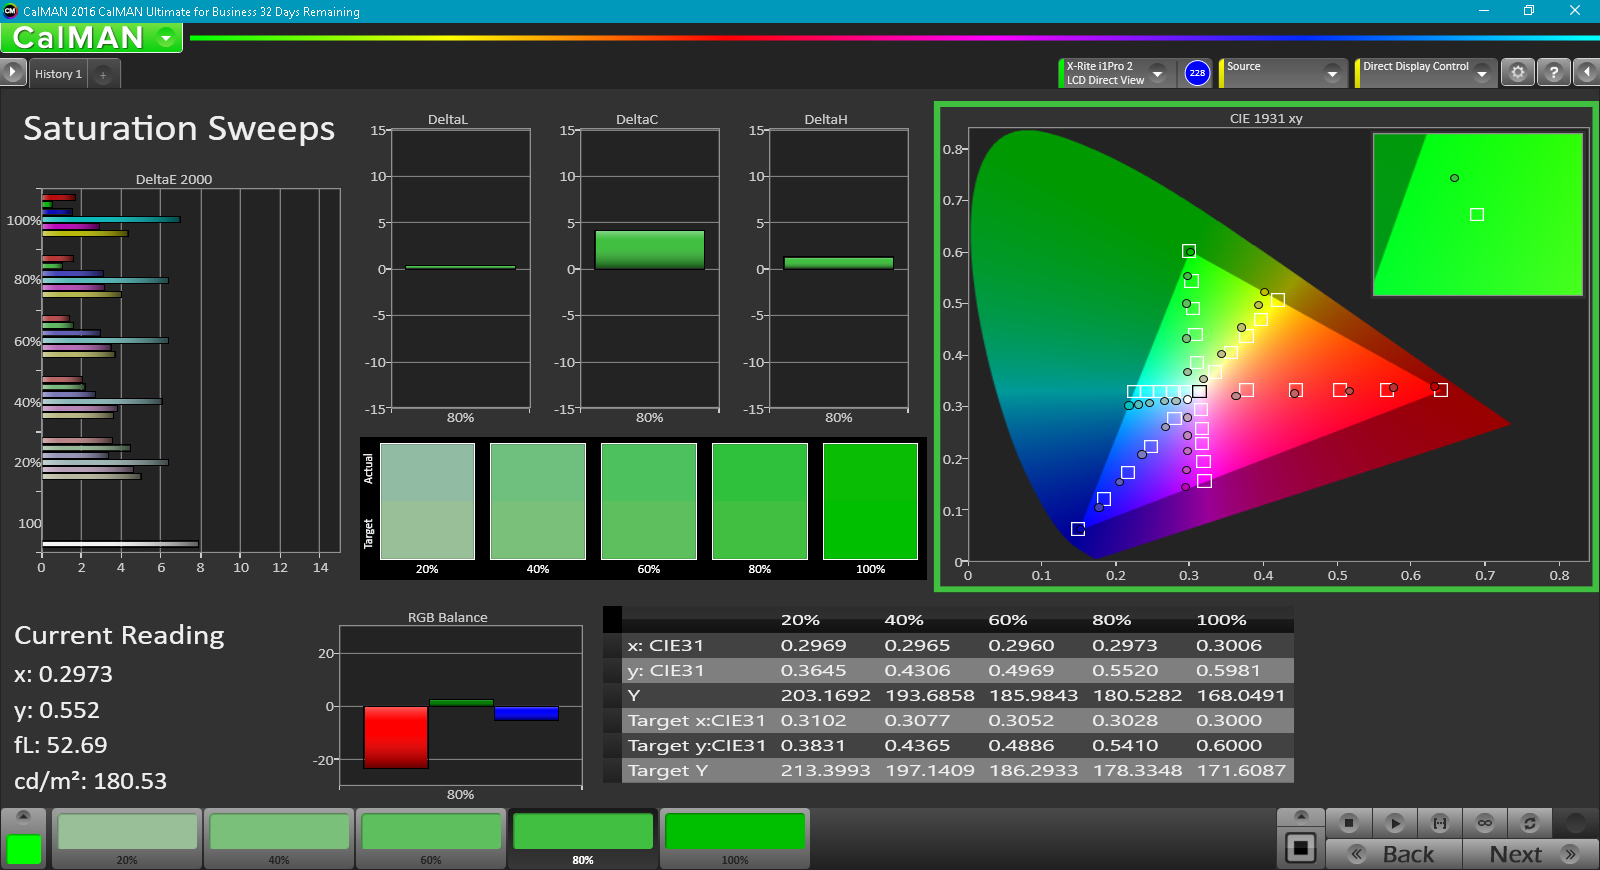
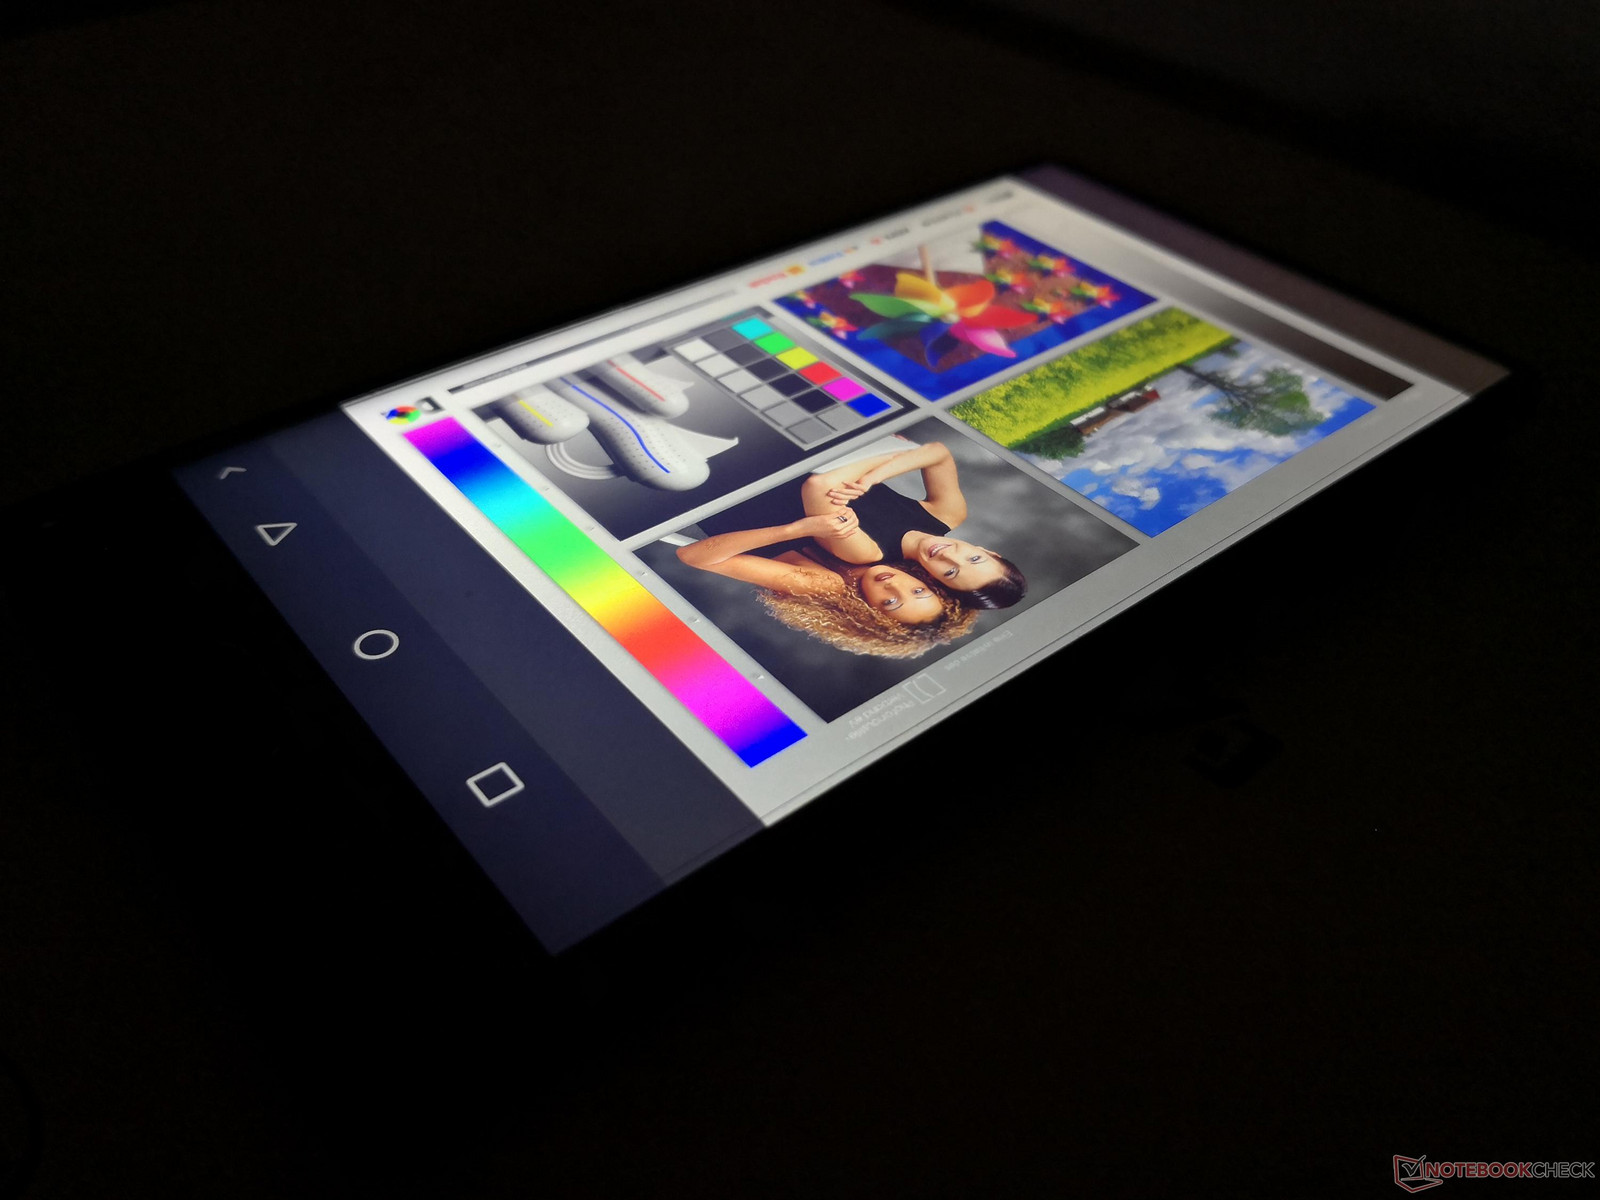
Colors are not well-balanced and color temperature is slightly on the cool side by default. Red and Green colors are meaurably more accurate than Yellow and Cyan colors on all tested saturation levels.
Display Response Times
| ↔ Response Time Black to White | ||
|---|---|---|
| 24 ms ... rise ↗ and fall ↘ combined | ↗ 13.2 ms rise | 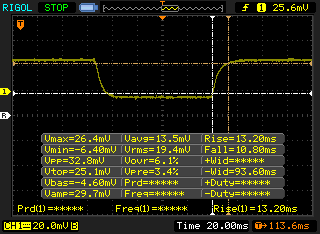 |
| ↘ 10.8 ms fall | ||
| The screen shows good response rates in our tests, but may be too slow for competitive gamers. In comparison, all tested devices range from 0.1 (minimum) to 240 (maximum) ms. » 53 % of all devices are better. This means that the measured response time is worse than the average of all tested devices (20.3 ms). | ||
| ↔ Response Time 50% Grey to 80% Grey | ||
| 34.4 ms ... rise ↗ and fall ↘ combined | ↗ 18.8 ms rise | 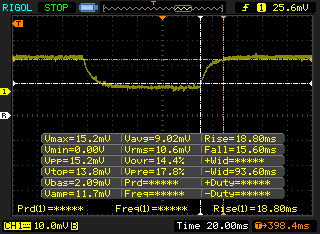 |
| ↘ 15.6 ms fall | ||
| The screen shows slow response rates in our tests and will be unsatisfactory for gamers. In comparison, all tested devices range from 0.165 (minimum) to 636 (maximum) ms. » 47 % of all devices are better. This means that the measured response time is similar to the average of all tested devices (31.7 ms). | ||
Screen Flickering / PWM (Pulse-Width Modulation)
| Screen flickering / PWM not detected | ≤ 100 % brightness setting | 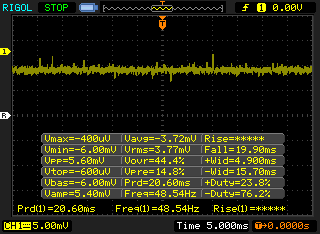 | |
In comparison: 53 % of all tested devices do not use PWM to dim the display. If PWM was detected, an average of 8156 (minimum: 5 - maximum: 343500) Hz was measured. | |||
Outdoor visibility is good under shade and just average when under brighter conditions. The backlight would have to be much brighter to overcome glare from sunlight and is even dimmer than on the Nokia 6.
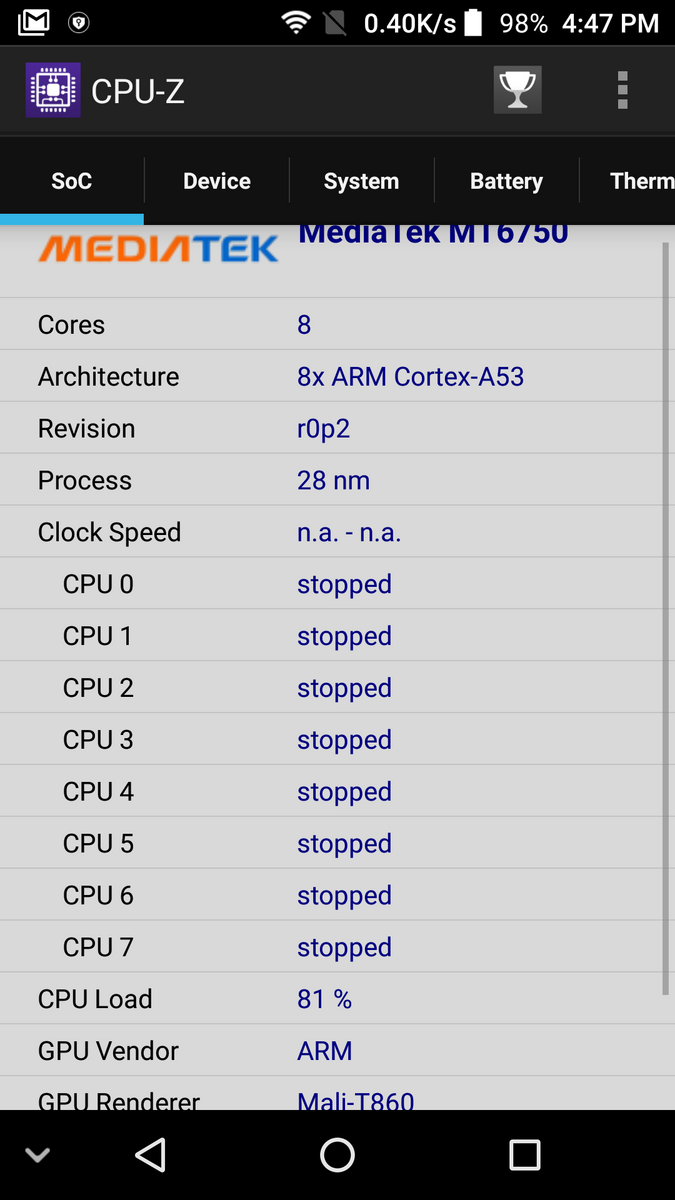
Performance
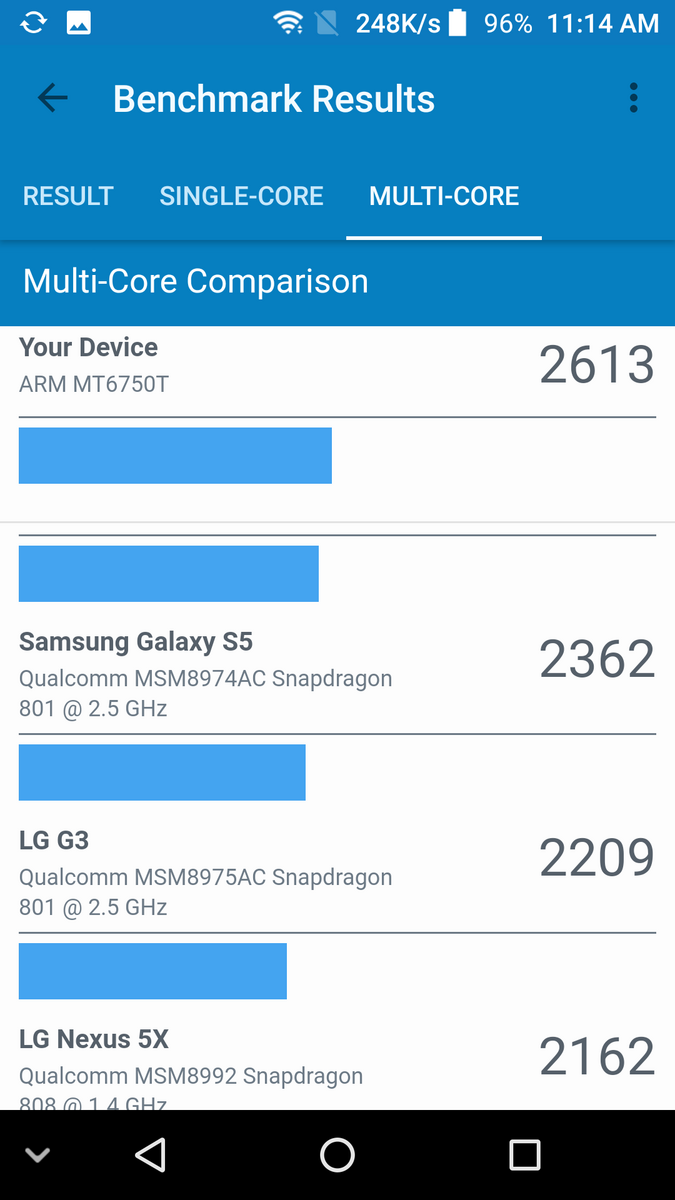
The octa-core MediaTek MT6750T with integrated Mali-T860 MP2 is an uncommon SoC even for budget smartphones. Only a small handful of devices carry the MT6750 including the LG K10, Oukitel K6000 Plus, and Doogee BL5000. Performance is roughly equivalent to the Snapdragon 617 and five-year old Tegra 4 SoC according to 3DMark Physics and Geekbench benchmarks.
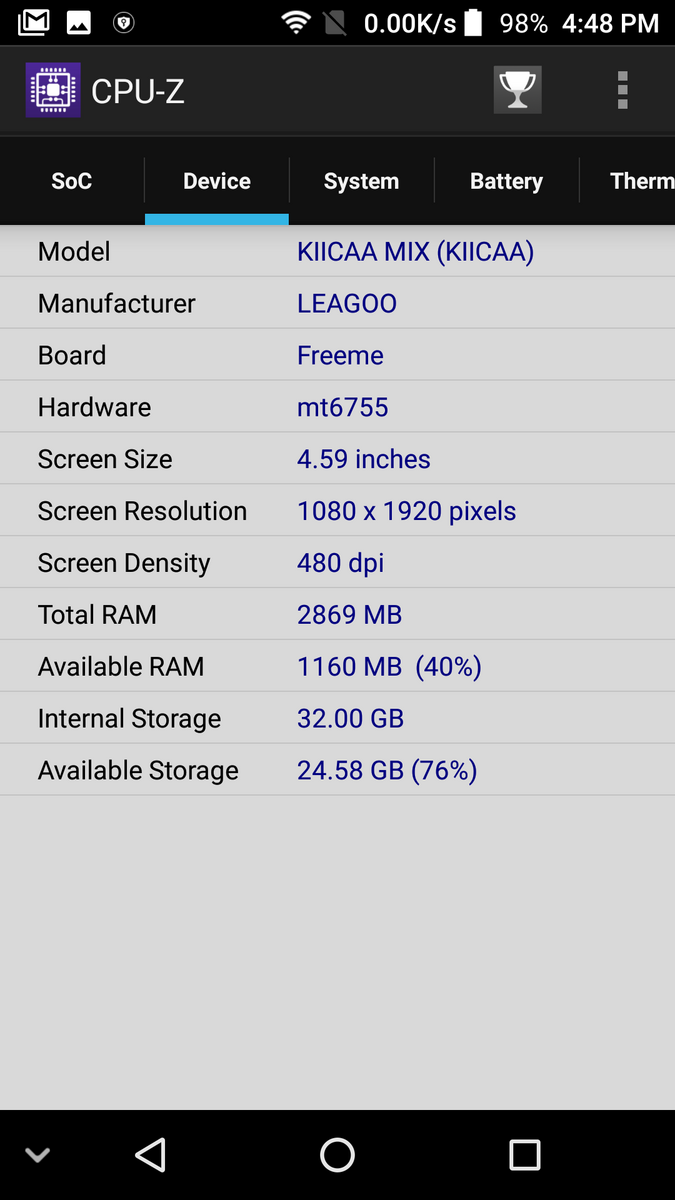
While the processor is not very fast, the roomy 3 GB of RAM is a pleasant surprise.


| AnTuTu v6 - Total Score (sort by value) | |
| Leagoo Kiicaa Mix | |
| Huawei Y7 | |
| Gretel GT6000 | |
| Doogee Mix | |
| Nokia 6 | |
| LG X power2 | |
| HTC Desire 10 Lifestyle | |
| HTC Desire 530 | |
| Xiaomi Redmi 3 | |
| OnePlus 5 | |
| PCMark for Android | |
| Work performance score (sort by value) | |
| Huawei Y7 | |
| Gretel GT6000 | |
| Doogee Mix | |
| Nokia 6 | |
| LG X power2 | |
| Motorola Moto G 3. Gen 2015 XT1541 | |
| HTC Desire 10 Lifestyle | |
| HTC Desire 530 | |
| Xiaomi Redmi 3 | |
| OnePlus 5 | |
| Work 2.0 performance score (sort by value) | |
| Leagoo Kiicaa Mix | |
| Huawei Y7 | |
| Gretel GT6000 | |
| Doogee Mix | |
| Nokia 6 | |
| LG X power2 | |
| OnePlus 5 | |
| Geekbench 4.4 | |
| 64 Bit Single-Core Score (sort by value) | |
| Leagoo Kiicaa Mix | |
| Huawei Y7 | |
| Gretel GT6000 | |
| Doogee Mix | |
| Nokia 6 | |
| LG X power2 | |
| OnePlus 5 | |
| 64 Bit Multi-Core Score (sort by value) | |
| Leagoo Kiicaa Mix | |
| Huawei Y7 | |
| Gretel GT6000 | |
| Doogee Mix | |
| Nokia 6 | |
| LG X power2 | |
| OnePlus 5 | |
| Compute RenderScript Score (sort by value) | |
| Leagoo Kiicaa Mix | |
| Huawei Y7 | |
| Gretel GT6000 | |
| Doogee Mix | |
| LG X power2 | |
| OnePlus 5 | |
| GFXBench (DX / GLBenchmark) 2.7 | |
| T-Rex Onscreen (sort by value) | |
| Huawei Y7 | |
| Gretel GT6000 | |
| Doogee Mix | |
| Nokia 6 | |
| LG X power2 | |
| Motorola Moto G 3. Gen 2015 XT1541 | |
| HTC Desire 10 Lifestyle | |
| HTC Desire 530 | |
| OnePlus 5 | |
| 1920x1080 T-Rex Offscreen (sort by value) | |
| Huawei Y7 | |
| Gretel GT6000 | |
| Doogee Mix | |
| Nokia 6 | |
| LG X power2 | |
| Motorola Moto G 3. Gen 2015 XT1541 | |
| HTC Desire 10 Lifestyle | |
| HTC Desire 530 | |
| OnePlus 5 | |
| GFXBench 3.0 | |
| on screen Manhattan Onscreen OGL (sort by value) | |
| Huawei Y7 | |
| Gretel GT6000 | |
| Doogee Mix | |
| Nokia 6 | |
| LG X power2 | |
| Motorola Moto G 3. Gen 2015 XT1541 | |
| HTC Desire 10 Lifestyle | |
| HTC Desire 530 | |
| OnePlus 5 | |
| 1920x1080 1080p Manhattan Offscreen (sort by value) | |
| Huawei Y7 | |
| Gretel GT6000 | |
| Doogee Mix | |
| Nokia 6 | |
| LG X power2 | |
| Motorola Moto G 3. Gen 2015 XT1541 | |
| HTC Desire 10 Lifestyle | |
| HTC Desire 530 | |
| OnePlus 5 | |
| GFXBench 3.1 | |
| on screen Manhattan ES 3.1 Onscreen (sort by value) | |
| Huawei Y7 | |
| Gretel GT6000 | |
| Doogee Mix | |
| Nokia 6 | |
| LG X power2 | |
| OnePlus 5 | |
| 1920x1080 Manhattan ES 3.1 Offscreen (sort by value) | |
| Huawei Y7 | |
| Gretel GT6000 | |
| Doogee Mix | |
| Nokia 6 | |
| LG X power2 | |
| OnePlus 5 | |
| GFXBench | |
| on screen Car Chase Onscreen (sort by value) | |
| Leagoo Kiicaa Mix | |
| Huawei Y7 | |
| Gretel GT6000 | |
| Doogee Mix | |
| Nokia 6 | |
| LG X power2 | |
| OnePlus 5 | |
| 1920x1080 Car Chase Offscreen (sort by value) | |
| Leagoo Kiicaa Mix | |
| Huawei Y7 | |
| Gretel GT6000 | |
| Doogee Mix | |
| Nokia 6 | |
| LG X power2 | |
| OnePlus 5 | |
| Lightmark - 1920x1080 1080p (sort by value) | |
| Leagoo Kiicaa Mix | |
| Doogee Mix | |
| Motorola Moto G 3. Gen 2015 XT1541 | |
| Xiaomi Redmi 3 | |
| Basemark ES 3.1 / Metal - offscreen Overall Score (sort by value) | |
| Doogee Mix | |
| Epic Citadel - Ultra High Quality (sort by value) | |
| Leagoo Kiicaa Mix | |
| Doogee Mix | |
| Motorola Moto G 3. Gen 2015 XT1541 | |
| Xiaomi Redmi 3 | |
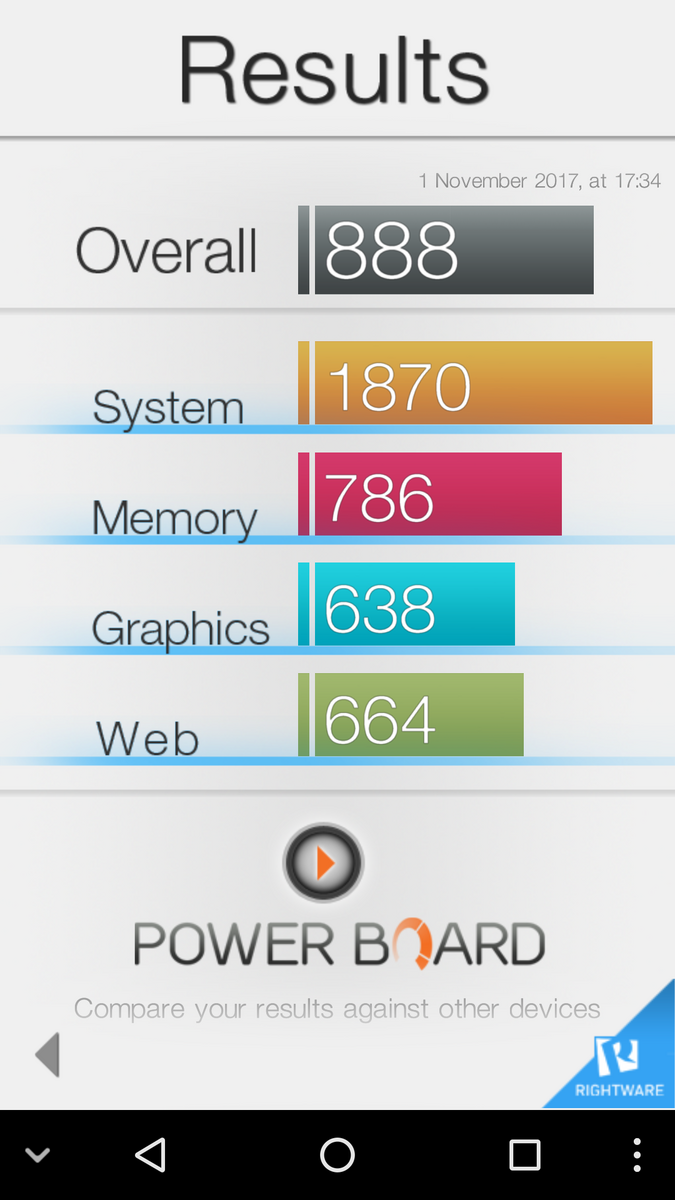
Browser-based benchmarks like Jetstream and WebXPRT rank the Leagoo alongside other inexpensive devices including the Huawei Y6 and Nokia 6. The Snapdragon 835 in the OnePlus 5 is able to outperform the Kiicaa Mix by almost 4x.
| JetStream 1.1 - Total Score | |
| OnePlus 5 (Chrome 59) | |
| Doogee Mix (Chrome 60) | |
| Xiaomi Redmi 3 (Chrome 47) | |
| Motorola Moto G 3. Gen 2015 XT1541 (Chrome 44) | |
| Huawei Y7 (Chrome 60) | |
| Leagoo Kiicaa Mix (Chrome 61.03163.98) | |
| HTC Desire 10 Lifestyle (Chrome 54) | |
| Nokia 6 (Chrome 59.0.3071.125) | |
| LG X power2 (Chrome 59) | |
| Gretel GT6000 (Chrome Version 51) | |
| HTC Desire 530 (Chrome 50) | |
| Octane V2 - Total Score | |
| OnePlus 5 (Chrome 59) | |
| Doogee Mix (Chrome 60) | |
| Xiaomi Redmi 3 (Chrome 47) | |
| Motorola Moto G 3. Gen 2015 XT1541 (Chrome 44) | |
| Huawei Y7 (Chrome 60) | |
| Leagoo Kiicaa Mix (Chrome 61.03163.98) | |
| Nokia 6 (Chrome 59.0.3071.125) | |
| LG X power2 (Chrome 59) | |
| Gretel GT6000 (Chrome Version 51) | |
| HTC Desire 10 Lifestyle (Chrome 54) | |
| HTC Desire 530 (Chrome 50) | |
| Mozilla Kraken 1.1 - Total | |
| Gretel GT6000 (Chrome Version 51) | |
| HTC Desire 530 (Chrome 50) | |
| LG X power2 (Chrome 59) | |
| Leagoo Kiicaa Mix (Chrome 61.03163.98) | |
| Xiaomi Redmi 3 (Chrome 47) | |
| HTC Desire 10 Lifestyle (Chrome 54) | |
| Nokia 6 (Chrome 59.0.3071.125) | |
| Motorola Moto G 3. Gen 2015 XT1541 (Chrome 44) | |
| Huawei Y7 (Chrome 60) | |
| Doogee Mix (Chrome 60) | |
| OnePlus 5 (Chrome 59) | |
| WebXPRT 2015 - Overall | |
| OnePlus 5 (Chrome 59) | |
| Doogee Mix (Chrome 60) | |
| Leagoo Kiicaa Mix (Chrome 61.03163.98) | |
| Xiaomi Redmi 3 (Chrome 47) | |
| Nokia 6 (Chrome 59.0.3071.125) | |
| LG X power2 (Chrome 59) | |
| Motorola Moto G 3. Gen 2015 XT1541 (Chrome 44) | |
| HTC Desire 10 Lifestyle (Chrome 54) | |
| Huawei Y7 (Chrome 60) | |
| HTC Desire 530 (Chrome 50) | |
* ... smaller is better
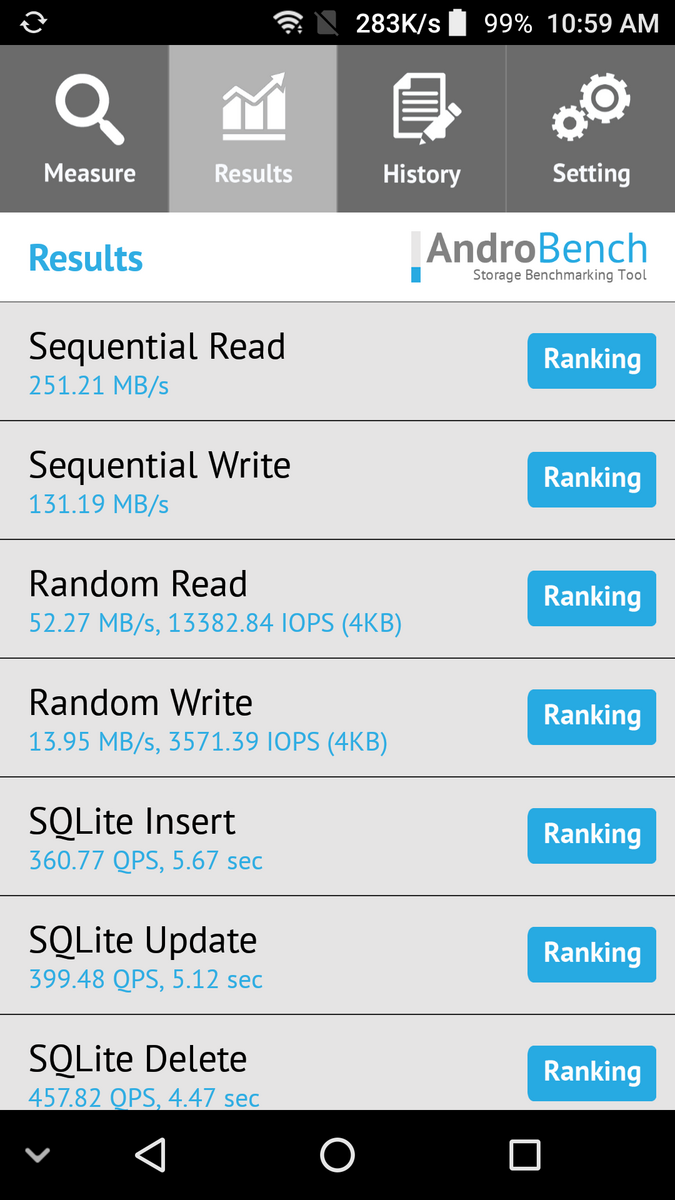
The internal 32 GB storage is quite fast. AndroBench reports sequential read and write rates as 251 MB/s and 131 MB/s, respectively, to be faster than the Huawei Y7 and on par with the Doogee Mix.
| Leagoo Kiicaa Mix | Huawei Y7 | Gretel GT6000 | Doogee Mix | Nokia 6 | LG X power2 | OnePlus 5 | |
|---|---|---|---|---|---|---|---|
| AndroBench 3-5 | -44% | -46% | 8% | -22% | -37% | 115% | |
| Sequential Read 256KB (MB/s) | 251.2 | 119.4 -52% | 215 -14% | 249 -1% | 273.1 9% | 243.8 -3% | 748 198% |
| Sequential Write 256KB (MB/s) | 131.2 | 33.2 -75% | 44.16 -66% | 165 26% | 77.1 -41% | 41.7 -68% | 201.5 54% |
| Random Read 4KB (MB/s) | 52.3 | 53.2 2% | 19.4 -63% | 66.5 27% | 33.8 -35% | 25.3 -52% | 141 170% |
| Random Write 4KB (MB/s) | 13.95 | 6.9 -51% | 8.46 -39% | 11.2 -20% | 11.34 -19% | 10.7 -23% | 19.3 38% |
Games
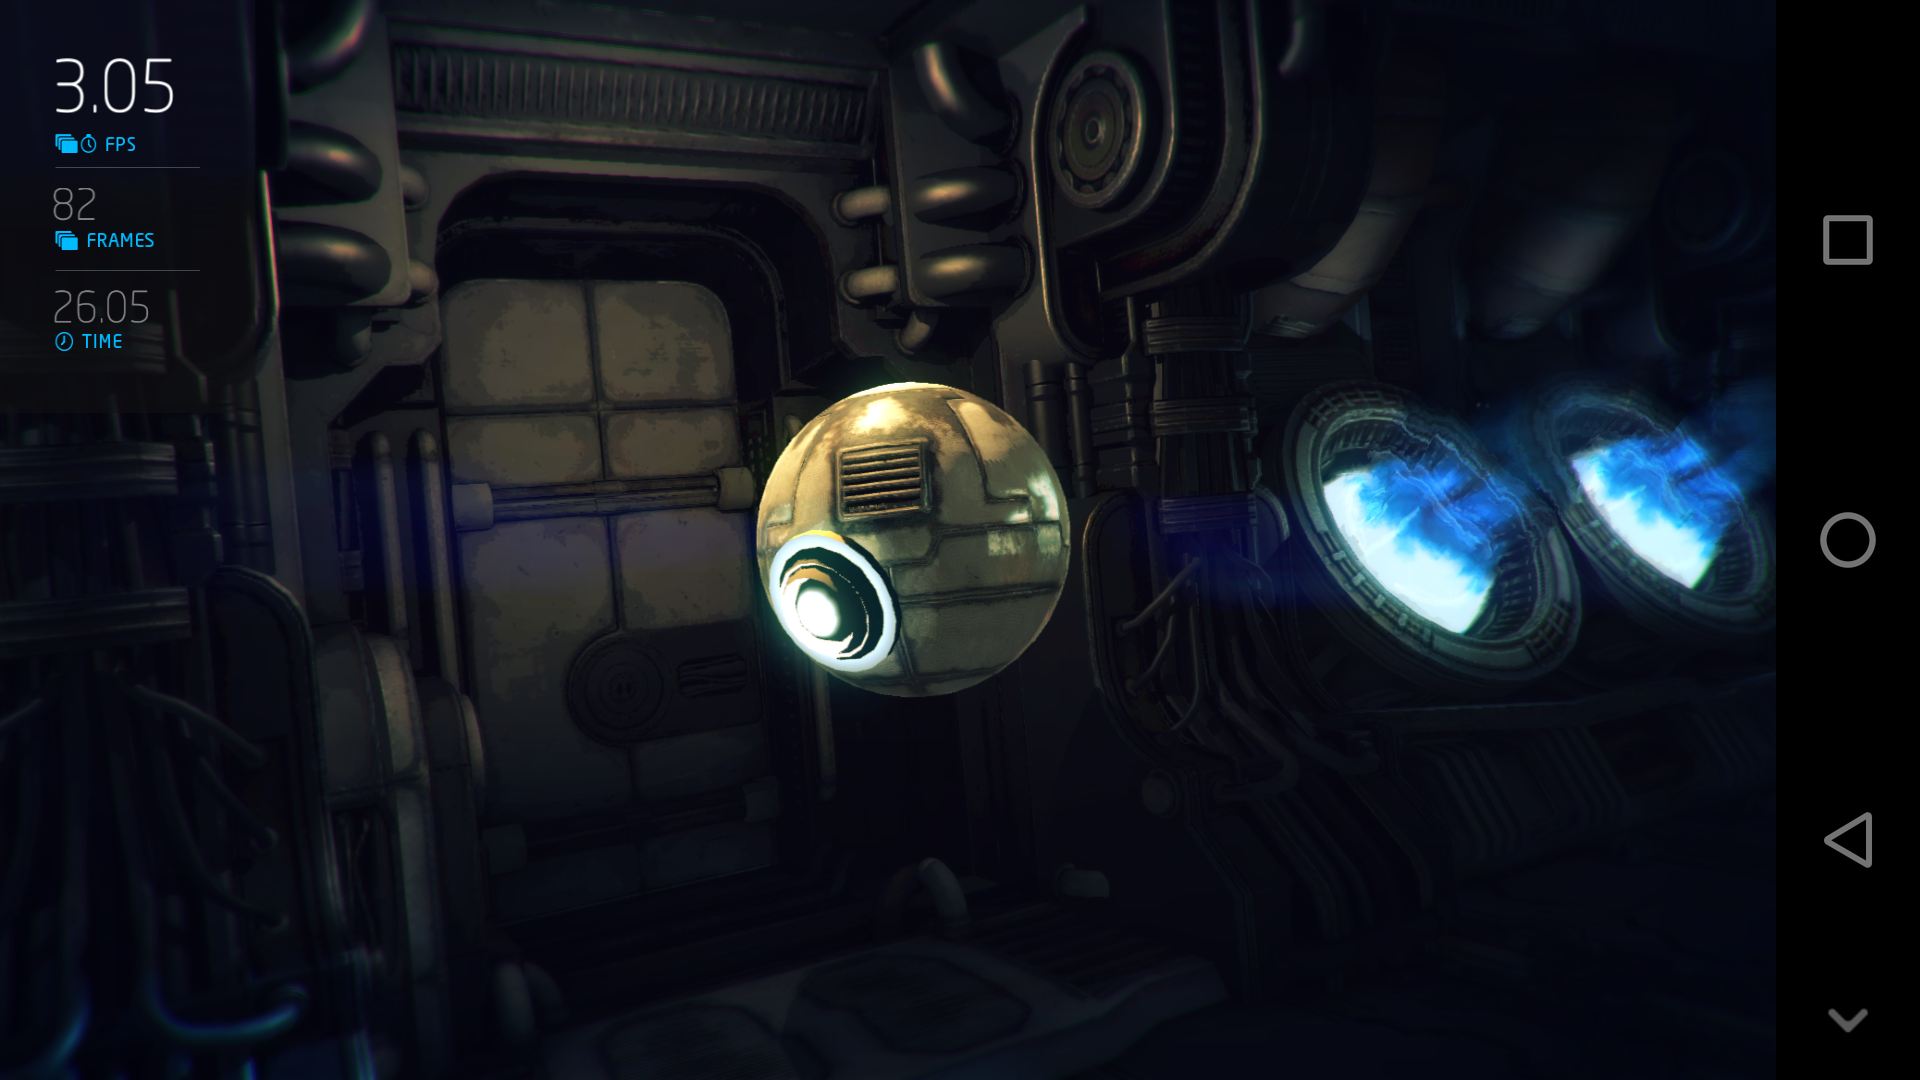
Asphalt 8 and the latest N.O.V.A. title are both playable. Perhaps annoyingly, frame rates appear to stutter on Asphalt 8 when more cars are onscreen at once. The relatively undemanding 3DMark Ice Storm benchmark is unable to run at a smooth 60 FPS.

Emissions
Temperature
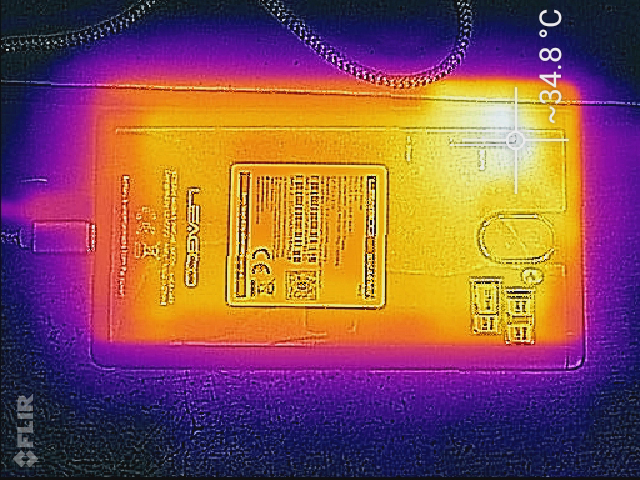
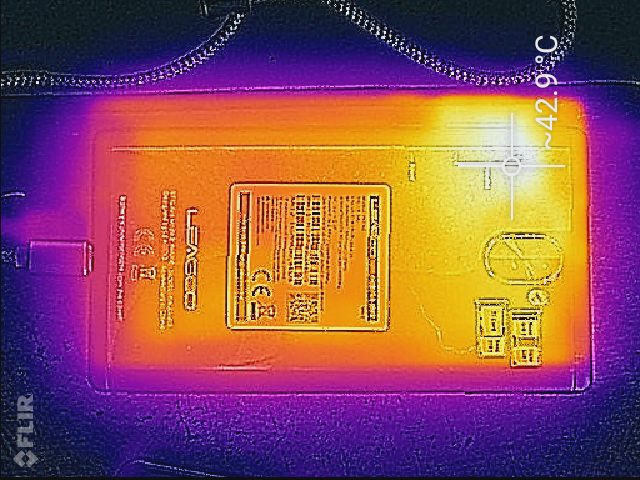
Two hot spots can be identified when the smartphone is under load. The first is on the front of the device nearest the Home button while the second is on the back adjacent to the cameras where the SoC likely resides. These areas can be 40 C or warmer when gaming or running other demanding applications. Albeit warm, the smartphone never becomes uncomfortable to hold in practice.
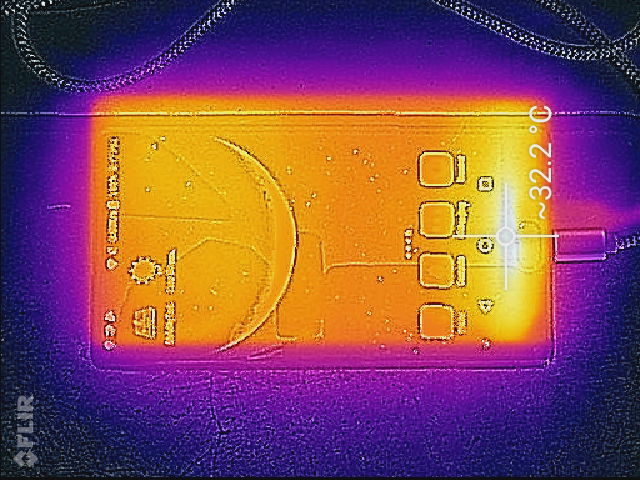
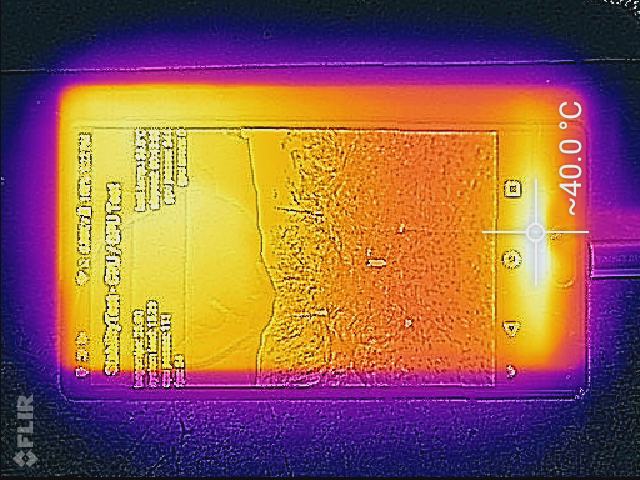
(±) The maximum temperature on the upper side is 40.2 °C / 104 F, compared to the average of 35.2 °C / 95 F, ranging from 21.9 to 247 °C for the class Smartphone.
(±) The bottom heats up to a maximum of 43 °C / 109 F, compared to the average of 34 °C / 93 F
(+) In idle usage, the average temperature for the upper side is 26.8 °C / 80 F, compared to the device average of 32.9 °C / 91 F.
Speakers
The internal speakerphone is unsurprisingly lacking in bass with the signature "tin can" quality typically associated with cheap devices. Maximum volume is loud enough when indoors but could have used more oomph if outdoors.
")


Leagoo Kiicaa Mix audio analysis
(±) | speaker loudness is average but good (73.4 dB)
Bass 100 - 315 Hz
(-) | nearly no bass - on average 32.2% lower than median
(+) | bass is linear (5.4% delta to prev. frequency)
Mids 400 - 2000 Hz
(±) | higher mids - on average 8.7% higher than median
(±) | linearity of mids is average (13.9% delta to prev. frequency)
Highs 2 - 16 kHz
(±) | higher highs - on average 6% higher than median
(±) | linearity of highs is average (7.5% delta to prev. frequency)
Overall 100 - 16.000 Hz
(-) | overall sound is not linear (38.4% difference to median)
Compared to same class
» 86% of all tested devices in this class were better, 0% similar, 14% worse
» The best had a delta of 11%, average was 35%, worst was 134%
Compared to all devices tested
» 94% of all tested devices were better, 1% similar, 5% worse
» The best had a delta of 4%, average was 24%, worst was 134%
Apple MacBook 12 (Early 2016) 1.1 GHz audio analysis
(+) | speakers can play relatively loud (83.6 dB)
Bass 100 - 315 Hz
(±) | reduced bass - on average 11.3% lower than median
(±) | linearity of bass is average (14.2% delta to prev. frequency)
Mids 400 - 2000 Hz
(+) | balanced mids - only 2.4% away from median
(+) | mids are linear (5.5% delta to prev. frequency)
Highs 2 - 16 kHz
(+) | balanced highs - only 2% away from median
(+) | highs are linear (4.5% delta to prev. frequency)
Overall 100 - 16.000 Hz
(+) | overall sound is linear (10.2% difference to median)
Compared to same class
» 7% of all tested devices in this class were better, 2% similar, 91% worse
» The best had a delta of 5%, average was 18%, worst was 53%
Compared to all devices tested
» 4% of all tested devices were better, 1% similar, 94% worse
» The best had a delta of 4%, average was 24%, worst was 134%
Frequency Comparison (Checkbox selectable!)
Graph 1: Pink Noise 100% Vol.; Graph 2: Audio off
Energy Management
Power Consumption
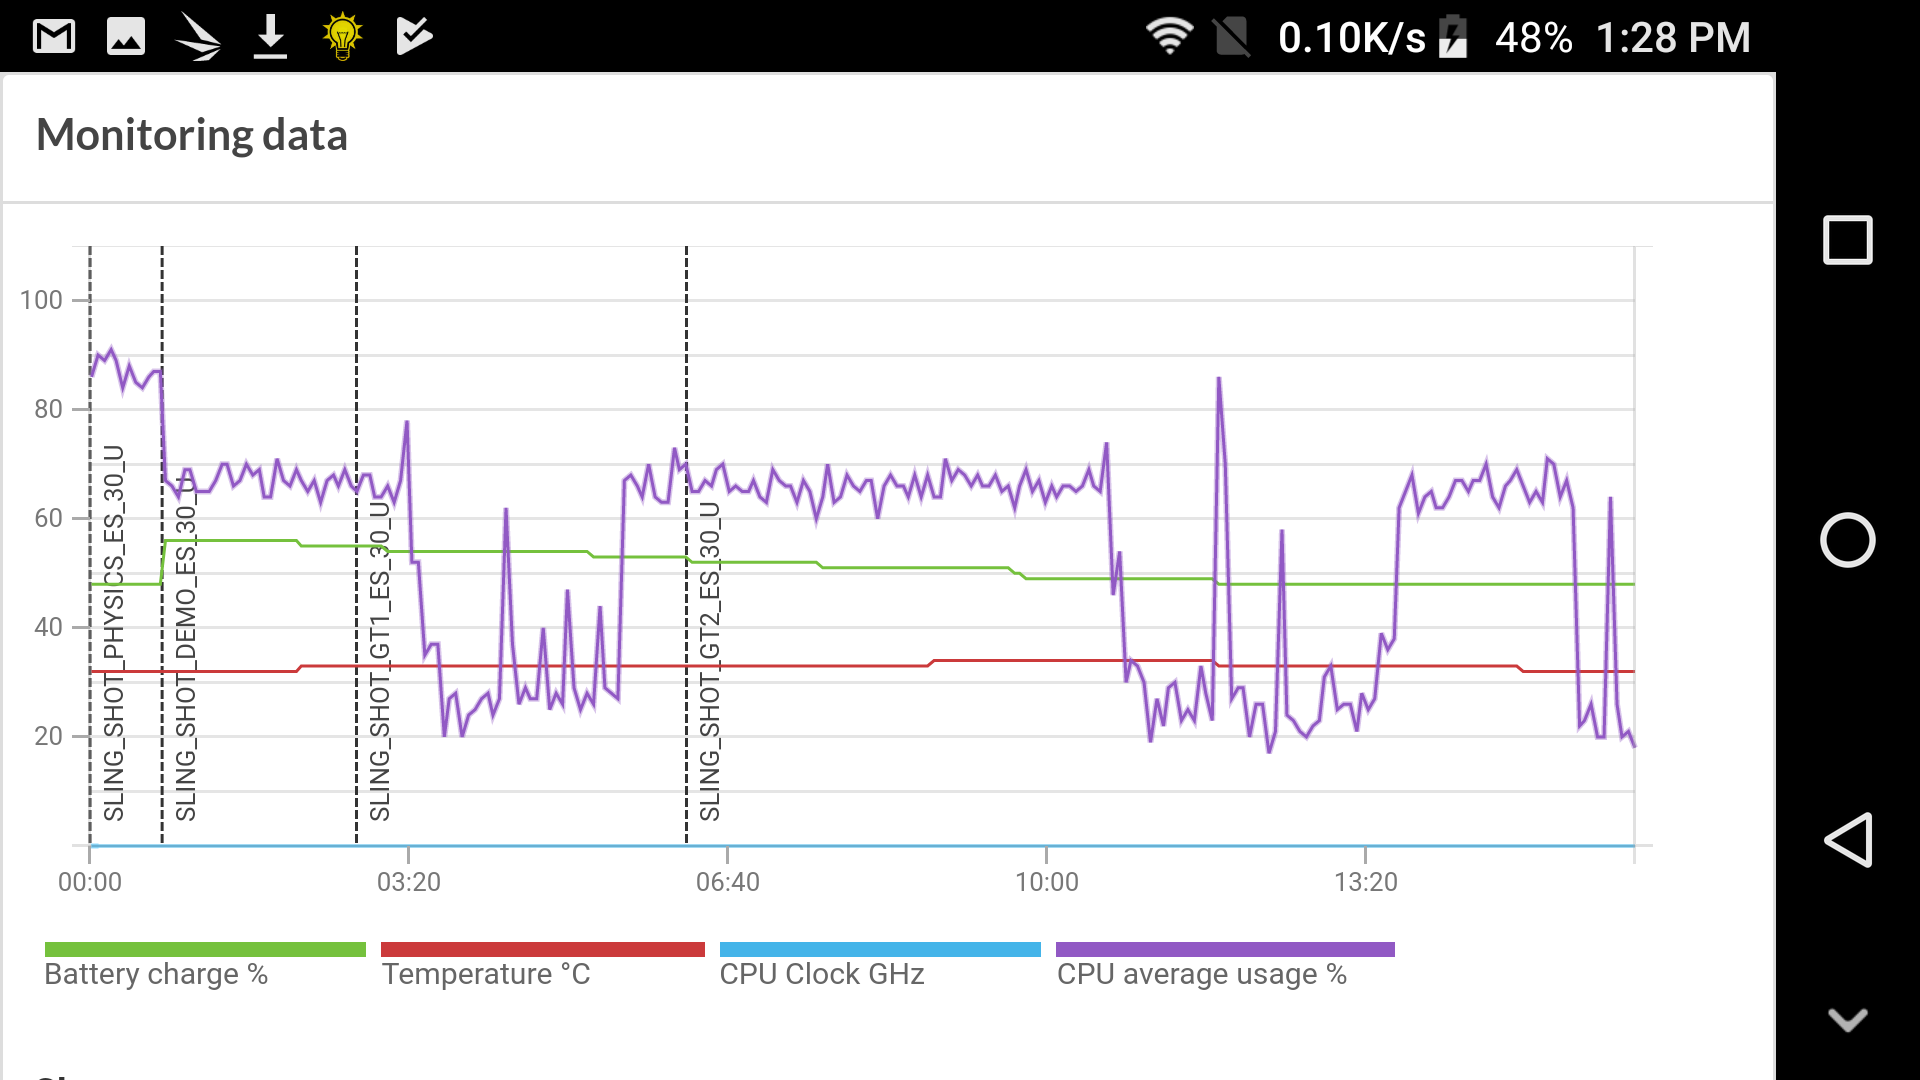
The Leagoo is slightly more power-hungry than the competition. Note that average load consumes more power than maximum load when running Stability Test possibly due to throttling of the SoC.
Strangely, the smartphone consumes 3.4 W when turned off and connected to the AC outlet. We double-checked to make sure that the battery was fully charged, but the result did not change.
| Off / Standby | |
| Idle | |
| Load |
|
Key:
min: | |
| Leagoo Kiicaa Mix MT6750, Mali-T860 MP2, 32 GB eMMC Flash, IPS, 1920x1080, 5.5" | Huawei Y7 435, Adreno 505, 16 GB eMMC Flash, IPS, 1280x720, 5.5" | Gretel GT6000 MT6737, Mali-T720, 16 GB eMMC Flash, IPS, 1280x720, 5.5" | Doogee Mix Helio P25, Mali-T880 MP2, 64 GB eMMC Flash, AMOLED, 1280x720, 5.5" | Nokia 6 430, Adreno 505, 32 GB eMMC Flash, IPS, 1920x1080, 5.5" | LG X power2 MT6750, Mali-T860 MP2, 16 GB eMMC Flash, IPS, 1280x720, 5.5" | |
|---|---|---|---|---|---|---|
| Power Consumption | 34% | 8% | 23% | 20% | 5% | |
| Idle Minimum * (Watt) | 2 | 0.57 71% | 0.96 52% | 1.13 43% | 0.63 68% | 0.63 68% |
| Idle Average * (Watt) | 2.5 | 1.61 36% | 1.8 28% | 1.7 32% | 1.75 30% | 1.42 43% |
| Idle Maximum * (Watt) | 2.9 | 1.62 44% | 1.89 35% | 1.74 40% | 1.87 36% | 1.47 49% |
| Load Average * (Watt) | 6.1 | 3.09 49% | 5.3 13% | 2.78 54% | 3.56 42% | 5.89 3% |
| Load Maximum * (Watt) | 3.3 | 4.26 -29% | 6.15 -86% | 5.01 -52% | 5.85 -77% | 7.85 -138% |
* ... smaller is better
Battery Life
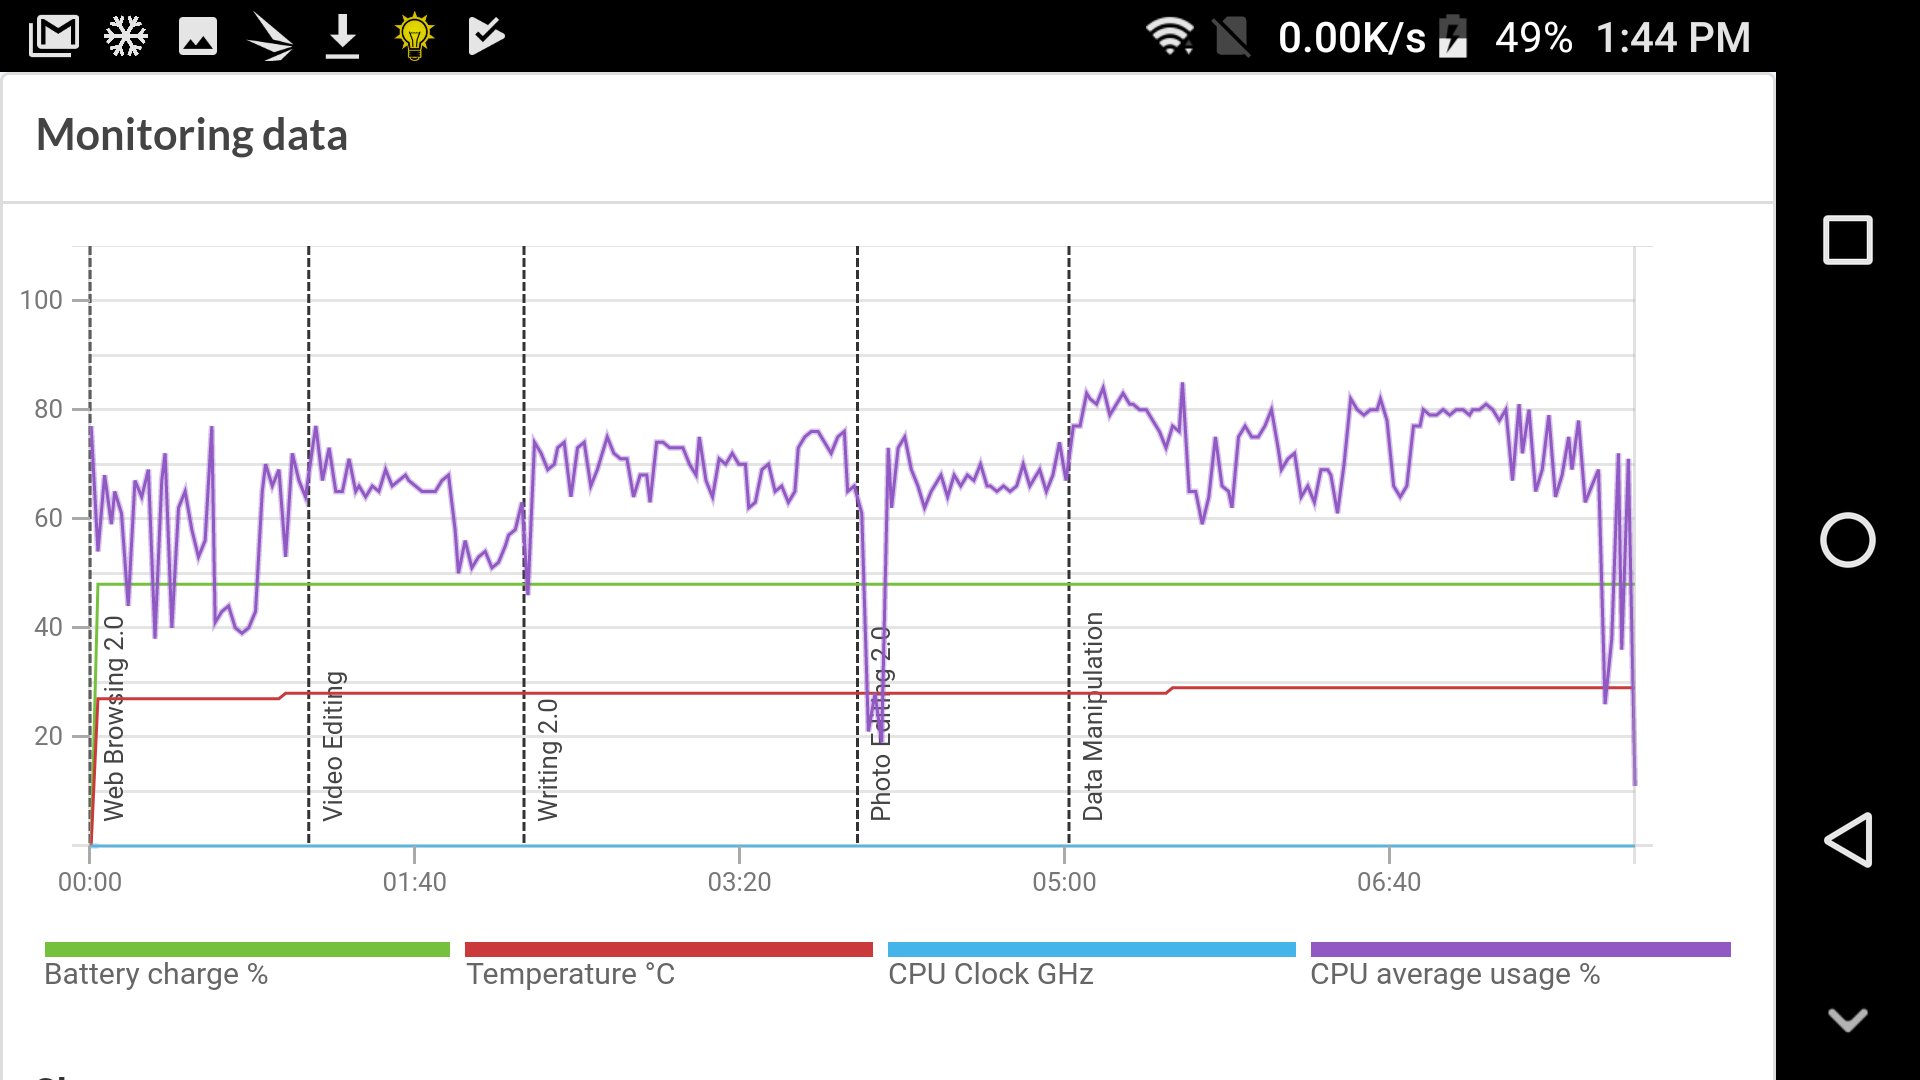
Runtimes from the internal 3000 mAh battery are poor. Browsing the net will last just over 4 hours compared to more than twice that from the Doogee Mix or Huawei Y7 when under similar WLAN conditions.
| Leagoo Kiicaa Mix MT6750, Mali-T860 MP2, Wh | Huawei Y7 435, Adreno 505, 15.2 Wh | Gretel GT6000 MT6737, Mali-T720, Wh | Doogee Mix Helio P25, Mali-T880 MP2, 12.77 Wh | Nokia 6 430, Adreno 505, Wh | LG X power2 MT6750, Mali-T860 MP2, 17.1 Wh | |
|---|---|---|---|---|---|---|
| Battery runtime | 143% | 267% | 123% | 97% | 207% | |
| Reader / Idle (h) | 13.9 | 31.9 129% | 38.8 179% | 28.3 104% | 45.3 226% | |
| WiFi v1.3 (h) | 4.3 | 11.9 177% | 20 365% | 9.6 123% | 11.2 160% | 16.4 281% |
| Load (h) | 3 | 6.7 123% | 10.7 257% | 3.8 27% | 6.4 113% |
Pros
Cons
Verdict
Having narrow bezels on three sides has its benefits and drawbacks. Perhaps its biggest advantage is the smaller size as it definitely makes the Kiicaa Mix one of the lightest and smallest 5.5-inch Android smartphones currently available. On the flip side, the front-facing camera has been awkwardly repositioned, there is no ambient light sensor, the earpiece is far too soft, and typing in landscape mode is uneven.
Beyond the inherent design flaws, everything else about the smartphone is merely average including its raw processor performance. There are very few auxiliary features and both the rear camera and battery life are subpar. The display and fingerprint reader are the only two standout features considering the low price. Users in the US should be aware that the Leagoo will likely lack the necessary 3G and 4G bands for most carriers.
Users will like the cheap price, decent display, fast fingerprint reader, and surprisingly small size. Everything else, however, is reflective of the ~$120 USD MSRP.
Leagoo Kiicaa Mix
- 11/05/2017 v6 (old)
Allen Ngo
Price comparison
