Notebookcheck Logo

Unisoc T7255 (T616) vs Mediatek Helio G100

Unisoc T7255 (T616)

► remove from comparison UNISOC T7255 (T616)

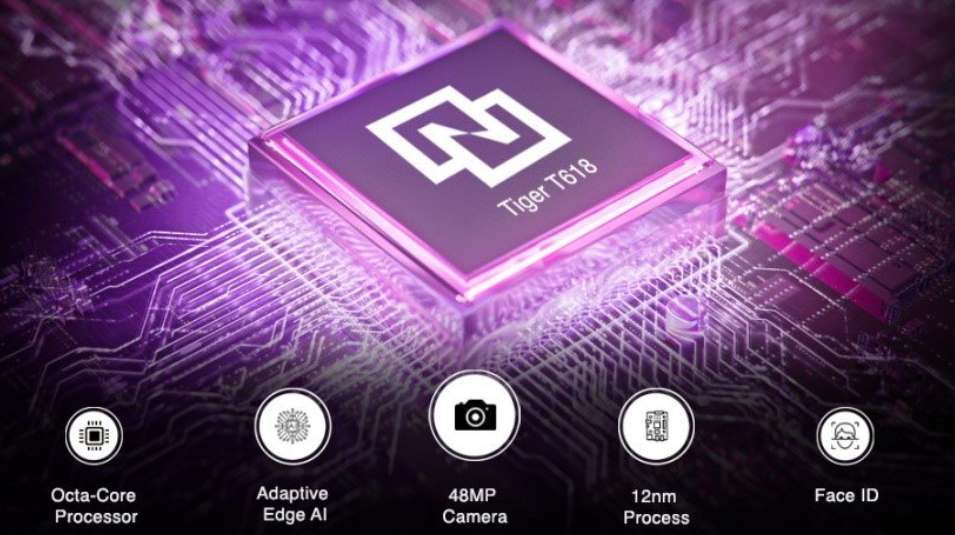
The Unisoc T7255 (formerly Unisoc T616) is an entry level octa core SoC with two fast ARM Cortex A75 cores at up to 2 GHz and six power efficient ARM Cortex A55 cores at up to 1.8 GHz. The SoC further includes an LTE modem (TDD-LTE, FDD-LTE, TDSCDMA, WCDMA, CDMA, GSM), an LPDDR4x-1866 memory controller and an ARM Mali G57 MP1 GPU (750 MHz max) and a dual core ISP (24 and 8 MPixel support). The chip is manufactured by TSMC on a 12nm FinFET process.

Mediatek Helio G100

► remove from comparison Mediatek Helio G99

The MediaTek Helio G100 is an entry level ARM SoC (system-on-a-chip) that can be used in both smartphones and tablets (mainly Android). Technically comparable to the older Mediatek Helio G99 but with support for up to 200 MP main cameras.

The SoC integrates two ARM Cortex-A76 cores with up to 2.2 GHz for demanding tasks and six small ARM Cortex-A55 cores with up to 2 GHz clock speed in a power-saving cluster.

The integrated 4G LTE modem supports Cat-13 (400 Mbps download, 150 Mbps upload). Wi-Fi 5 (a/b/g/n/ac) is also on board. The memory controller supports LPDDR4x RAM with up to 4266 MHz.

A maximum of UFS 2.2 memory can be used for mass storage.

The MediaTek Helio G100 is manufactured using the 6nm process.

ModelUnisoc T7255 (T616)Mediatek Helio G100
CodenameCortex-A75 / A55Cortex-A76 / A55
Clock1800 - 2000 MHz2000 - 2200 MHz
L3 Cache1 MB
Cores / Threads8 / 8
2 x 2.0 GHz ARM Cortex-A75
6 x 1.8 GHz ARM Cortex-A55
8 / 8
2 x 2.2 GHz ARM Cortex-A76
6 x 2.0 GHz ARM Cortex-A55
Technology12 nm6 nm
FeaturesARM Mali G57 MP1, Vivimagic 5.0 Tri-Core-ISP, LTE / 4G Modem, VDSP2x Cortex-A76, 6x Cortex-A55, 4G LTE Cat-12/13, 64MP AI-Camera support, LPDDR3/LPDDR4x-2133, eMMC 5.1, UFS 2.1, Beidou, Galileo, Glonass, GPS, Wi-Fi 5 (a/b/g/n/ac), AI Accelerator up to 1 TMACs, H.264 / H.265 / HEVC video encoding (4k30)
iGPUARM Mali-G57 MP1 (750 MHz)ARM Mali-G57 MP2
ArchitectureARMARM
Announced
SeriesMediatek Mediatek Helio G
Series: Mediatek Helio G Cortex-A76 / A55
Mediatek Helio G100 « 2 - 2.2 GHz8 / 8 cores Cortex-A76 / A55
Mediatek Helio G99 compare2 - 2.2 GHz8 / 8 cores Cortex-A76 / A55
Mediatek Helio G96 compare2 - 2.05 GHz8 / 8 cores Cortex-A76 / A55
Mediatek Helio G95 compare2 - 2.05 GHz8 / 8 cores Cortex-A76 / A55
Mediatek Helio G90T compare2.05 GHz8 / 8 cores Cortex-A76 / A55
Manufacturerwww.mediatek.com

Benchmarks

3DMark - 3DMark Sling Shot Extreme (ES 3.1) Unlimited Physics
min: 2798     avg: 2956     median: 2990 (28%)     max: 3036 Points
3668 Points (34%)
3DMark - 3DMark Sling Shot (ES 3.0) Unlimited Physics
min: 2798     avg: 2954     median: 3002 (34%)     max: 3063 Points
Geekbench 6.4 - Geekbench 6.4 Single-Core
min: 427     avg: 435     median: 439 (11%)     max: 441 Points
725 Points (18%)
Geekbench 6.4 - Geekbench 6.4 Multi-Core
min: 1474     avg: 1553     median: 1548 (6%)     max: 1606 Points
1922 Points (7%)
Geekbench 6.0 - Geekbench 6.0 Single-Core
433 Points (14%)
Geekbench 6.0 - Geekbench 6.0 Multi-Core
1554 Points (6%)
Geekbench 5.5 - Geekbench 5.1 - 5.5 64 Bit Single-Core
min: 298     avg: 350.9     median: 360 (14%)     max: 380 Points
545 Points (21%)
Geekbench 5.5 - Geekbench 5.1 - 5.5 64 Bit Multi-Core
min: 1184     avg: 1410     median: 1464 (3%)     max: 1502 Points
1749 Points (3%)
Geekbench 4.4 - Geekbench 4.1 - 4.4 64 Bit Single-Core
min: 1663     avg: 1734     median: 1734 (17%)     max: 1805 Points
2659 Points (27%)
Geekbench 4.4 - Geekbench 4.1 - 4.4 64 Bit Multi-Core
min: 5131     avg: 5378     median: 5377.5 (5%)     max: 5624 Points
7673 Points (8%)
Geekbench 3 - Geekbench 3 64 Bit Multi-Core
5574 Points (9%)
Geekbench 3 - Geekbench 3 64 Bit Single-Core
1737 Points (26%)
Mozilla Kraken 1.1 - Kraken 1.1 Total Score *
min: 2530.7     avg: 2711     median: 2650.4 (3%)     max: 3013.8 ms
1775 ms (2%)
Octane V2 - Octane V2 Total Score
min: 12141     avg: 14331     median: 14688.5 (11%)     max: 15522 Points
23522 Points (18%)
WebXPRT 4 - WebXPRT 4 Score
min: 45     avg: 55     median: 57.5 (16%)     max: 60 Points
83 Points (23%)
WebXPRT 3 - WebXPRT 3 Score
min: 68     avg: 78     median: 80 (14%)     max: 86 Points
AnTuTu v8 - AnTuTu v8 Total Score
200006 Points (19%)
Antutu v9 - AnTuTu v9 Total Score
min: 228124     avg: 230591     median: 229582 (11%)     max: 235075 Points
Antutu v9 - AnTuTu v9 CPU
min: 67445     avg: 69296     median: 69214 (17%)     max: 71312 Points
Antutu v10 - AnTuTu v10 Total Score
min: 257601     avg: 258478     median: 258478 (9%)     max: 259355 Points
439283 Points (15%)
Antutu v10 - AnTuTu v10 CPU
min: 90783     avg: 93830     median: 93829.5 (3%)     max: 96876 Points
139015 Points (4%)
PassMark PerformanceTest Mobile V1 - PerformanceTest Mobile V1 CPU Tests
min: 3040     avg: 3123     median: 3122.5 (0%)     max: 3205 Points
PCMark for Android - PCM f. Android Storage 2.0 random write internal
min: 52.5     avg: 55.6     median: 54.8 (37%)     max: 59.5 MB/s
PCMark for Android - PCM f. Android Storage 2.0 seq write internal
min: 159.9     avg: 184.6     median: 192.9 (5%)     max: 201 MB/s
PCMark for Android - PCM f. Android Storage 2.0 random read internal
min: 17.7     avg: 20.5     median: 20.4 (10%)     max: 23.5 MB/s
PCMark for Android - PCM f. Android Storage 2.0 seq read internal
min: 199.3     avg: 234.8     median: 228 (6%)     max: 277 MB/s
PCMark for Android - PCM f. Android Storage 2.0 score
min: 11341     avg: 16901     median: 14465.5 (6%)     max: 24988 Points
PCMark for Android - PCM f. Android Work Score 3.0
min: 7936     avg: 8004     median: 8003 (29%)     max: 8066 Points
10723 Points (39%)
CrossMark - CrossMark Overall
min: 382     avg: 388     median: 388 (15%)     max: 394 Points
581 Points (22%)
Power Consumption - Geekbench 5.5 Power Consumption 150cd *
min: 3.47     avg: 5.9     median: 5.8 (3%)     max: 8.44 Watt
2.6 Watt (1%)
Power Consumption - Idle Power Consumption 150cd 1min *
min: 0.91     avg: 1.2     median: 1.3 (1%)     max: 1.398 Watt
1 Watt (1%)

Average Benchmarks Unisoc T7255 (T616) → 100% n=14

Average Benchmarks Mediatek Helio G100 → 145% n=14

- Range of benchmark values for this graphics card
red legend - Average benchmark values for this graphics card
* Smaller numbers mean a higher performance
1 This benchmark is not used for the average calculation

Add one or more devices and compare

In the following list you can select (and also search for) devices that should be added to the comparison. You can select more than one device.

restrict list:
v1.33
log 18. 11:08:13

#0 ran 0s before starting gpusingle class +0s ... 0s

#1 checking url part for id 14016 +0s ... 0s

#2 checking url part for id 19516 +0s ... 0s

#3 redirected to Ajax server, took 1750237693s time from redirect:0 +0s ... 0s

#4 did not recreate cache, as it is less than 5 days old! Created at Mon, 16 Jun 2025 05:19:28 +0200 +0s ... 0s

#5 composed specs +0.003s ... 0.003s

#6 did output specs +0s ... 0.003s

#7 getting avg benchmarks for device 14016 +0.001s ... 0.004s

#8 got single benchmarks 14016 +0.009s ... 0.013s

#9 getting avg benchmarks for device 19516 +0s ... 0.013s

#10 got single benchmarks 19516 +0s ... 0.014s

#11 got avg benchmarks for devices +0s ... 0.014s

#12 min, max, avg, median took s +0.015s ... 0.028s

#13 return log +0s ... 0.029s

Please share our article, every link counts!
Mail Logo
> Expert Reviews and News on Laptops, Smartphones and Tech Innovations > Benchmarks / Tech > Processor Comparison - Head 2 Head
Redaktion, 2017-09- 8 (Update: 2023-07- 1)