Notebookcheck Logo

Qualcomm Snapdragon 8 Gen 2 for Galaxy vs Samsung Exynos 2400

Qualcomm Snapdragon 8 Gen 2 for Galaxy

► remove from comparison Qualcomm SD 8 Gen 2 for Galaxy

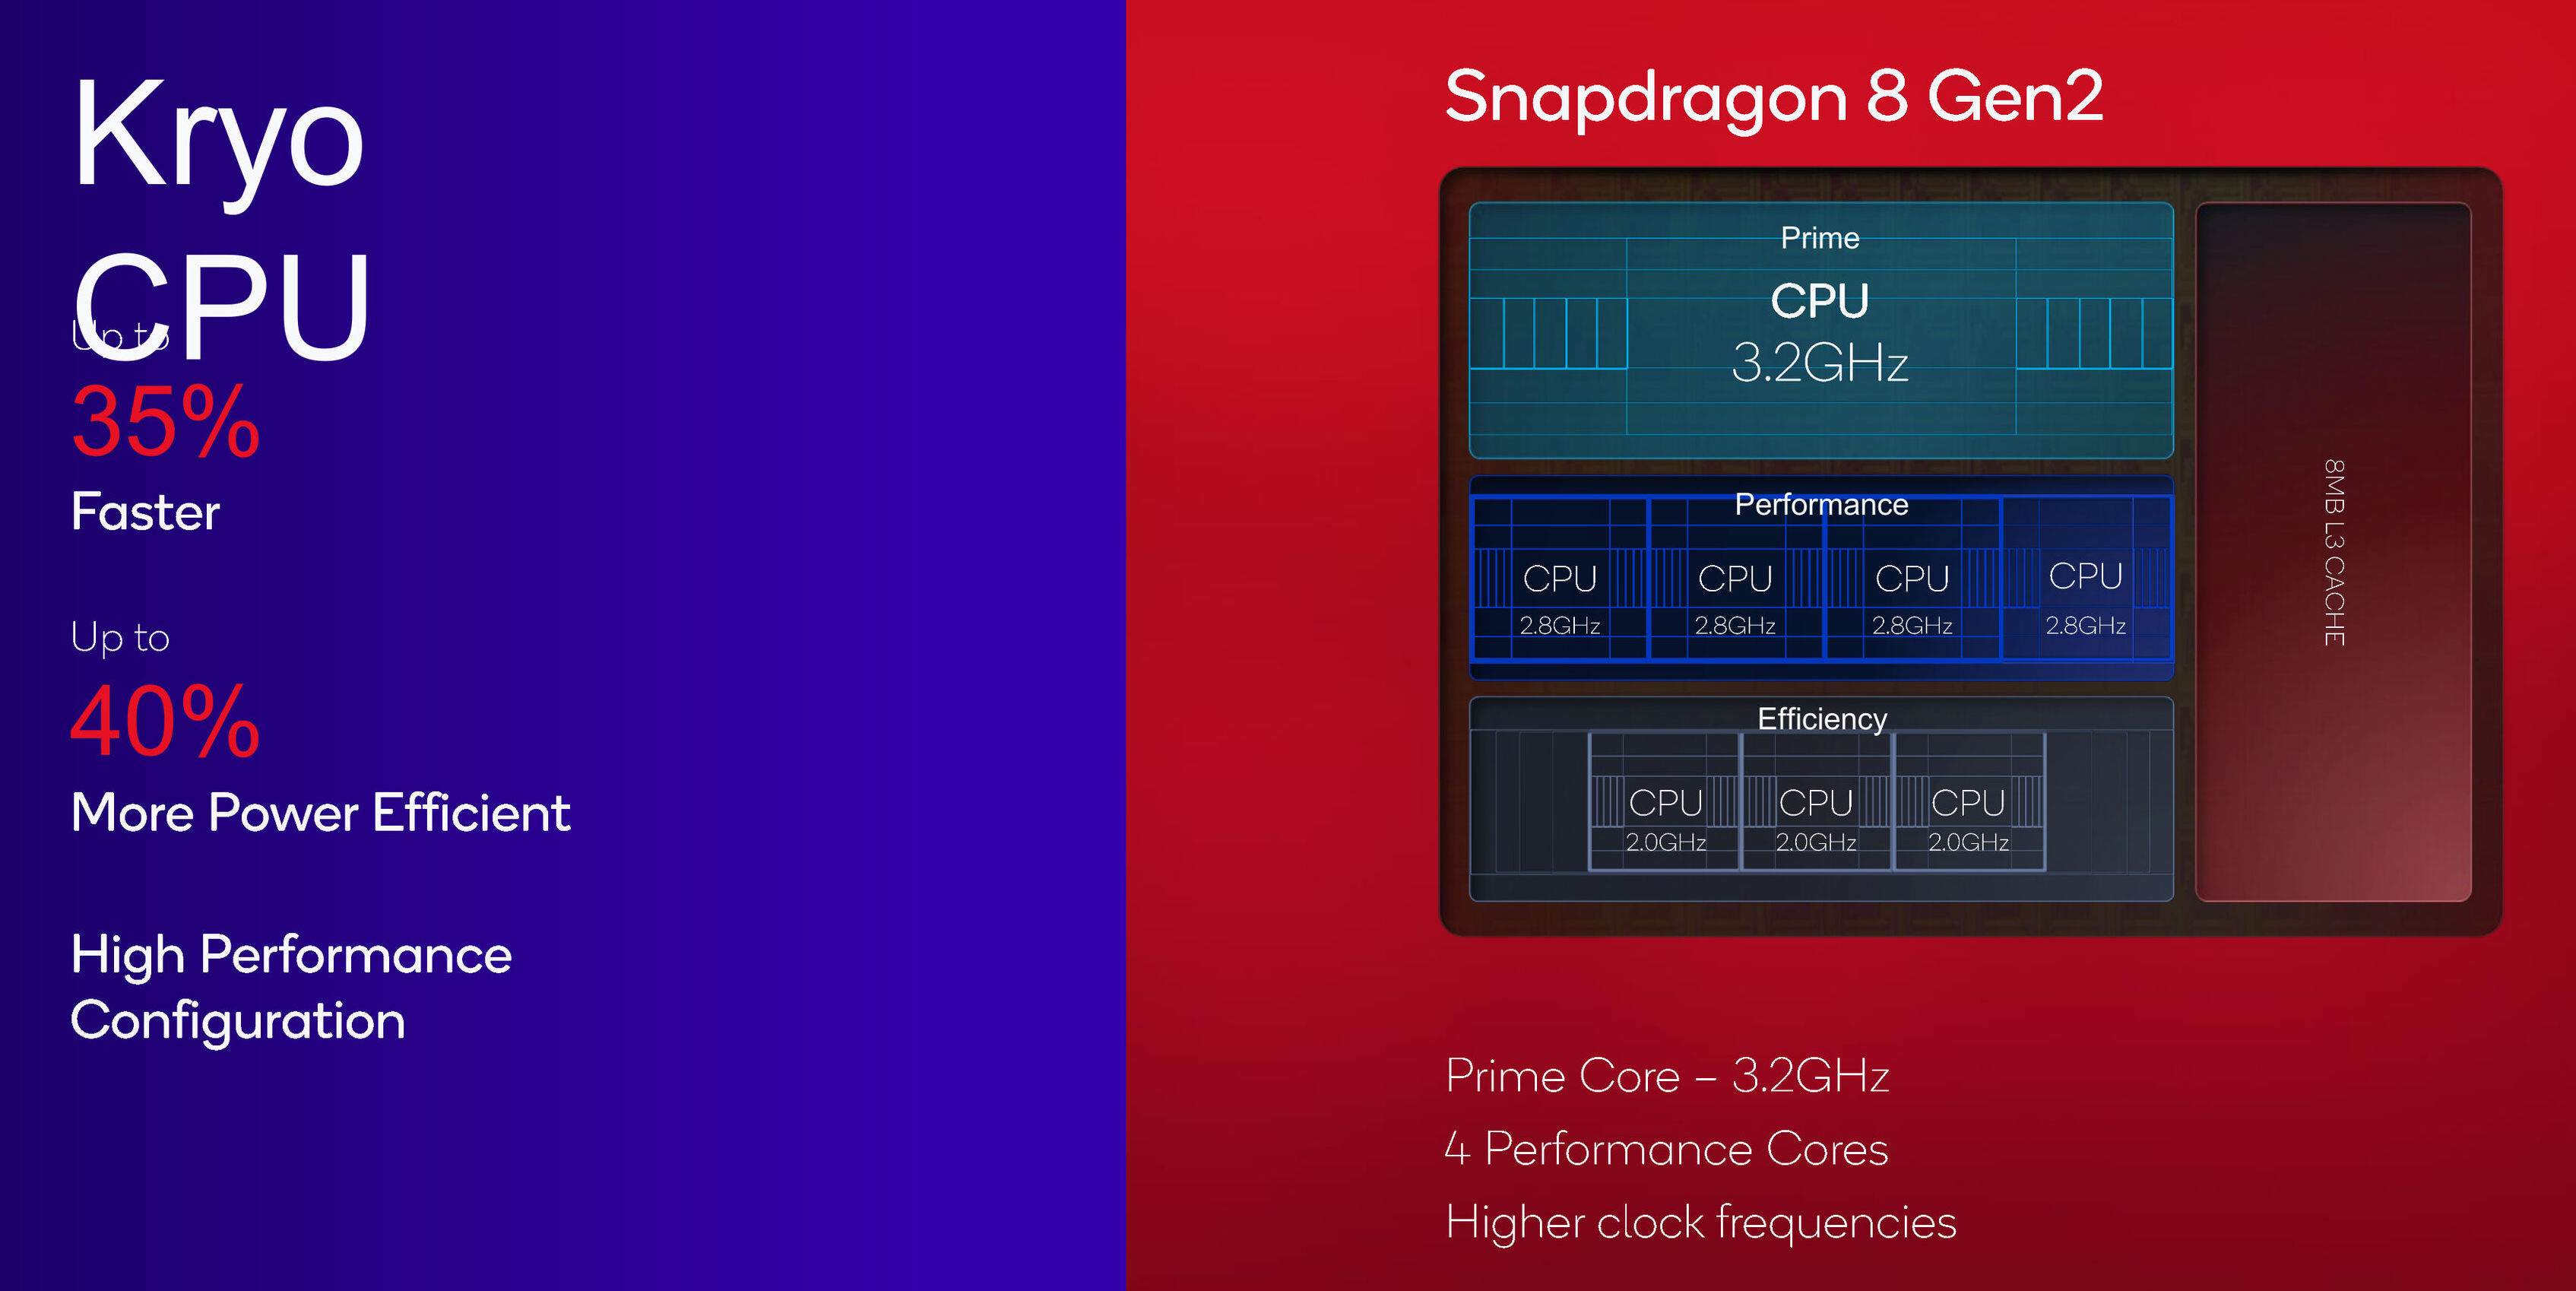
The Qualcomm Snapdragon 8 Gen 2 for Galaxy Mobile Platform is a high-end SoC for smartphones that was introduced in late 2022 and manufactured in 4 nm at TSMC (N4P). It integrates four different CPU clusters. A fast and big prime core based on the ARM Cortex-X3 architecture and clocked at up to 3.36 GHz for 64 bit applications. Two more ARM Cortex-A715 based performance cores clocked at up to 2.8 GHz (also only for 64 bit apps). Two more Cortex-A710 performance cores at up to 2.8 GHz that can also be used for older apps and three efficiency cores (ARM Cortex-A510 with up to 2 GHz). All cores can use the shared 8 MB level 3 cache. Compared to the normal SD 8 Gen 2, the "for Galaxy" version offers a 160 MHz higher clocked prime core.

Thanks to the new architecture and high clock rates, the SD 8 Gen 2 is the fastest mobile CPU for Android based devices and is only topped by current Apple SoCs like the Apple A16 (see benchmarks below).

The chip also integrates a Hexagon accelerator for AI workloads (tensor, scalar and vector). Qualcomm states that its one of the first chips with INT4 support and up to 4.35x performance compared to the previous generation. 

The 18-Bit-Spectra ISP is able to process photos with up to 200 MP and work with videos up to 8k30 (including 10-bit, HDR10+, HLG and Dolby Vision).

A big improvement of the Snapdragon 8 G2 is the integrated Adreno 740 GPU, that now supports Hardware Raytracing and tops even the iGPU in the Apple A16.

The integrated AI Engine can offer up to 4x faster AI performance thanks to the bigger Tensor engine. The 18-Bit-Spectra-ISP also saw some big improvements and is now called Snapdragon Sight.

The integrated Adreno 730 offers a 30% graphics boost compared to the previous Adreno 660.

The integrated Snapdragon X70 5G modem is also new as is the FastConnect 7800 modem with Wi-Fi 7 and Bluetooth 5.3 support.

Samsung Exynos 2400

► remove from comparison Samsung Exynos 2400

The Samsung Exynos 2400 is a top-class SoC for smartphones and tablets. It integrates 10 ARMv9 CPU cores in 4 clusters.

The CPU performance in our benchmarks is comparable to an older Apple A15 and Snapdragon 8 Gen 2 and remains slightly behind the current Snapdragon 8 Gen 3 and also Apple A16 behind.

Samsung's integrated graphics card (iGPU) is an Xclipse 940 GPU which is based on the AMD RDNA 3 architecture.

Wireless connections can be established with the Exynos via 5G NR Sub-6GHz (9.64 GHz uplink), mmWave (12.1 GHz), GPS, GLONASS, BeiDou and Galileo.

The Exynos 2400 is manufactured in the 4nm LPP+ process at Samsung.

ModelQualcomm Snapdragon 8 Gen 2 for GalaxySamsung Exynos 2400
CodenameCortex-X3 / A715 / A710 / A510 (Kryo)Cortex-X4 / A720 / A520
SeriesQualcomm Snapdragon 8
Series: Snapdragon 8 Cortex-X3 / A715 / A710 / A510 (Kryo)
Qualcomm Snapdragon 8 Gen 2 for Galaxy « 2 - 3.36 GHz8 / 8 cores8 MB L3
Qualcomm Snapdragon 8 Gen 2 compare2 - 3.2 GHz8 / 8 cores8 MB L3
Clock2000 - 3360 MHz2000 - 3200 MHz
L3 Cache8 MB
Cores / Threads8 / 8
1 x 3.4 GHz ARM Cortex-X3
2 x 2.8 GHz ARM Cortex-A715
2 x 2.8 GHz ARM Cortex-A710
3 x 2.0 GHz ARM Cortex-A510
10 / 10
1 x 3.2 GHz ARM Cortex-X4
2 x 2.9 GHz ARM Cortex-A720
3 x 2.6 GHz ARM Cortex-A720
4 x 2.0 GHz ARM Cortex-A520
Technology4 nm4 nm
FeaturesAdreno GPU, Spectra ISP, Hexagon, X70 5G Modem, FastConnect 7800 Wi-Fi 7, LPDDR5x 4200 MHz Memory Controller
iGPUQualcomm Adreno 740Samsung Xclipse 940
ArchitectureARM v9ARM
Announced
Manufacturerwww.qualcomm.comsemiconductor.samsung.com

Benchmarks

min: 7199     avg: 7215     median: 7215 (68%)     max: 7231 Points
min: 5232     avg: 6234     median: 6233.5 (71%)     max: 7235 Points
min: 2045     avg: 2056     median: 2055.5 (51%)     max: 2066 Points
min: 6456     avg: 6495     median: 6495 (25%)     max: 6534 Points
Geekbench 6.0 - Geekbench 6.0 Single-Core
min: 1958     avg: 1968     median: 1971 (63%)     max: 1976 Points
Geekbench 6.0 - Geekbench 6.0 Multi-Core
min: 5043     avg: 5130     median: 5126 (21%)     max: 5221 Points
min: 1553     avg: 1560     median: 1560 (61%)     max: 1567 Points
min: 5561     avg: 5716     median: 5716 (10%)     max: 5871 Points
Geekbench 4.4 - Geekbench 4.1 - 4.4 64 Bit Single-Core
min: 8370     avg: 8391     median: 8380 (84%)     max: 8424 Points
min: 8889     avg: 8949     median: 8949 (89%)     max: 9009 Points
Geekbench 4.4 - Geekbench 4.1 - 4.4 64 Bit Multi-Core
min: 21038     avg: 21162     median: 21209 (21%)     max: 21238 Points
min: 25448     avg: 25723     median: 25723 (26%)     max: 25998 Points
Geekbench 4.0 - Geekbench 4.0 64 Bit Single-Core
min: 6882     avg: 6950     median: 6949.5 (77%)     max: 7017 Points
Geekbench 4.0 - Geekbench 4.0 64 Bit Multi-Core
min: 19260     avg: 19271     median: 19270.5 (28%)     max: 19281 Points
Geekbench 3 - Geekbench 3 64 Bit Multi-Core
19117 Points (30%)
Geekbench 3 - Geekbench 3 64 Bit Single-Core
6624 Points (99%)
Mozilla Kraken 1.1 - Kraken 1.1 Total Score *
min: 634.3     avg: 795     median: 696.2 (1%)     max: 1532.5 ms
min: 630.8     avg: 647     median: 646.6 (1%)     max: 662.3 ms
Octane V2 - Octane V2 Total Score
min: 49582     avg: 59058     median: 60115 (45%)     max: 64715 Points
min: 63452     avg: 63600     median: 63600 (48%)     max: 63748 Points
176 Points (48%)
WebXPRT 3 - WebXPRT 3 Score
min: 183     avg: 219     median: 231 (41%)     max: 243 Points
Antutu v10 - AnTuTu v10 Total Score
1508320 Points (50%)
min: 1616400     avg: 1697140     median: 1697140 (56%)     max: 1777870 Points
Antutu v10 - AnTuTu v10 CPU
363615 Points (11%)
min: 409658     avg: 418562     median: 418562 (12%)     max: 427465 Points
PCMark for Android - PCM f. Android Storage 2.0 random write internal
85.7 MB/s (58%)
min: 64.4     avg: 65.6     median: 65.6 (45%)     max: 66.7 MB/s
PCMark for Android - PCM f. Android Storage 2.0 seq write internal
2081 MB/s (59%)
min: 1108     avg: 1155     median: 1154.5 (33%)     max: 1201 MB/s
PCMark for Android - PCM f. Android Storage 2.0 random read internal
50.9 MB/s (25%)
min: 50     avg: 50.5     median: 50.5 (24%)     max: 50.9 MB/s
PCMark for Android - PCM f. Android Storage 2.0 seq read internal
2371 MB/s (66%)
min: 2327     avg: 2336     median: 2336 (65%)     max: 2345 MB/s
PCMark for Android - PCM f. Android Storage 2.0 score
min: 35786     avg: 42805     median: 41063 (18%)     max: 48832 Points
min: 21538     avg: 23407     median: 23407 (10%)     max: 25276 Points
min: 17534     avg: 17649     median: 17648.5 (65%)     max: 17763 Points
min: 1256     avg: 1273     median: 1273 (48%)     max: 1290 Points
min: 9.31     avg: 9.5     median: 9.5 (4%)     max: 9.59 Watt
min: 0.586     avg: 0.6     median: 0.6 (1%)     max: 0.595 Watt

Average Benchmarks Qualcomm Snapdragon 8 Gen 2 for Galaxy → 100% n=21

Average Benchmarks Samsung Exynos 2400 → 97% n=21

- Range of benchmark values for this graphics card
red legend - Average benchmark values for this graphics card
* Smaller numbers mean a higher performance
1 This benchmark is not used for the average calculation

Add one or more devices and compare

In the following list you can select (and also search for) devices that should be added to the comparison. You can select more than one device.

restrict list:
v1.33
log 19. 15:07:07

#0 ran 0s before starting gpusingle class +0s ... 0s

#1 checking url part for id 14990 +0s ... 0s

#2 checking url part for id 17426 +0s ... 0s

#3 redirected to Ajax server, took 1752930427s time from redirect:0 +0s ... 0s

#4 did not recreate cache, as it is less than 5 days old! Created at Sat, 19 Jul 2025 13:28:35 +0200 +0s ... 0s

#5 composed specs +0.006s ... 0.006s

#6 did output specs +0s ... 0.006s

#7 getting avg benchmarks for device 14990 +0.001s ... 0.007s

#8 got single benchmarks 14990 +0.006s ... 0.013s

#9 getting avg benchmarks for device 17426 +0.001s ... 0.013s

#10 got single benchmarks 17426 +0.004s ... 0.018s

#11 got avg benchmarks for devices +0s ... 0.018s

#12 No cached benchmark found, getting uncached values +0.01s ... 0.028s

#13 min, max, avg, median took s +0.007s ... 0.036s

#14 return log +0.001s ... 0.036s

Please share our article, every link counts!
Mail Logo
> Expert Reviews and News on Laptops, Smartphones and Tech Innovations > Benchmarks / Tech > Processor Comparison - Head 2 Head
Redaktion, 2017-09- 8 (Update: 2023-07- 1)