

Texas Instruments OMAP 4430 vs Apple A5
Texas Instruments OMAP 4430
► remove from comparison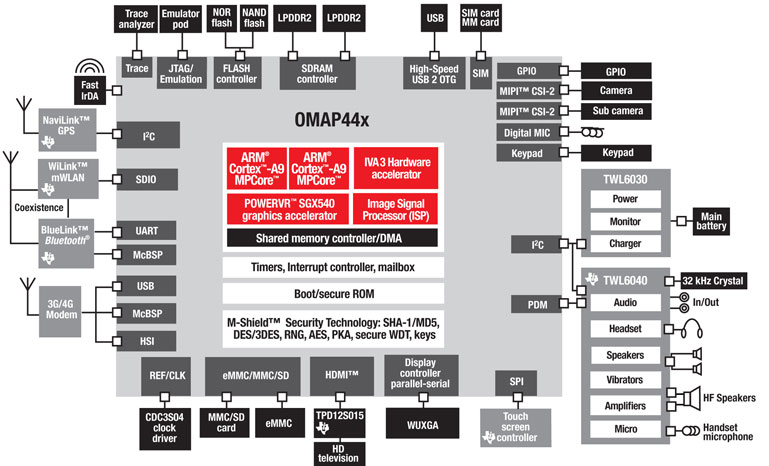
The Texas Instruments (TI) OMAP 4430 is a SoC with two ARM Cortex-A9 cores including NEON SIMD engine, two Cortex M3 cores (to save power), a PowerVR SGX540 graphics card (304-365 MHz) and a dual channel LPDDR2 memory controller (max 400 MHz).
Apple A5
► remove from comparisonThe Apple A5 is a dual-core processor that contains two Cortex A9 cores. Each core is max. clocked at 900 MHz. Furthermore, the A5 integrates a relative fast PowerVR SGX 543MP2 graphics card and 512MB ram (in the same package for the iPad 2). Apple states a maximum of 2x the performance compared to the previous single core Apple A4.
| Model | Texas Instruments OMAP 4430 | Apple A5 |
| Codename | Cortex A9 | Cortex A9 |
| Clock | 1000 MHz | 1000 MHz |
| L1 Cache | 1 MB | |
| Cores / Threads | 2 / 2 | 2 |
| TDP | 0.6 Watt | |
| Technology | 45 nm | 40, 32 nm |
| Features | Dual Channel LPDDR 400MHz Memory Controller, IVA 3 Multimedia Accelerator, PowerVR SGX 540 Graphics Core, Image Signal Processor | |
| Architecture | ARM | ARM |
| Announced | ||
| Manufacturer | www.ti.com |
Benchmarks
169%
A5 +min: 297 avg: 317.7 median: 323 (2%) max: 333 Points
90%
A5 +min: 751 avg: 807 median: 833 (6%) max: 838 Points
495%
A5 +min: 737 avg: 855 median: 906 (2%) max: 923 Points
149%
A5 +min: 552 avg: 638 median: 671 (1%) max: 691 Points
177%
A5 +min: 631 avg: 715 median: 750 (2%) max: 764 Points
Linpack Android / IOS - Linpack Multi Thread
100%
OMAP 4430 +min: 38.78 avg: 59.5 median: 63.7 (2%) max: 71.9 MFLOPS
200%
A5 +min: 124.4 avg: 127.1 median: 127.1 (4%) max: 129.8 MFLOPS
Linpack Android / IOS - Linpack Single Thread
100%
OMAP 4430 +min: 36.48 avg: 40.8 median: 40.6 (4%) max: 45.39 MFLOPS
202%
A5 +min: 78.1 avg: 81.8 median: 81.8 (8%) max: 85.4 MFLOPS
Sunspider - Sunspider 0.9.1 Total Score *
100%
OMAP 4430 +min: 1761 avg: 1955 median: 1895.5 (18%) max: 2269 ms
100%
A5 +min: 1557 avg: 1863 median: 1888.5 (18%) max: 2118 ms
Quadrant Standard Edition 2.0 - Quadrant Standard 2.0 Total Score
100%
1 OMAP 4430 +min: 2475 avg: 2571 median: 2571 (6%) max: 2666 points
Average Benchmarks Texas Instruments OMAP 4430 → 100% n=8
Average Benchmarks Apple A5 → 198% n=8
- Range of benchmark values for this graphics card
 - Average benchmark values for this graphics card
* Smaller numbers mean a higher performance
1 This benchmark is not used for the average calculation
* Smaller numbers mean a higher performance
1 This benchmark is not used for the average calculation
v1.35