Intel Atom N435 vs HiSilicon Hi6262 vs unknown
Intel Atom N435 ► remove from comparison
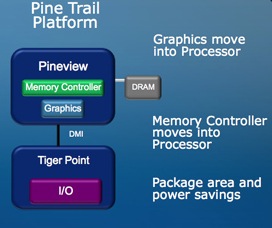
The Intel Atom N435 is a small and cheap entry level CPU for Netbooks and small laptops. In the package is an integrated memory controller for DDR2/DDR3 main memory and the GMA 3150 graphics card .
The performance of the whole system (Atom N435 and integrated GMA 3150) is only sufficient for basic tasks like surfing the web, or office working. HD video, video cutting, advanced photo editing, multitasking and of course gaming may overstrain the GPU and CPU. Compared to the previous Atom generation, the performance of the CPU is on a level with the slow Atom Z520 .
An advantage of the interation, is the small overall power consumption of the CPU, GPU and memory controller (only 5 Watt TDP). Therefore, the chip is ideally used in small Netbooks and thin laptops.
Model Intel Atom N435 HiSilicon Hi6262 unknown Series Intel Atom HiSilicon Codename Pinetrail Series: Clock 1333 MHz FSB 533 L2 Cache 512 KB Cores / Threads 1 / 2 TDP 5 Watt Technology 45 nm Socket FCBGA559 Features integrated DDR2/DDR3 memory controller, integrated GMA 3150 GPU, Hyperthreading Architecture x86 x86 Announced
Benchmarks Cinebench R15 - Cinebench R15 CPU Multi 64 Bit
min: 1029 avg: 1038 median: 1038 (7%) max: 1047 Points
Model CPU GPU RAM Value Apple MacBook Pro 15 2019 i7 555X unknown unknown Win10 1029 Apple MacBook Pro 15 2019 i7 555X unknown unknown macOS 1047
3DMark - 3DMark Ice Storm Unlimited Physics
37732 Points (32%)
Model CPU GPU RAM Value Apple MacBook Pro 15 2019 i7 555X unknown unknown 37732
3DMark - 3DMark Cloud Gate Physics
8923 Points (23%)
Model CPU GPU RAM Value Apple MacBook Pro 15 2019 i7 555X unknown unknown 8923
3DMark - 3DMark Time Spy CPU
5039 Points (21%)
Model CPU GPU RAM Value Apple MacBook Pro 15 2019 i7 555X unknown unknown 5039
3DMark - 3DMark Sling Shot Extreme (ES 3.1) Unlimited Physics
min: 3612 avg: 4808 median: 4807.5 (57%) max: 6003 Points
Model CPU GPU RAM Value Vivo V40 SE 5G unknown unknown 8 GB 3612 Huawei Pura 70 Ultra unknown unknown 16 GB 6003
Geekbench 6.2 - Geekbench 6.2 Single-Core
min: 920 avg: 1183 median: 1183 (32%) max: 1446 Points
Model CPU GPU RAM Value Vivo V40 SE 5G unknown unknown 8 GB 920 Huawei Pura 70 Ultra unknown unknown 16 GB 1446
Geekbench 6.2 - Geekbench 6.2 Multi-Core
min: 2252 avg: 3368 median: 3368 (13%) max: 4484 Points
Model CPU GPU RAM Value Vivo V40 SE 5G unknown unknown 8 GB 2252 Huawei Pura 70 Ultra unknown unknown 16 GB 4484
Geekbench 5.5 - Geekbench 5.1 - 5.4 64 Bit Single-Core
min: 687 avg: 887 median: 887 (37%) max: 1087 Points
Model CPU GPU RAM Value Vivo V40 SE 5G unknown unknown 8 GB 687 Huawei Pura 70 Ultra unknown unknown 16 GB 1087
Geekbench 5.5 - Geekbench 5.1 - 5.4 64 Bit Multi-Core
min: 2071 avg: 3146 median: 3146 (6%) max: 4221 Points
Model CPU GPU RAM Value Vivo V40 SE 5G unknown unknown 8 GB 2071 Huawei Pura 70 Ultra unknown unknown 16 GB 4221
Geekbench 4.4 - Geekbench 4.1 - 4.4 64 Bit Single-Core
min: 3175 avg: 4274 median: 4788 (48%) max: 4860 Points
Model CPU GPU RAM Value Vivo V40 SE 5G unknown unknown 8 GB 3175 Huawei Pura 70 Ultra unknown unknown 16 GB 4788 Huawei Pura 70 Ultra unknown unknown Performance Mode 16 GB 4860
Geekbench 4.4 - Geekbench 4.1 - 4.4 64 Bit Multi-Core
min: 8143 avg: 12683 median: 14710 (16%) max: 15196 Points
Model CPU GPU RAM Value Vivo V40 SE 5G unknown unknown 8 GB 8143 Huawei Pura 70 Ultra unknown unknown 16 GB 14710 Huawei Pura 70 Ultra unknown unknown Performance Mode 16 GB 15196
Linpack Android / IOS - Linpack Multi Thread
13 MFLOPS (0%)
Model CPU GPU RAM Value Archos Arnova 10 unknown unknown 12.95
Linpack Android / IOS - Linpack Single Thread
12.8 MFLOPS (1%)
Model CPU GPU RAM Value Archos Arnova 10 unknown unknown 12.8
Mozilla Kraken 1.1 - Kraken 1.1 Total Score *
min: 779.1 avg: 5662 median: 1253.9 (1%) max: 14953 ms
Model CPU GPU RAM Value Huawei Pura 70 Ultra unknown unknown Chrome 125 16 GB 779.1 Vivo V40 SE 5G unknown unknown Chrome 125 8 GB 1253.9 PocketBook Era Color unknown unknown 1 GB 14953
Sunspider - Sunspider 0.9.1 Total Score *
7004 ms (66%)
Model CPU GPU RAM Value Archos Arnova 10 unknown unknown 7004
Octane V2 - Octane V2 Total Score
min: 2672 avg: 21642 median: 17303 (16%) max: 49290 Points
Model CPU GPU RAM Value PocketBook InkPad Color 3 unknown unknown PocketBook Browser 1 GB 2672 PocketBook Era Color unknown unknown 1 GB 2753 Vivo V40 SE 5G unknown unknown Chrome 125 8 GB 31853 Huawei Pura 70 Ultra unknown unknown Chrome 125 16 GB 49290
WebXPRT 4 - WebXPRT 4 Score
0 Points (0%)
Model CPU GPU RAM Value Vivo V40 SE 5G unknown unknown 8 GB Huawei Pura 70 Ultra unknown unknown 16 GB
WebXPRT 3 - WebXPRT 3 Score
0 Points (0%)
Model CPU GPU RAM Value Vivo V40 SE 5G unknown unknown 8 GB Huawei Pura 70 Ultra unknown unknown 16 GB
PCMark for Android - PCM f. Android Storage 2.0 random write internal
37 MB/s (27%)
Model CPU GPU RAM Value Vivo V40 SE 5G unknown unknown 3.0.4061 8 GB 37
PCMark for Android - PCM f. Android Storage 2.0 seq write internal
587 MB/s (18%)
Model CPU GPU RAM Value Vivo V40 SE 5G unknown unknown 3.0.4061 8 GB 587
PCMark for Android - PCM f. Android Storage 2.0 random read internal
18.7 MB/s (23%)
Model CPU GPU RAM Value Vivo V40 SE 5G unknown unknown 3.0.4061 8 GB 18.7
PCMark for Android - PCM f. Android Storage 2.0 seq read internal
712 MB/s (20%)
Model CPU GPU RAM Value Vivo V40 SE 5G unknown unknown 3.0.4061 8 GB 712
PCMark for Android - PCM f. Android Storage 2.0 score
21410 Points (34%)
Model CPU GPU RAM Value Vivo V40 SE 5G unknown unknown 3.0.4061 8 GB 21410
PCMark for Android - PCM f. Android Work Score 3.0
13575 Points (63%)
Model CPU GPU RAM Value Huawei Pura 70 Ultra unknown unknown 16 GB 13575
CrossMark - CrossMark Overall
min: 598 avg: 815 median: 814.5 (31%) max: 1031 Points
Model CPU GPU RAM Value Vivo V40 SE 5G unknown unknown 8 GB 598 Huawei Pura 70 Ultra unknown unknown 16 GB 1031
Average Benchmarks unknown → 0% n=
- Range of benchmark values for this graphics card
- Average benchmark values for this graphics card
* Smaller numbers mean a higher performance
1 This benchmark is not used for the average calculation
v1.27
log 08. 11:28:21
#0 checking url part for id 2692 +0s ... 0s
#1 checking url part for id 13241 +0s ... 0s
#2 checking url part for id 1859 +0s ... 0s
#3 not redirecting to Ajax server +0s ... 0s
#4 did not recreate cache, as it is less than 5 days old! Created at Fri, 07 Jun 2024 05:41:01 +0200 +0.001s ... 0.001s
#5 composed specs +0.085s ... 0.086s
#6 did output specs +0s ... 0.086s
#7 getting avg benchmarks for device 2692 +0.004s ... 0.09s
#8 got single benchmarks 2692 +0.008s ... 0.098s
#9 getting avg benchmarks for device 13241 +0.003s ... 0.101s
#10 got single benchmarks 13241 +0.006s ... 0.107s
#11 getting avg benchmarks for device 1859 +0.003s ... 0.11s
#12 got single benchmarks 1859 +0.481s ... 0.592s
#13 got avg benchmarks for devices +0s ... 0.592s
#14 No cached benchmark found, getting uncached values +0.064s ... 0.656s
#15 No cached benchmark found, getting uncached values +0.003s ... 0.659s
#16 min, max, avg, median took s +0.016s ... 0.676s
#17 return log +0s ... 0.676s
Please share our article, every link counts!
Redaktion, 2017-09- 8 (Update: 2023-07- 1)
 Deutsch
 English
 Español
 Français
 Italiano
 Nederlands
 Polski
 Português
 Русский
 Türkçe
 Svenska
 Chinese
 Magyar