Notebookcheck Logo

ARM Mali-T880 MP2 vs ARM Mali-T830 MP1

ARM Mali-T880 MP2

► remove from comparison ARM Mali-T880 MP2

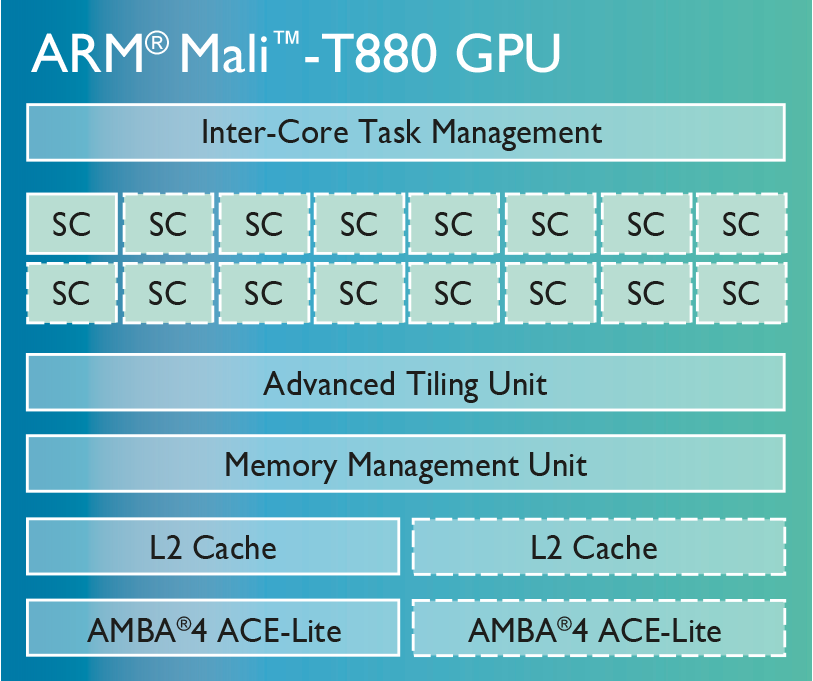
The ARM Mali-T880 MP2 is a mobile graphics solution that can be found in ARM SoCs like the Mediatek Helio P20 SoC for Android based smartphones and tablets. The chip is available since Q1/2016 and supports OpenGL ES 3.1, OpenCL 1.2 and DirectX 11.2 (FL 11_2). The Mali-T880 can be built with 1 to 16 clusters, where the MP2 version features 2 clusters/cores.

ARM Mali-T830 MP1

► remove from comparison ARM Mali-T830 MP1

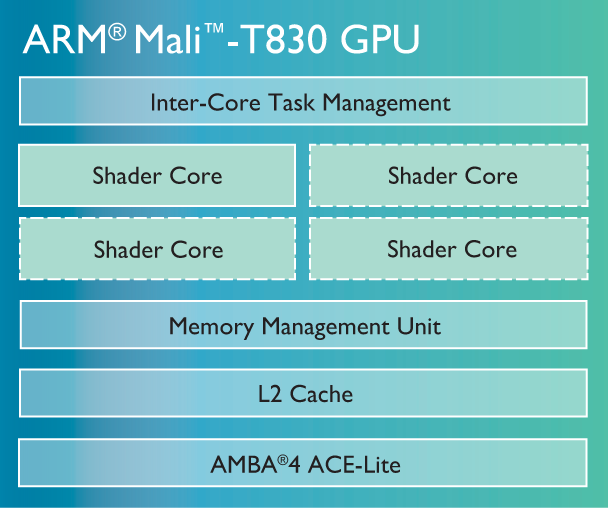
The ARM Mali-T830 MP1 is an integrated graphics card for smartphones and tablets. The chip features only one cluster (MP1) and supports OpenGL ES 3.2, OpenCL 1.2 and DirectX 11 (FL 9_3). 

ARM Mali-T880 MP2ARM Mali-T830 MP1
Mali-T800 Series
Mali-T880 MP12 compare 12 @ 0.65 GHz
Mali-T880 MP4 compare 4 @ 0.9 GHz
Mali-T880 MP2 2 @ 0.9 GHz
Mali-T860 MP2 compare 2 @ 0.7 GHz
Mali-T830 MP3 compare 2 @ 0.6 GHz
Mali-T830 MP2 compare 2 @ 0.6 GHz
Mali-T830 MP1 1
Mali-T880 MP12 compare 12 @ 0.65 GHz
Mali-T880 MP4 compare 4 @ 0.9 GHz
Mali-T880 MP2 2 @ 0.9 GHz
Mali-T860 MP2 compare 2 @ 0.7 GHz
Mali-T830 MP3 compare 2 @ 0.6 GHz
Mali-T830 MP2 compare 2 @ 0.6 GHz
Mali-T830 MP1 1
CodenameMidgard (4th Generation)
ArchitectureMidgard (4rd-gen)
Pipelines2 - unified1 - unified
Core Speed900 (Boost) MHz
Shared Memorynono
APIDirectX 11.2 (FL 11_2), OpenGL ES 3.1DirectX 11 (FL 9_3), OpenGL ES 3.2
technology16 nm16 nm
FeaturesOpenGL ES 3.1, OpenCL 1.2, DirectX 11.2 (FL 11_2)OpenGL ES 3.2, OpenCL 1.2, DirectX 11 (FL 9_3)
Date of Announcement26.11.2015 01.04.2016
Link to Manufacturer Pagewww.arm.comwww.arm.com
CPU in Mali-T880 MP2GPU Base SpeedGPU Boost / Turbo
Mediatek Helio P258 x 2600 MHz1000 MHz? MHz
Mediatek Helio P20 (LP4) MT67578 x 2300 MHz900 MHz? MHz
min. - max.900 - 1000 MHz? MHz

Benchmarks

3DMark - 3DMark Ice Storm Unlimited Graphics
min: 10023     avg: 13267     median: 13844 (2%)     max: 14288 Points
min: 7007     avg: 7316     median: 7456 (1%)     max: 7484 Points
3DMark - 3DMark Ice Storm Extreme Graphics
min: 6839     avg: 8665     median: 9269 (1%)     max: 9283 Points
3DMark - 3DMark Ice Storm Graphics
min: 10498     avg: 11431     median: 11898 (1%)     max: 11898 Points
3DMark - 3DMark Sling Shot Extreme (ES 3.1) Unlimited Graphics
min: 556     avg: 620     median: 633 (2%)     max: 647 Points
GFXBench - GFXBench 5.0 Aztec Ruins High Tier Offscreen
1.5 fps (0%)
GFXBench - GFXBench 5.0 Aztec Ruins Normal Tier Offscreen
4.2 fps (0%)
min: 1.8     avg: 8     median: 8 (1%)     max: 14.2 fps
min: 1.9     avg: 1.9     median: 1.9 (0%)     max: 2 fps
min: 3.2     avg: 3.2     median: 3.2 (0%)     max: 3.3 fps
min: 5.1     avg: 5.2     median: 5.1 (0%)     max: 5.4 fps
GFXBench (DX / GLBenchmark) 2.7
GFXBench T-Rex HD Offscreen C24Z16 + ARM Mali-T880 MP2
GFXBench (DX / GLBenchmark) 2.7 - GFXBench T-Rex HD Offscreen C24Z16
min: 21     avg: 23.1     median: 24 (0%)     max: 24 fps
GFXBench T-Rex HD Offscreen C24Z16 + ARM Mali-T830 MP1
Basemark X 1.1 - Basemark X 1.1 High Quality
min: 9655     avg: 9936     median: 9935.5 (23%)     max: 10216 Points
Basemark X 1.1 - Basemark X 1.1 Medium Quality
min: 18345     avg: 19359     median: 19359 (43%)     max: 20373 Points
Basemark GPU 1.2 - Basemark GPU 1.2 Vulkan Official Medium Offscreen 1080
2.7 fps (0%)
PassMark PerformanceTest Mobile V1 - PerformanceTest Mobile V1 2D Graphics Tests
min: 3868     avg: 3970     median: 3970 (4%)     max: 4072 Points
PassMark PerformanceTest Mobile V1 - PerformanceTest Mobile V1 3D Graphics Tests
min: 1046     avg: 1086     median: 1085.5 (2%)     max: 1125 Points

Average Benchmarks ARM Mali-T880 MP2 → 100% n=11

Average Benchmarks ARM Mali-T830 MP1 → 59% n=11

- Range of benchmark values for this graphics card
- Average benchmark values for this graphics card
* Smaller numbers mean a higher performance
1 This benchmark is not used for the average calculation

Game Benchmarks

The following benchmarks stem from our benchmarks of review laptops. The performance depends on the used graphics memory, clock rate, processor, system settings, drivers, and operating systems. So the results don't have to be representative for all laptops with this GPU. For detailed information on the benchmark results, click on the fps number.

PUBG Mobile

PUBG Mobile

2018
med.
Mali-T830 MP1:
10  fps
Dead Trigger 2

Dead Trigger 2

2013
high
100%
Mali-T880 MP2:
30 52 57 ~ 46 fps
87%
Mali-T830 MP1:
30 30 60 ~ 40 fps
Asphalt 8: Airborne

Asphalt 8: Airborne

2013
low
100%
Mali-T880 MP2:
30 30 ~ 30 fps
100%
Mali-T830 MP1:
30 30 ~ 30 fps
high
100%
Mali-T880 MP2:
29 30 ~ 30 fps
67%
Mali-T830 MP1:
18 22 ~ 20 fps
Temple Run 2

Temple Run 2

2013
high
100%
Mali-T880 MP2:
52  fps
113%
Mali-T830 MP1:
59  fps

Average Gaming ARM Mali-T880 MP2 → 100%

Average Gaming 30-70 fps → 100%

Average Gaming ARM Mali-T830 MP1 → 92%

Average Gaming 30-70 fps → 100%

ARM Mali-T830 MP1lowmed.highultraQHD4K
PUBG Mobile10
Dead Trigger 240
Asphalt 8: Airborne3020
Temple Run 259
< 30 fps
< 60 fps
< 120 fps
≥ 120 fps

1

1


1
2


ARM Mali-T880 MP2lowmed.highultraQHD4K
Dead Trigger 246
Asphalt 8: Airborne3030
Temple Run 252
< 30 fps
< 60 fps
< 120 fps
≥ 120 fps

1


3


For more games that might be playable and a list of all games and graphics cards visit our Gaming List

Add one or more devices and compare

In the following list you can select (and also search for) devices that should be added to the comparison. You can select more than one device.

restrict list:

show all (including archived), 2024, 2023
v1.26
log 19. 15:29:22

#0 checking url part for id 7720 +0s ... 0s

#1 checking url part for id 7718 +0s ... 0s

#2 not redirecting to Ajax server +0s ... 0s

#3 did not recreate cache, as it is less than 5 days old! Created at Fri, 19 Apr 2024 05:40:26 +0200 +0.001s ... 0.001s

#4 composed specs +0.074s ... 0.075s

#5 did output specs +0s ... 0.075s

#6 start showIntegratedCPUs +0s ... 0.075s

#7 getting avg benchmarks for device 7720 +0.024s ... 0.1s

#8 got single benchmarks 7720 +0.036s ... 0.136s

#9 getting avg benchmarks for device 7718 +0.002s ... 0.137s

#10 got single benchmarks 7718 +0.01s ... 0.147s

#11 got avg benchmarks for devices +0s ... 0.147s

#12 min, max, avg, median took s +0.083s ... 0.231s

#13 before gaming benchmark output +0s ... 0.231s

#14 Got 17 rows for game benchmarks. +0.008s ... 0.239s

#15 composed SQL query for gamebenchmarks +0s ... 0.239s

#16 got data and put it in $dataArray +0.002s ... 0.241s

#17 benchmarks composed for output. +0.01s ... 0.251s

#18 calculated avg scores. +0s ... 0.251s

#19 return log +0.049s ... 0.301s

Please share our article, every link counts!
> Expert Reviews and News on Laptops, Smartphones and Tech Innovations > Benchmarks / Tech > Graphics Card Comparison - Head 2 Head
Redaktion, 2017-09- 8 (Update: 2023-07- 1)