Notebookcheck Logo

HiSilicon Kirin 955 vs Qualcomm Snapdragon 675

HiSilicon Kirin 955

► remove from comparison  Kirin 955

The HiSilicon Kirin 955 is a ARM-based high-end Octa-Core-SoC for Android based smartphones and tablets. It was announced in the beginning of 2016 together with the Huawei P9. It contains 8 processor cores (4x Cortex-A72, 4x Cortex-A53), a ARM Mali T880 MP4 GPU (see for information and benchmarks), a dual-channel LPDDR4 memory controller and a LTE Cat. 5 radio. In the beginning of 2016 it is one of the fastest ARM bases SoCs on the market. Compared to the slightly older Kirin 950, the 955 is a higher clocked version (A72 cores clock at 2.5 versus 2.3 GHz).

The Kirin 955 is one of the first SoCs that use the new Cortex-A72 architecture. Compared to the A57 cores, the A72 ones offer a 15 percent higher per MHz performance and should be more energy efficient. In the Kirin 955, the four Cortex-A72 cores are able to clock up to 2.5 GHz. Furthermore, the processor includes four power saving cores based on the Cortex-A53 architecture that are clocked with 1.8 GHz (max.).

The Kirin 955 is manufactured in 16nm at TSMC (16FF+ process).

Qualcomm Snapdragon 675

► remove from comparison Qualcomm SD 675

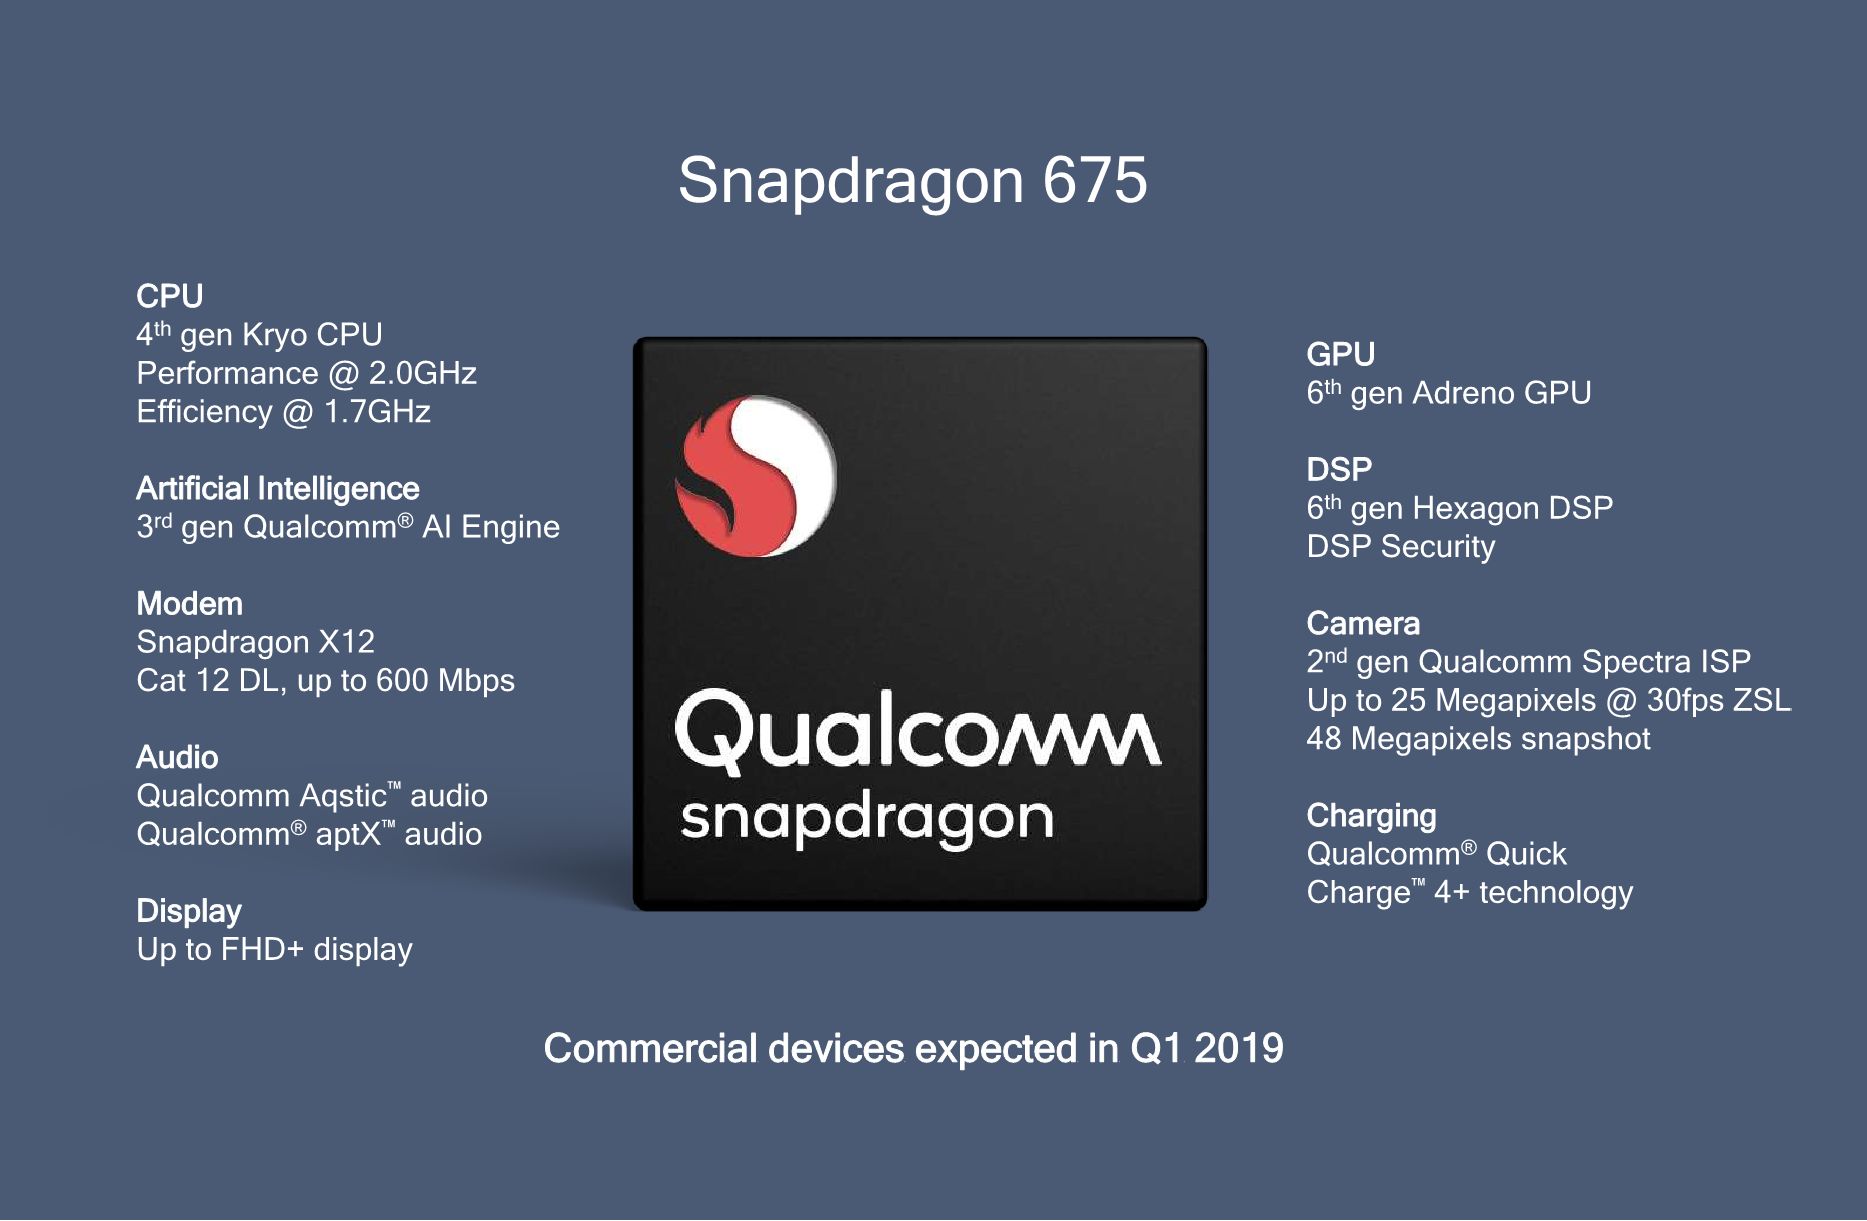
The Qualcomm Snapdragon 675 (SD675) is a fast mid-range ARM-based SoC largely found on Android tablets and smartphones. It features 8 Kryo 460 called cores (64-Bit capable) that are divided in two clusters. A fast cluster of two cores with up to 2 GHz and  based on the ARM Cortex-A76 design. And a power saving efficiency cluster with up to 1.6 GHz and based on much smaller ARM Cortex-A55 cores. Both clusters can also used together.

In addition to the 8 CPU cores, the SoC integrates a lower mid range Adreno 612 GPU, a X12 LTE Modem with up to 600 Mbps download (Cat 12) and 150 Mbps upload (Cat 13), a 802.11ac (Wifi 5) Wave 2 WLAN modem (up to 867 Mbps), a Bluetooth 5.0 radio, satellite positioning (GPS, QZSS, GLONASS, SBAS, Beidou and Galileo) and a video engine (up to 4k30 encoding and support for H.265, H.264, VP8 and VP9).

Performance

Thanks to the two fast Cortex-A76 based cores, the SD675 is able to even best the old high end Snapdragon 835 SoC in some benchmarks. The less powerful Snapdragon 670 e.g. only achieves 70 to 77% of the performance in Geekbench 4.3 (single - multi core test). Current high-end SoCs like the Snapdragon 855 however can still add 50-70% on top of the performance of the 675.

The Snapdragon 675 is produced in the new 11nm LPP (Low Power Plus) process at Samsung which is a combination of 14nm and 10nm. Compared to 14nm LPP, the 11nm LPP process should be able to increase performance by 15% and decrease the chip size by 10% according to Samsung.

ModelHiSilicon Kirin 955Qualcomm Snapdragon 675
CodenameCortex-A72/-A53Kryo 460 Gold (Cortex-A76) / Silver (Cortex-A55)
Clock2500 MHz1600 - 2000 MHz
Cores / Threads8 / 88 / 8
Technology16 nm11 nm
FeaturesARM Mali-T880 MP4 GPU, 4x Cortex-A72 (2.5 GHz) + 4x Cortex-A53 (1.8 GHz, big.LITTLE), LTE Cat. 6, 2x 32 Bit LPDDR4-3200 Memory Controller (25.6 GB/s)Adreno 612 GPU, X12 LTE Modem, Hexagon 685 DSP, Spectra 250L ISP
iGPUARM Mali-T880 MP4 ( - 900 MHz)Qualcomm Adreno 612
ArchitectureARMARM
Announced
SeriesQualcomm Snapdragon
Series: Snapdragon Kryo 460 Gold (Cortex-A76) / Silver (Cortex-A55)
Qualcomm Snapdragon 678 compare1.7 - 2.2 GHz8 / 8 cores Kryo 460 Gold (Cortex-A76) / Silver (Cortex-A55)
Qualcomm Snapdragon 675 « 1.6 - 2 GHz8 / 8 cores Kryo 460 Gold (Cortex-A76) / Silver (Cortex-A55)
Manufacturerwww.qualcomm.com

Benchmarks

3DMark - 3DMark Ice Storm Unlimited Physics
min: 15331     avg: 15424     median: 15424 (12%)     max: 15517 Points
min: 15461     avg: 17199     median: 16912 (14%)     max: 19511 Points
3DMark - 3DMark Sling Shot Extreme (ES 3.1) Unlimited Physics
2425 Points (23%)
min: 1684     avg: 2448     median: 2548.5 (24%)     max: 3011 Points
3DMark - 3DMark Sling Shot (ES 3.0) Unlimited Physics
2411 Points (28%)
min: 1657     avg: 2433     median: 2546 (29%)     max: 2984 Points
Geekbench 5.5 - Geekbench 5.1 - 5.5 64 Bit Single-Core
100%
1 SD 675 +
486 Points (16%)
Geekbench 5.5 - Geekbench 5.1 - 5.5 64 Bit Multi-Core
100%
1 SD 675 +
924 Points (2%)
Geekbench 5.0 - Geekbench 5.0 64 Bit Single-Core
100%
1 SD 675 +
min: 492     avg: 501     median: 504 (2%)     max: 506 Points
Geekbench 5.0 - Geekbench 5.0 64 Bit Multi-Core
100%
1 SD 675 +
min: 939     avg: 1389     median: 1610 (5%)     max: 1618 Points
Geekbench 4.4 - Geekbench 4.1 - 4.4 64 Bit Single-Core
1744 Points (17%)
min: 2266     avg: 2323     median: 2323 (23%)     max: 2380 Points
Geekbench 4.4 - Geekbench 4.1 - 4.4 64 Bit Multi-Core
5260 Points (5%)
min: 5998     avg: 6222     median: 6222 (6%)     max: 6446 Points
Geekbench 4.0 - Geekbench 4.0 64 Bit Single-Core
1755 Points (19%)
2376 Points (26%)
Geekbench 4.0 - Geekbench 4.0 64 Bit Multi-Core
4904 Points (6%)
6554 Points (9%)
Geekbench 3 - Geekbench 3 64 Bit Multi-Core
min: 6522     avg: 6539     median: 6539 (10%)     max: 6556 Points
5667 Points (9%)
Geekbench 3 - Geekbench 3 64 Bit Single-Core
min: 1767     avg: 1848     median: 1848 (28%)     max: 1929 Points
1893 Points (28%)
Geekbench 2 - 32 Bit - Geekbench Stream
2634 Points (14%)
2251 Points (12%)
Geekbench 2 - 32 Bit - Geekbench Memory
4524 Points (31%)
2956 Points (20%)
Geekbench 2 - 32 Bit - Geekbench Floating Point
14220 Points (28%)
11428 Points (22%)
Geekbench 2 - 32 Bit - Geekbench Integer
5936 Points (12%)
5292 Points (11%)
Geekbench 2 - 32 Bit - Geekbench Total Score
8222 Points (22%)
6668 Points (17%)
Mozilla Kraken 1.1 - Kraken 1.1 Total Score *
min: 2792     avg: 2858     median: 2857.5 (3%)     max: 2923 ms
min: 2807     avg: 2849     median: 2848.5 (3%)     max: 2890 ms
Octane V2 - Octane V2 Total Score
min: 11783     avg: 11921     median: 11920.5 (8%)     max: 12058 Points
min: 15689     avg: 15703     median: 15702.5 (10%)     max: 15716 Points
WebXPRT 3 - WebXPRT 3 Score
100%
1 SD 675 +
min: 70     avg: 76     median: 76 (14%)     max: 82 Points
Vellamo 3.x - Vellamo 3.x Metal
2880 Points (77%)
Vellamo 3.x - Vellamo 3.x Multicore Beta
3431 Points (76%)
Vellamo 3.x - Vellamo 3.x Browser
6580 Points (87%)
AnTuTu v5 - AnTuTu v5 Total Score
76809 Points (77%)
AnTuTu v6 - AnTuTu v6 Total Score
min: 95743     avg: 97078     median: 97078 (33%)     max: 98413 Points
130196 Points (44%)
AnTuTu v7 - AnTuTu v7 MEM
7306 Points (22%)
min: 9191     avg: 10080     median: 10079.5 (31%)     max: 10968 Points
AnTuTu v7 - AnTuTu v7 UX
35575 Points (44%)
min: 42419     avg: 43904     median: 43904 (54%)     max: 45389 Points
AnTuTu v7 - AnTuTu v7 GPU
30227 Points (9%)
min: 33571     avg: 33624     median: 33623.5 (10%)     max: 33676 Points
AnTuTu v7 - AnTuTu v7 CPU
59266 Points (36%)
min: 75583     avg: 77634     median: 77634 (48%)     max: 79685 Points
AnTuTu v7 - AnTuTu v7 Total Score
132374 Points (23%)
min: 159646     avg: 163741     median: 163741 (29%)     max: 167836 Points
PassMark PerformanceTest Mobile V1 - PerformanceTest Mobile V1 CPU Tests
253465 Points (33%)
190355 Points (25%)
PCMark for Android - PCM f. Android Work 2.0 Battery Life
0 min (0%)
PCMark for Android - PCM f. Android Work Score 2.0
5226 Points (34%)
min: 7315     avg: 7660     median: 7688 (50%)     max: 7950 Points
PCMark for Android - PCM f. Android Work Score
min: 7058     avg: 7109     median: 7108.5 (36%)     max: 7159 Points
min: 9288     avg: 9371     median: 9304 (47%)     max: 9522 Points
PCMark for Android - PCM f. Android Computer Vision
100%
1 SD 675 +
min: 3707     avg: 3748     median: 3748 (20%)     max: 3789 Points
PCMark for Android - PCM f. Android Storage
100%
1 SD 675 +
min: 6738     avg: 8585     median: 8585 (18%)     max: 10432 Points

Average Benchmarks HiSilicon Kirin 955 → 100% n=25

Average Benchmarks Qualcomm Snapdragon 675 → 111% n=25

- Range of benchmark values for this graphics card
red legend - Average benchmark values for this graphics card
* Smaller numbers mean a higher performance
1 This benchmark is not used for the average calculation

Add one or more devices and compare

In the following list you can select (and also search for) devices that should be added to the comparison. You can select more than one device.

restrict list:
v1.35
log 28. 18:27:33

#0 ran 0s before starting gpusingle class +0s ... 0s

#1 checking url part for id 8059 +0s ... 0s

#2 checking url part for id 11403 +0s ... 0s

#3 redirected to Ajax server, took 1766942852s time from redirect:0 +0s ... 0s

#4 did not recreate cache, as it is less than 5 days old! Created at Sun, 28 Dec 2025 05:18:39 +0100 +0s ... 0s

#5 composed specs +0.005s ... 0.005s

#6 did output specs +0s ... 0.005s

#7 getting avg benchmarks for device 8059 +0.001s ... 0.006s

#8 got single benchmarks 8059 +0.004s ... 0.01s

#9 getting avg benchmarks for device 11403 +0.001s ... 0.011s

#10 got single benchmarks 11403 +0.007s ... 0.018s

#11 got avg benchmarks for devices +0s ... 0.018s

#12 No cached benchmark found, getting uncached values +0.024s ... 0.042s

#13 min, max, avg, median took s +0.002s ... 0.044s

#14 return log +0.02s ... 0.064s

Please share our article, every link counts!
Mail Logo
Google Logo Add as a preferred
source on Google
> Expert Reviews and News on Laptops, Smartphones and Tech Innovations > Benchmarks / Tech > Processor Comparison - Head 2 Head
Redaktion, 2017-09- 8 (Update: 2023-07- 1)