Notebookcheck Logo

Samsung Exynos 2200 vs Samsung Exynos 5250 Dual

Samsung Exynos 2200

► remove from comparison Samsung Exynos 2200

The Samsung Exynos 2200  is a high end SoC with 8 cores in three clusters. One fast ARM Cortex-S2 with up to 2.8 GHz for single thread performance. Three more slower ARM Cortex-A710 with up to 2.52 GHz for performance tasks and four efficient cores using the ARM Cortex-A510 architecture clocked at up to 1.82 GHz.

The SoC also integrates a 5G modem with up to 7.35 Gbps (5G NR Sub-6Hz, 5G NR mmWave, LTE Cat.24 DL / Cat.22 UL) similar to the Exynos 2100. In addition to this, an image processor for 200mP in single camera mode and 8K video, an AI engine with a dual-core NPU and DPS and various GNSS systems (GPS, GLONASS, BeiDou, Galileo).

As a first, the Exynos 2200 integrates a graphics card based on the AMD RDNA 2 architecture called Samsung Xclipse 920).

The CPU performance in our benchmarks was slightly below the Snapdragon 8 Gen 1 (fastest Android SoC currently) and the Apple A15 in the iPhone 13.

The chip is produced in the modern 4nm process at Samsung using EUV.

Samsung Exynos 5250 Dual

► remove from comparison Samsung 5250 Dual

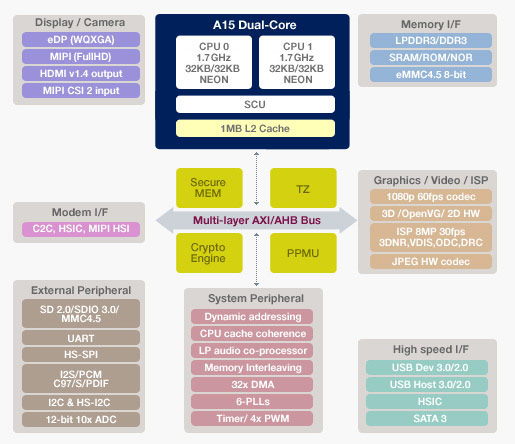
The Samsung Exynos 5 Dual (also called Exynos 5250) is a system on a chip (SoC) for tablets. It was introduced in 2012 (first in the Google Nexus 10 tablet) and features two Cortex-A15 cores, which are clocked at 1.7 GHz. Compared to the commonly used Cortex-A9 architecture, the A15 cores offer an about 50 percent higher per MHz performance, which makes the Exynos 5250 one of the fastest ARM SoCs of 2012. In combination with its high clock speed, the Exynos even outperforms quad-core SoCs like Nvidia's Tegra 3. The memory controller supports LPDDR3 with a maximum of two 32-bit channels and 800 MHz clock speed, resulting in a bandwidth of up to 12.8 GB/s.

The GPU is licensed by ARM and called Mali-T604. The Exynos 5250 integrates the MP4 model, which offers a total of 4 GPU cores clocked at 533 MHz (72.5 GFLOPS). The Mail T604 supports OpenGL ES 3.0, OpenCL 1.1 and DirectX 11 and offers a performance just slightly below the PowerVR SGX554MP4 found in Apple's A6X SoC. Accordingly, typical Android games (2013) can be played fluently even at very high resolutions like 2.560 x 1.600 pixels. Furthermore, a multi-format 1080p 60 fps video codec engine and an 8 MP 30 fps Embedded ISP are integrated.

Due to the high performance, the power consumption of the SoC is also relatively high. The maximum power consumption peaks at about 4 to 8 watts, so the Exynos 5250 can only be used in large tablets.

ModelSamsung Exynos 2200Samsung Exynos 5250 Dual
CodenameExynos X2 / Cortex-A710 / A510Cortex A15
SeriesSamsung ExynosSamsung Exynos
Clock1820 - 2800 MHz1700 MHz
Cores / Threads8 / 82 / 2
Technology4 nm32 nm
Features5G NR Sub-6GHz, 5G NR mmWave, LTE Cat. 24/22, LPDDR5-RAM, Dual-Core NPU, Wi-Fi 6E, Bluetooth 5.2Mali-T604, Cortex-A15 mit 64-/128-bit SIMD NEON
iGPUSamsung Xclipse 920 ( - 555 MHz)
ArchitectureARMARM
Announced
Manufacturersemiconductor.samsung.comwww.samsung.com
L1 Cache64 KB
L2 Cache1 MB
SocketSCP: 1088FCFBGA / POP: 1036FCFBGA

Benchmarks

3DMark - 3DMark Sling Shot Extreme (ES 3.1) Unlimited Physics
min: 3909     avg: 4039     median: 3978.5 (37%)     max: 4288 Points
3DMark - 3DMark Sling Shot (ES 3.0) Unlimited Physics
min: 3923     avg: 4120     median: 4085.5 (47%)     max: 4385 Points
Geekbench 6.5 - Geekbench 6.5 Single-Core
1601 Points (37%)
Geekbench 6.5 - Geekbench 6.5 Multi-Core
3938 Points (15%)
Geekbench 5.5 - Geekbench 5.1 - 5.5 64 Bit Single-Core
min: 1133     avg: 1148     median: 1149.5 (39%)     max: 1161 Points
Geekbench 5.5 - Geekbench 5.1 - 5.5 64 Bit Multi-Core
min: 3474     avg: 3600     median: 3579.5 (6%)     max: 3768 Points
Geekbench 4.4 - Geekbench 4.1 - 4.4 64 Bit Single-Core
min: 5788     avg: 5830     median: 5829.5 (58%)     max: 5871 Points
Geekbench 4.4 - Geekbench 4.1 - 4.4 64 Bit Multi-Core
min: 15209     avg: 15260     median: 15259.5 (15%)     max: 15310 Points
Geekbench 2 - 32 Bit - Geekbench Stream
968 Points (5%)
Geekbench 2 - 32 Bit - Geekbench Memory
2480 Points (17%)
Geekbench 2 - 32 Bit - Geekbench Floating Point
3916 Points (8%)
Geekbench 2 - 32 Bit - Geekbench Integer
1794 Points (4%)
Geekbench 2 - 32 Bit - Geekbench Total Score
2591 Points (7%)
Linpack Android / IOS - Linpack Multi Thread
189.9 MFLOPS (6%)
Linpack Android / IOS - Linpack Single Thread
134.2 MFLOPS (13%)
Mozilla Kraken 1.1 - Kraken 1.1 Total Score *
min: 840.3     avg: 1306     median: 1408.5 (2%)     max: 1566 ms
5476 ms (6%)
Sunspider - Sunspider 1.0 Total Score *
281.5 ms (3%)
min: 704     avg: 721     median: 720.5 (8%)     max: 737 ms
Sunspider - Sunspider 0.9.1 Total Score *
min: 774     avg: 1060     median: 1060 (10%)     max: 1346 ms
Octane V2 - Octane V2 Total Score
min: 34055     avg: 42162     median: 41695 (28%)     max: 51202 Points
4943 Points (3%)
WebXPRT 4 - WebXPRT 4 Score
130 Points (34%)
WebXPRT 3 - WebXPRT 3 Score
min: 124     avg: 142     median: 149 (27%)     max: 153 Points
Quadrant Standard Edition 2.0 - Quadrant Standard 2.0 Total Score
4376 points (10%)
AnTuTu v3 - AnTuTu v3 CPU
5148 Points (33%)
Antutu v9 - AnTuTu v9 Total Score
min: 704479     avg: 797881     median: 818322 (40%)     max: 850401 Points
Antutu v9 - AnTuTu v9 CPU
min: 145904     avg: 195898     median: 208772 (52%)     max: 220142 Points
Antutu v10 - AnTuTu v10 Total Score
1124910 Points (32%)
Antutu v10 - AnTuTu v10 CPU
327492 Points (32%)
PCMark for Android - PCM f. Android Storage 2.0 random write internal
70.5 MB/s (45%)
PCMark for Android - PCM f. Android Storage 2.0 seq write internal
685 MB/s (19%)
PCMark for Android - PCM f. Android Storage 2.0 random read internal
41.6 MB/s (20%)
PCMark for Android - PCM f. Android Storage 2.0 seq read internal
1300 MB/s (32%)
PCMark for Android - PCM f. Android Storage 2.0 score
min: 31101     avg: 33630     median: 33934.5 (15%)     max: 35551 Points
PCMark for Android - PCM f. Android Work Score 3.0
min: 12579     avg: 13805     median: 13820.5 (48%)     max: 14998 Points
PCMark for Android - PCM f. Android Work Score 2.0
min: 12233     avg: 12402     median: 12402 (81%)     max: 12571 Points
CrossMark - CrossMark Overall
min: 888     avg: 979     median: 949.5 (36%)     max: 1129 Points
Power Consumption - Geekbench 5.5 Power Consumption 150cd *
min: 6.24     avg: 6.7     median: 6.8 (3%)     max: 7.01 Watt
Power Consumption - Idle Power Consumption 150cd 1min *
min: 0.625     avg: 0.8     median: 0.8 (1%)     max: 0.913 Watt

Average Benchmarks Samsung Exynos 2200 → 100% n=3

Average Benchmarks Samsung Exynos 5250 Dual → 26% n=3

- Range of benchmark values for this graphics card
red legend - Average benchmark values for this graphics card
* Smaller numbers mean a higher performance
1 This benchmark is not used for the average calculation

Add one or more devices and compare

In the following list you can select (and also search for) devices that should be added to the comparison. You can select more than one device.

restrict list:
v1.35
log 14. 23:50:02

#0 ran 0s before starting gpusingle class +0s ... 0s

#1 checking url part for id 14146 +0s ... 0s

#2 checking url part for id 3644 +0s ... 0s

#3 redirected to Ajax server, took 1765752602s time from redirect:0 +0s ... 0s

#4 did not recreate cache, as it is less than 5 days old! Created at Sun, 14 Dec 2025 14:22:43 +0100 +0s ... 0s

#5 composed specs +0.005s ... 0.005s

#6 did output specs +0s ... 0.005s

#7 getting avg benchmarks for device 14146 +0.001s ... 0.005s

#8 got single benchmarks 14146 +0.006s ... 0.011s

#9 getting avg benchmarks for device 3644 +0.001s ... 0.012s

#10 got single benchmarks 3644 +0.005s ... 0.017s

#11 got avg benchmarks for devices +0s ... 0.017s

#12 min, max, avg, median took s +0.018s ... 0.035s

#13 return log +0s ... 0.036s

Please share our article, every link counts!
Mail Logo
> Expert Reviews and News on Laptops, Smartphones and Tech Innovations > Benchmarks / Tech > Processor Comparison - Head 2 Head
Redaktion, 2017-09- 8 (Update: 2023-07- 1)