Notebookcheck Logo

MediaTek Dimensity 8200-Ultra vs Apple A15 Bionic

MediaTek Dimensity 8200-Ultra

► remove from comparison Mediatek Dimensity 8200-Ultra

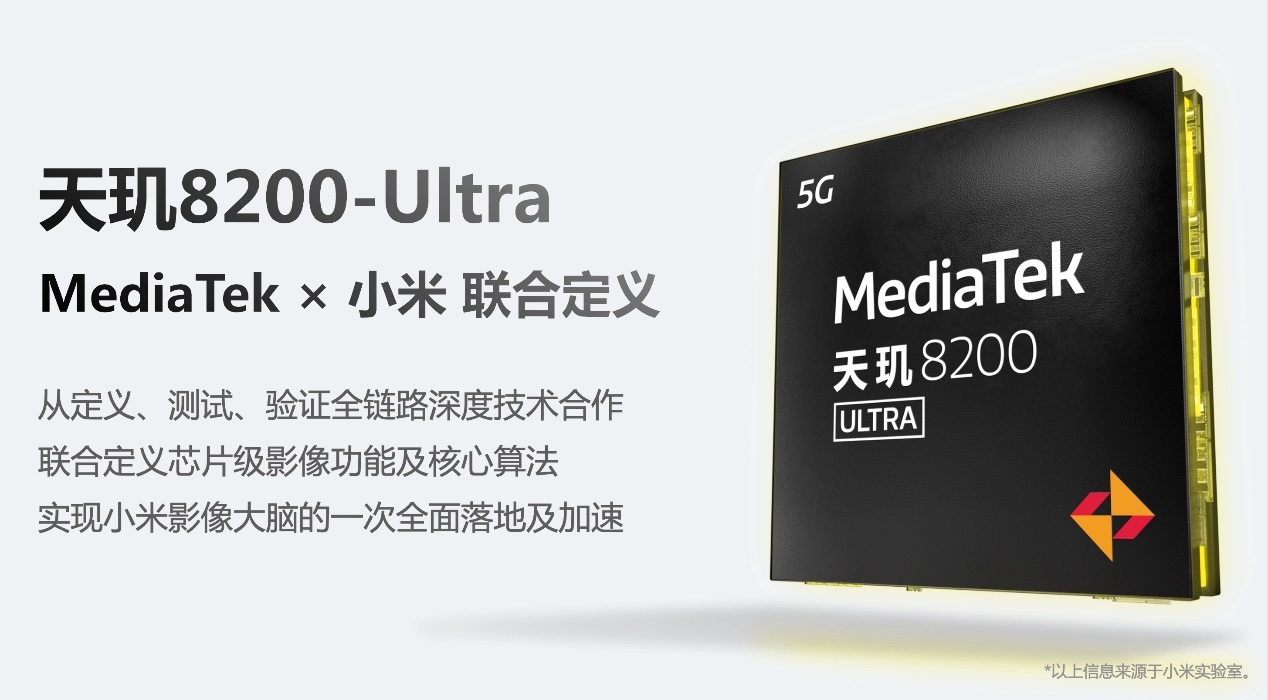
The MediaTek Dimensity 8200-Ultra is a upper mid-range ARM-based SoC (system-on-a-chip) that is manufactured using the modern 4 nm process. It was specially designed for use in Android smartphones and is in the upper class in terms of performance. It supports all current mobile communication standards, including 5G SA. 

The CPU works with a total of eight cores, which are divided into two clusters. In the first cluster, an ARM Cortex-A78 power core clocked at 3.1 GHz is joined by three further ARM Cortex-A78 power cores clocked at 3 GHz. In the second cluster, four ARM Cortex-A55 power cores operate at 2.0 GHz. LPDDR5 RAM can be used as RAM and UFS 3.1 is supported as internal memory. 

In terms of connectivity, dual 5G with a theoretical peak download speed of up to 4.7 GBit/s is available, as well as WiFi 6E and Bluetooth 5.3.

The Mediatek Dimensity 8200-Ultra is a variant of the otherwise identical Mediatek Dimensity 8200 that has been specially customised for Xiaomi and features improvements to the camera ISP. An Imagiq 785 image processor is responsible for processing the camera data. Video recordings are supported with up to 4K at 60 fps. The CPU part of the older Dimensity 8100 is very similar and offers the same CPU and GPU cores.

The integrated ARM Mali-G610 MC6 graphics unit can power displays with a resolution of up to 2,960 x 1,440 pixels (WQHD+) and a refresh rate of up to 120 Hz. With Full HD+, even up to 180 Hz is possible.

Apple A15 Bionic

► remove from comparison Apple A15

The Apple A15 Bionic is a System on a Chip (SoC) from Apple that is found in the iPhone 13 and iPad Mini (2021) models. It was announced late 2021 and offers 6 cores divided in 2 performance cores and four power efficiency cores. The CPU performance increases only slightly compared to the A14, but GPU (in the higher end models) offers higher gains.

The chip is manufactured in 5nm and integrates 15.8 billion transistors (compared to the 11.8 of the A14).

ModelMediaTek Dimensity 8200-UltraApple A15 Bionic
CodenameCortex-A78 / A55
Clock2000 - 3100 MHz2020 - 3230 MHz
L3 Cache4 MB32 MB
Cores / Threads8 / 8
1 x 3.1 GHz ARM Cortex-A78
3 x 3.0 GHz ARM Cortex-A78
4 x 2.0 GHz ARM Cortex-A55
6 / 6
Technology4 nm5 nm
FeaturesARM Mali-G610 MC6 GPU, Dual 5G modem, WiFi 6E, Bluetooth 5.3, H.264/HEVC video decodingARMv8 Instruction Set, Machine Learning Controller, 16-Core Neural Engine, Secure Enclave, Advanced Image Signal Processor
iGPUARM Mali-G610 MP6Apple A15 GPU 5-Core
ArchitectureARMARM
Announced
Manufacturerwww.google.com
SeriesApple Apple A-Series
Series: Apple A-Series
Apple A19 Pro compare2.6 - 4.26 GHz6 / 6 cores32.768 KB L3
Apple A19 compare2.6 - 4.26 GHz6 / 6 cores12 MB L3
Apple A18 Pro compare - 4 GHz6 / 6 cores
Apple A18 compare - 3.8 GHz6 / 6 cores
Apple A15 Bionic « 2.02 - 3.23 GHz6 / 6 cores32 MB L3
Apple A12 Bionic compare - 2.49 GHz6 / 6 cores
Apple A6x compare1.4 GHzcores
Apple A6 compare1 GHzcores
L2 Cache16 MB
Transistors15800 Million

Benchmarks

3DMark - 3DMark Sling Shot Extreme (ES 3.1) Unlimited Physics
min: 5558     avg: 5801     median: 5800.5 (55%)     max: 6043 Points
33%
A15 +
min: 1852     avg: 2027     median: 1913 (18%)     max: 2307 Points
3DMark - 3DMark Sling Shot (ES 3.0) Unlimited Physics
min: 4369     avg: 5005     median: 5005 (57%)     max: 5641 Points
Geekbench 6.5 - Geekbench 6.5 Single-Core
min: 981     avg: 1117     median: 1116.5 (28%)     max: 1252 Points
209%
A15 +
2332 Points (58%)
Geekbench 6.5 - Geekbench 6.5 Multi-Core
min: 3295     avg: 3665     median: 3664.5 (14%)     max: 4034 Points
154%
A15 +
5661 Points (22%)
Geekbench 5.5 - Geekbench 5.1 - 5.5 64 Bit Single-Core
min: 1012     avg: 1015     median: 1015 (40%)     max: 1018 Points
171%
A15 +
min: 1590     avg: 1723     median: 1734 (68%)     max: 1755 Points
Geekbench 5.5 - Geekbench 5.1 - 5.5 64 Bit Multi-Core
min: 3833     avg: 3874     median: 3873.5 (7%)     max: 3914 Points
124%
A15 +
min: 4559     avg: 4755     median: 4788 (9%)     max: 4914 Points
Geekbench 5.0 - Geekbench 5.0 64 Bit Single-Core
998 Points (4%)
Geekbench 5.0 - Geekbench 5.0 64 Bit Multi-Core
3889 Points (12%)
Geekbench 4.4 - Geekbench 4.1 - 4.4 64 Bit Single-Core
4858 Points (49%)
Geekbench 4.4 - Geekbench 4.1 - 4.4 64 Bit Multi-Core
16050 Points (16%)
Geekbench 4.0 - Geekbench 4.0 64 Bit Single-Core
4726 Points (52%)
Geekbench 4.0 - Geekbench 4.0 64 Bit Multi-Core
15265 Points (20%)
Geekbench 3 - Geekbench 3 64 Bit Multi-Core
15888 Points (25%)
Geekbench 3 - Geekbench 3 64 Bit Single-Core
4789 Points (72%)
Mozilla Kraken 1.1 - Kraken 1.1 Total Score *
min: 1221.5     avg: 1227     median: 1227.2 (1%)     max: 1232.9 ms
272%
A15 +
min: 413.6     avg: 455.6     median: 451 (1%)     max: 507.3 ms
Sunspider - Sunspider 1.0 Total Score *
100%
1 A15 +
77 ms (1%)
Octane V2 - Octane V2 Total Score
min: 35231     avg: 38727     median: 38726.5 (28%)     max: 42222 Points
165%
A15 +
min: 57143     avg: 63305     median: 64026.5 (47%)     max: 65969 Points
WebXPRT 4 - WebXPRT 4 Score
min: 107     avg: 108     median: 108 (30%)     max: 109 Points
174%
A15 +
min: 188     avg: 188.3     median: 188 (52%)     max: 189 Points
WebXPRT 3 - WebXPRT 3 Score
min: 122     avg: 122.5     median: 122.5 (22%)     max: 123 Points
204%
A15 +
min: 219     avg: 254.3     median: 250 (45%)     max: 279 Points
Antutu v9 - AnTuTu v9 Total Score
903102 Points (44%)
89%
A15 +
min: 722973     avg: 788523     median: 800415 (39%)     max: 832548 Points
Antutu v9 - AnTuTu v9 CPU
269706 Points (67%)
78%
A15 +
min: 192891     avg: 209810     median: 209802 (52%)     max: 227638 Points
Antutu v10 - AnTuTu v10 Total Score
min: 947949     avg: 954196     median: 954196 (32%)     max: 960442 Points
Antutu v10 - AnTuTu v10 CPU
min: 261709     avg: 266168     median: 266168 (8%)     max: 270627 Points
PassMark PerformanceTest Mobile V1 - PerformanceTest Mobile V1 CPU Tests
100%
1 A15 +
min: 10349     avg: 10411     median: 10410.5 (1%)     max: 10472 Points
PCMark for Android - PCM f. Android Storage 2.0 random write internal
54.9 MB/s (37%)
PCMark for Android - PCM f. Android Storage 2.0 seq write internal
1352 MB/s (38%)
PCMark for Android - PCM f. Android Storage 2.0 random read internal
36.8 MB/s (18%)
PCMark for Android - PCM f. Android Storage 2.0 seq read internal
1588 MB/s (40%)
PCMark for Android - PCM f. Android Storage 2.0 score
33757 Points (15%)
PCMark for Android - PCM f. Android Work Score 3.0
min: 13966     avg: 14423     median: 14423 (53%)     max: 14880 Points
CrossMark - CrossMark Overall
min: 784     avg: 828     median: 828 (31%)     max: 872 Points
138%
A15 +
min: 1132     avg: 1156     median: 1145 (43%)     max: 1190 Points
Power Consumption - Geekbench 5.5 Power Consumption 150cd *
min: 4.46     avg: 5.1     median: 5.1 (2%)     max: 5.74 Watt
Power Consumption - Idle Power Consumption 150cd 1min *
min: 0.997     avg: 1     median: 1 (1%)     max: 1.03 Watt

Average Benchmarks MediaTek Dimensity 8200-Ultra → 100% n=13

Average Benchmarks Apple A15 Bionic → 143% n=13

- Range of benchmark values for this graphics card
red legend - Average benchmark values for this graphics card
* Smaller numbers mean a higher performance
1 This benchmark is not used for the average calculation

Add one or more devices and compare

In the following list you can select (and also search for) devices that should be added to the comparison. You can select more than one device.

restrict list:
v1.33
log 27. 11:34:00

#0 ran 0s before starting gpusingle class +0s ... 0s

#1 checking url part for id 15120 +0s ... 0s

#2 checking url part for id 13825 +0s ... 0s

#3 redirected to Ajax server, took 1758965640s time from redirect:0 +0s ... 0s

#4 did not recreate cache, as it is less than 5 days old! Created at Thu, 25 Sep 2025 05:17:37 +0200 +0s ... 0s

#5 composed specs +0.004s ... 0.004s

#6 did output specs +0s ... 0.004s

#7 getting avg benchmarks for device 15120 +0.001s ... 0.005s

#8 got single benchmarks 15120 +0.007s ... 0.012s

#9 getting avg benchmarks for device 13825 +0.001s ... 0.012s

#10 got single benchmarks 13825 +0.008s ... 0.02s

#11 got avg benchmarks for devices +0s ... 0.02s

#12 min, max, avg, median took s +0.021s ... 0.041s

#13 return log +0s ... 0.042s

Please share our article, every link counts!
Mail Logo
> Expert Reviews and News on Laptops, Smartphones and Tech Innovations > Benchmarks / Tech > Processor Comparison - Head 2 Head
Redaktion, 2017-09- 8 (Update: 2023-07- 1)