

Qualcomm Adreno 418 vs Qualcomm Adreno 420
Qualcomm Adreno 418
► remove from comparison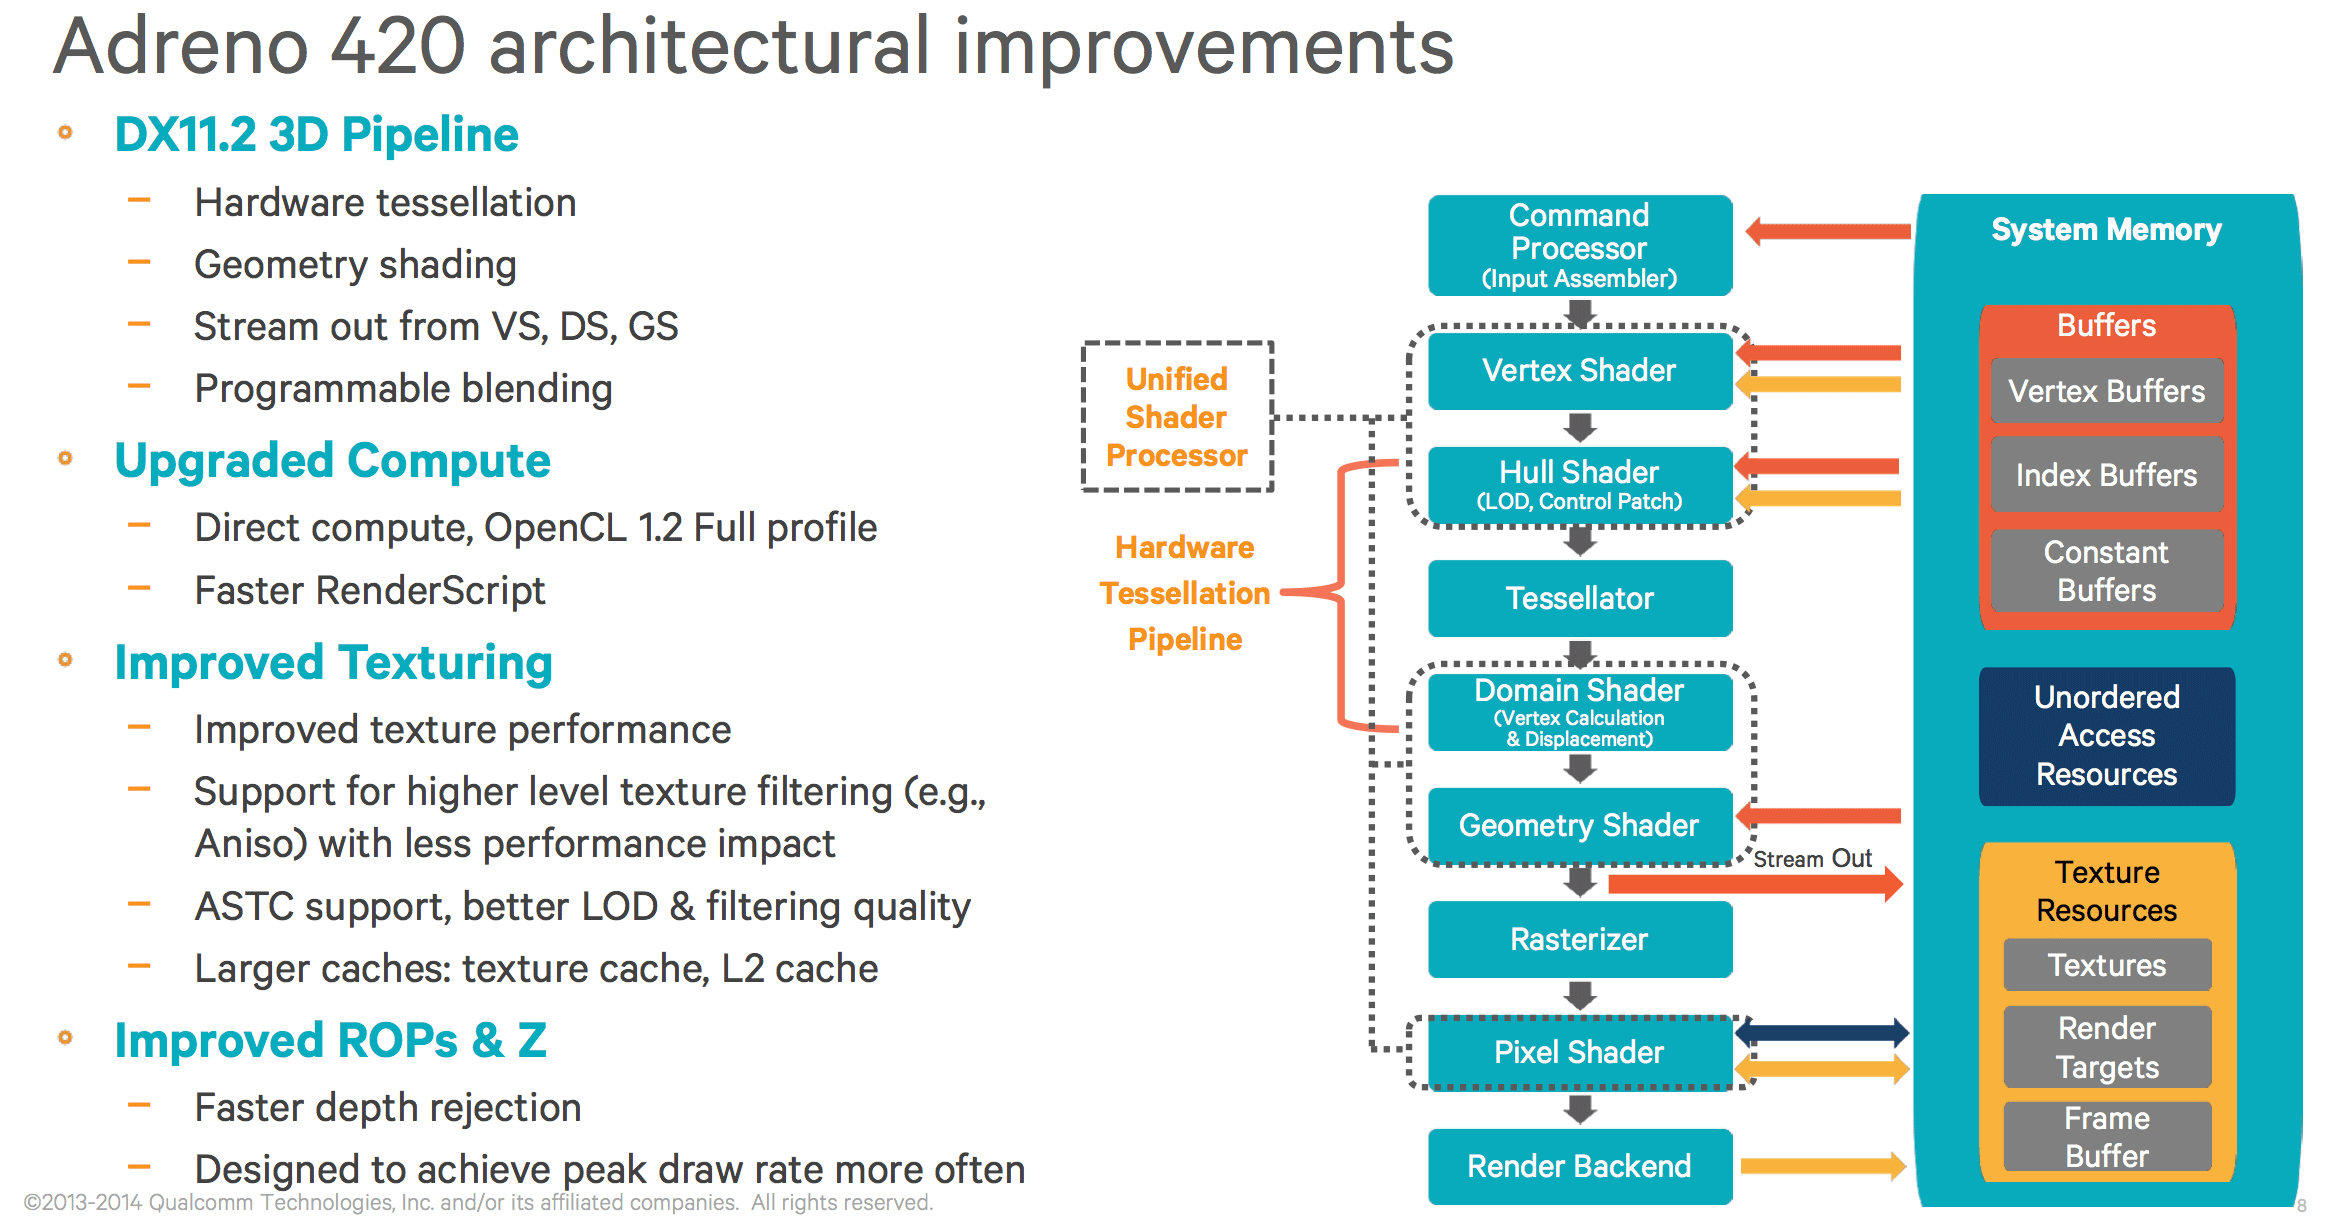
The Qualcomm Adreno 418 is an integrated graphics card for (mostly Android based) smartphones and tablets. It is integrated in the Qualcomm Snapdragon 808 SoC and was announced in mid 2014. The GPU supports OpenGL ES 3.1 and DirectX 11 feature level 11_1 (with hardware tessellation). The graphics card uses a technology called FlexRender to intelligently switch between TBR (TBR Tile Based Renderer) and the classic direct rendering.
Compared to the Adreno 420, the performance of the 418 is about 20 percent slower (at 600 MHz). This puts the Adreno 418 in the upper middle class in 2015 and even demanding (Android) games should run fluently.
Qualcomm Adreno 420
► remove from comparison
The Qualcomm Adreno 420 is an integrated graphics card for (mostly Android based) smartphones and tablets. It was introduced in the middle of 2014 and is integrated in the Qualcomm Snapdragon 805 SoC. The graphics card uses a technology called FlexRender. It can switch "intelligently" between TBR (TBR Tile Based Renderer) and the classic direct rendering. It supports OpenGL ES 3.1 and DirectX 11.2 Feature Level 11_1 (compared to ES 3.0 and DirectX 9_3 of the Adreno 330).
The graphics clock rate of the Adreno 420 differs from the used SoC and where it is built in. At launch it ranges from 500 to 600 MHz in the Snapdragon 805 APQ8084.
According to Qualcomm, the power consumption in comparison to the Snapdragon 800 has been reduced by up to 20% running GFXBench 2.7 T-Rex, while delivering up to 40% more performance. First benchmarks show even bigger gains; however, the performance will decrease over time to prevent too high temperatures (especially in smartphones). This is common amongst many other ARM SoCs. Nevertheless, the Adreno 420 beats the Mali-T628 MP6 (Samsung Exynos 5420/5430) as well as the PowerVR G6430 (Apple A7) and is one of the fastest mobile GPUs in mid-2014, but still significantly slower than the Nvidia Tegra K1 or the PowerVR GX6650 in Apple's A8X SoC (both mainly tablet GPUs).
| Qualcomm Adreno 418 | Qualcomm Adreno 420 | |||||||||||||||||||||||||
| Adreno 400 Series |
|
| ||||||||||||||||||||||||
| Pipelines | 128 - unified | 128 - unified | ||||||||||||||||||||||||
| Core Speed | 600 (Boost) MHz | 600 (Boost) MHz | ||||||||||||||||||||||||
| Shared Memory | yes | yes | ||||||||||||||||||||||||
| API | DirectX 11.1, OpenGL ES 3.1 | DirectX 11, OpenGL ES 3.1 | ||||||||||||||||||||||||
| technology | 20 nm | 28 nm | ||||||||||||||||||||||||
| Features | OpenCL 1.2 | OpenCL 1.2 | ||||||||||||||||||||||||
| Date of Announcement | 23.06.2014 | 23.06.2014 | ||||||||||||||||||||||||
| Link to Manufacturer Page | www.qualcomm.com | www.qualcomm.com |
|
| ||||||||||||||||
Benchmarks

GFXBench T-Rex HD Offscreen C24Z16 + Qualcomm Adreno 418
Average Benchmarks Qualcomm Adreno 418 → 100% n=11
Average Benchmarks Qualcomm Adreno 420 → 79% n=11
* Smaller numbers mean a higher performance
1 This benchmark is not used for the average calculation
Game Benchmarks
The following benchmarks stem from our benchmarks of review laptops. The performance depends on the used graphics memory, clock rate, processor, system settings, drivers, and operating systems. So the results don't have to be representative for all laptops with this GPU. For detailed information on the benchmark results, click on the fps number.
Dead Trigger 2
2013
Asphalt 8: Airborne
2013Gangstar Vegas
2013
Real Racing 3
2013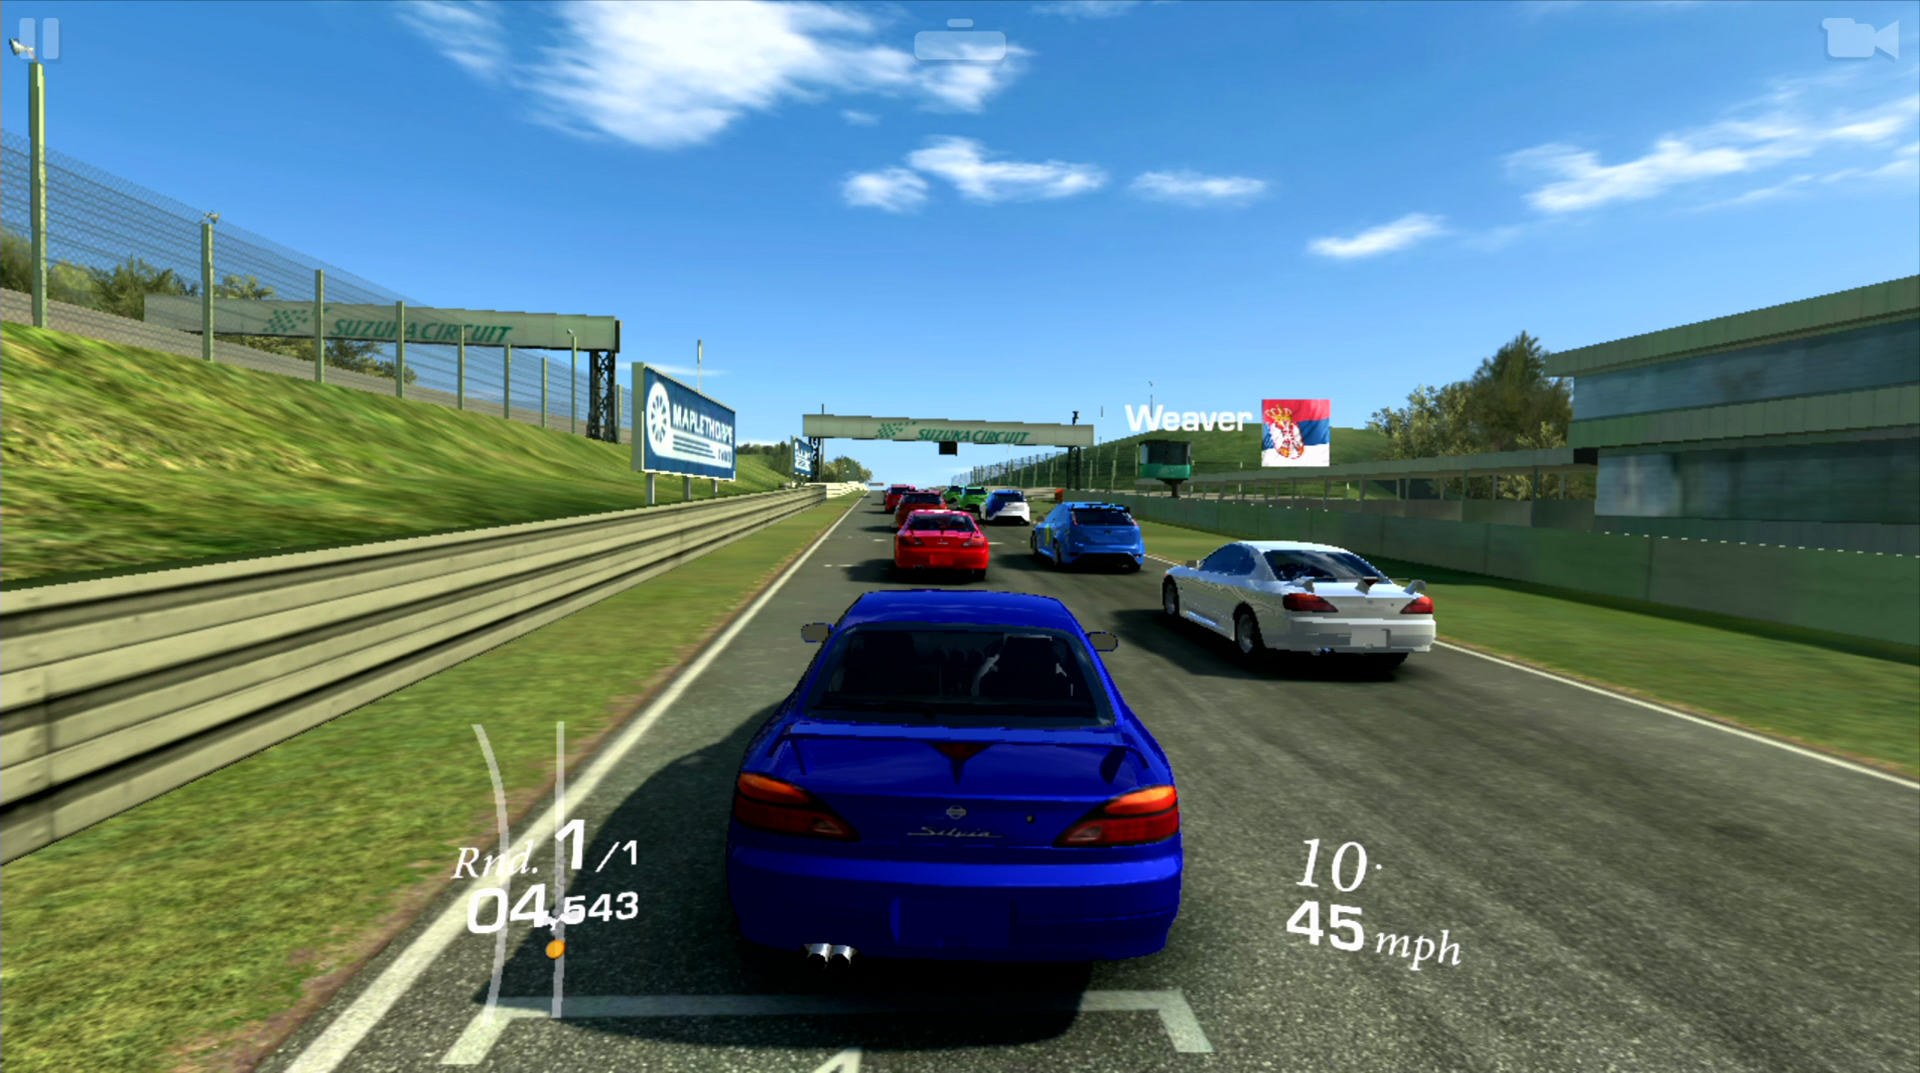

Temple Run 2
2013Minecraft - Pocket Edition
2011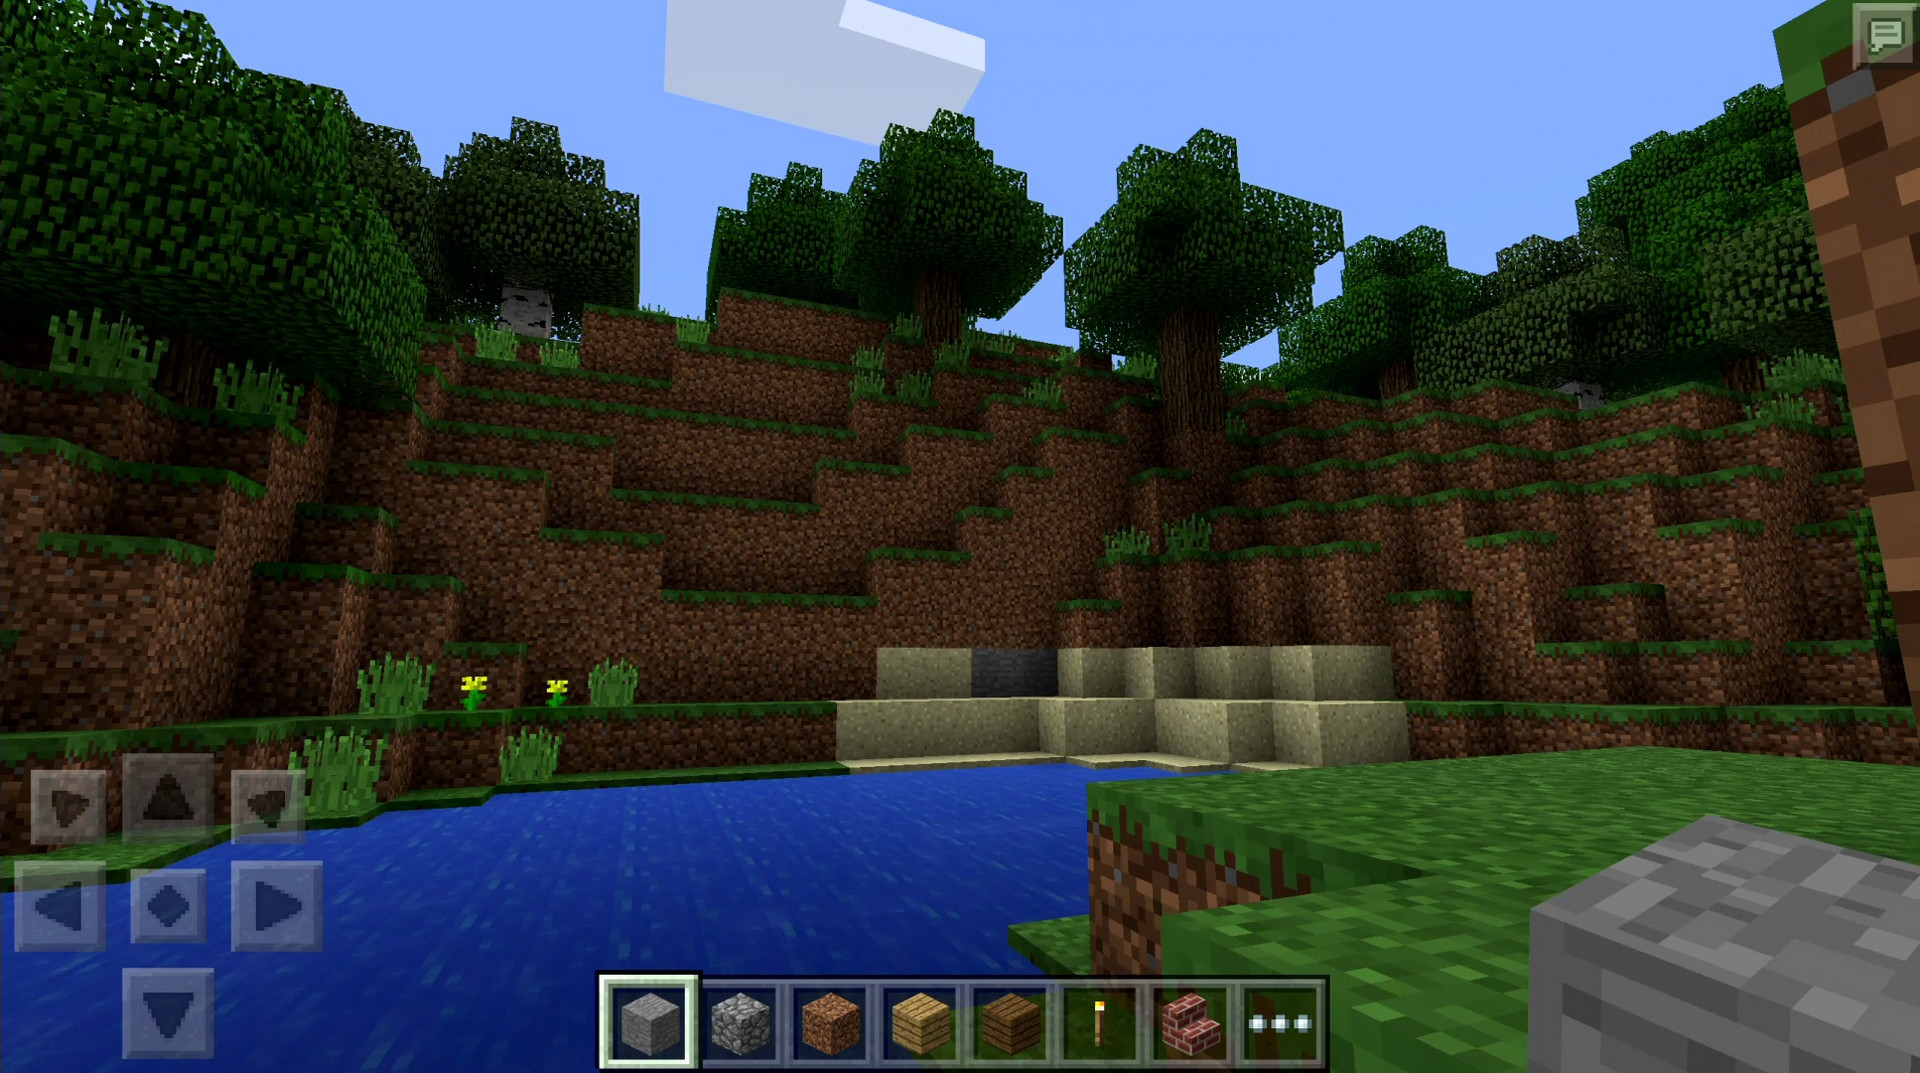
Average Gaming Qualcomm Adreno 418 → 100%
Average Gaming 30-70 fps → 100%
| Qualcomm Adreno 418 | Qualcomm Adreno 420 | |||||||||||||
|---|---|---|---|---|---|---|---|---|---|---|---|---|---|---|
| low | med. | high | ultra | QHD | 4K | low | med. | high | ultra | QHD | 4K | |||
| Dead Trigger 2 | 36 | |||||||||||||
| Asphalt 8: Airborne | 29 | 27 | ||||||||||||
| Gangstar Vegas | 22.7 | |||||||||||||
| Real Racing 3 | 28.6 | |||||||||||||
| Temple Run 2 | 59 | |||||||||||||
| Minecraft - Pocket Edition | 51.9 | |||||||||||||
| Qualcomm Adreno 418 | Qualcomm Adreno 420 | |||||||||||||
| low | med. | high | ultra | QHD | 4K | low | med. | high | ultra | QHD | 4K | < 30 fps < 60 fps < 120 fps ≥ 120 fps | 1 | | 2 2 | 1 1 | | | < 30 fps < 60 fps < 120 fps ≥ 120 fps | | | | | | |
For more games that might be playable and a list of all games and graphics cards visit our Gaming List