Notebookcheck Logo

Apple A9 vs Apple A7

Apple A9

► remove from comparison Apple A9

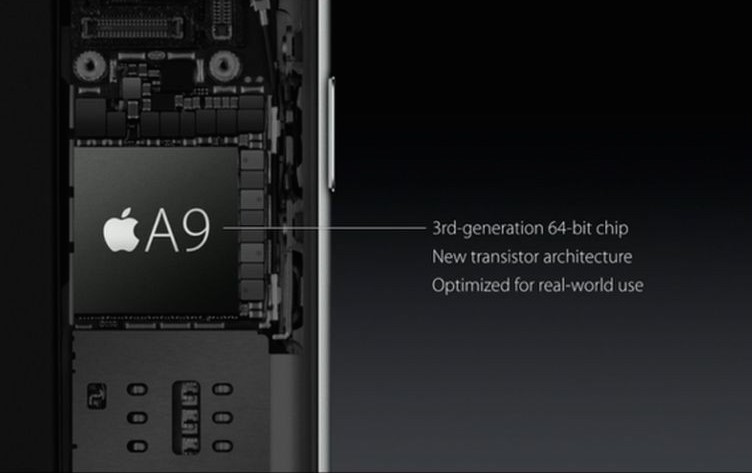
The Apple A9 is a high-end dual-core ARM SoC for smartphones. It was announced in Sept. 2015 in the new iPhone 6s and 6s Plus. Technical details were not published, but the CPU part should be about 70% and the GPU 90% faster than the previous Apple A8. Therefore, the performance should be on par with high-end Android SoCs in 2015.

It is based on the third generation of Apples 64 Bit architectures (Cyclone 3?) and uses a "new transistor technology". It is manufactured at Samsung in 14nm (slightly smaller die) and TSMC at 16nm (both FINFET 3D transistors). A performance difference of both versions are not noticable.

Furthermore, the chip now integrates the M9 motion coprocessor and a 4K video de- and encoder (as the iPhones 6s supports 4K video recording). The integrated graphics card should be still based on PowerVR technology.

The power consumption could be lower than the A8 due to the new process technology and the fact that the iPhones now got a smaller battery (due to the haptic engine part).

Apple A7

► remove from comparison Apple A7

The Apple A7 is a high-end ARM SoC launched in September 2013 alongside the iPhone 5S. The chip can also be found in the iPad Air. It is one of the first ARM SoCs to implement the 64-bit ARMv8 ISA. The two CPU cores are clocked at 1.3 GHz (iPad Air: 1.4 GHz) and are based on Apple's Cyclone architecture. Furthermore, the chip also integrates a PowerVR Series 6 (Rogue) G6430 GPU and a 2x 32-bit LPDDR3 memory controller.

Architecture

Cyclone is the successor to the Swift architecture, which was used in the previous generation Apple A6/A6X SoCs (iPhone 5/iPad 4). The architecture is likely still a superscalar out-of-order design, but with significant revisions. Besides the new ARMv8 ISA, the chip offers various cryptography extensions (AES, SHA), extended registers and improved SIMD instructions. In combination with many other improvements like larger L1 caches and other optimizations, the performance per clock has been increased by about 50 percent. Even greater gains can be reported using 64-bit software.

Performance

Despite the low clock speed and only two CPU cores, the Apple A7 competes with other high-end ARM SoCs such as the Qualcomm Snapdragon 800. In software with poor parallelization like browser benchmarks, the A7 can outperform the entire ARM competition and be on par with the AMD A4-5000 or Intel Atom Z3770.

Graphics

The SoC integrates a PowerVR Series 6 (Rogue) G6430 GPU with 4 clusters. The G6430 offers more than twice the computing power of the SGX543MP3 in the Apple A6 and supports OpenGL ES 3.0 for the first time. The exact clock rate has not yet been confirmed, but it is probably in the 400 MHz range resulting in more than 100 GFLOPS. In the iPad Air, the GPU is clocked slightly higher at presumably about 450 MHz. Compared with other mobile graphics solutions, the G6430 performs similar to the tablet version of the Snapdragon 800 / Adreno 330 and is thus one of the fastest GPUs in its class. Therefore, even the most demanding iOS games of 2013 will run fluently.

Power Consumption

The A7 can be found in the Apple iPhone 5S, which offers a very long battery life despite its relatively low battery capacity. The chip is produced in a 28nm HKMG (High-K Metal Gate) process by Samsung and should have an estimated maximum power consumption of less than 2 - 3 W. In the iPad Air, the SoC should have a slightly higher TDP due to higher clock rates and less throttling.

ModelApple A9Apple A7
CodenameCyclone 3Cyclone
Clock1800 MHz1300 - 1400 MHz
Cores / Threads2 / 22 / 2
Technology14/16 nm28 nm
FeaturesARMv8 Instruction SetARMv8 Instruction Set, PowerVR G6430 (4 Cluster Rogue), 2x 32 Bit LPDDR3-1333 Memory Controller
iGPUApple A9 / PowerVR GT7600
ArchitectureARMARM
Announced
L1 Cache256 KB
L2 Cache1 MB
L3 Cache4 MB
Transistors> 1000 Million
Die Size102 mm2

Benchmarks

3DMark - 3DMark Ice Storm Extreme Physics
100%
1 A7 +
min: 7672     avg: 7759     median: 7758.5 (6%)     max: 7845 Points
3DMark - 3DMark Ice Storm Unlimited Physics
100%
A9 +
min: 12854     avg: 13248     median: 13210.5 (11%)     max: 13717 Points
60%
A7 +
min: 7798     avg: 8039     median: 7987 (6%)     max: 8520 Points
3DMark - 3DMark Sling Shot Extreme (ES 3.1) Unlimited Physics
100%
1 A9 +
1094 Points (10%)
3DMark - 3DMark Sling Shot (ES 3.0) Unlimited Physics
100%
1 A9 +
1093 Points (12%)
Geekbench 6.5 - Geekbench 6.5 Single-Core
100%
1 A9 +
645 Points (15%)
Geekbench 6.5 - Geekbench 6.5 Multi-Core
100%
1 A9 +
1010 Points (4%)
Geekbench 5.5 - Geekbench 5.1 - 5.5 64 Bit Single-Core
100%
A9 +
531 Points (18%)
51%
A7 +
min: 270     avg: 273     median: 273 (9%)     max: 276 Points
Geekbench 5.5 - Geekbench 5.1 - 5.5 64 Bit Multi-Core
100%
A9 +
970 Points (2%)
52%
A7 +
min: 500     avg: 501     median: 501 (1%)     max: 502 Points
Geekbench 4.4 - Geekbench 4.1 - 4.4 64 Bit Single-Core
100%
1 A9 +
2556 Points (26%)
Geekbench 4.4 - Geekbench 4.1 - 4.4 64 Bit Multi-Core
100%
1 A9 +
4459 Points (4%)
Geekbench 4.0 - Geekbench 4.0 64 Bit Single-Core
100%
1 A9 +
min: 2503     avg: 2527     median: 2526.5 (28%)     max: 2550 Points
Geekbench 4.0 - Geekbench 4.0 64 Bit Multi-Core
100%
1 A9 +
min: 4286     avg: 4359     median: 4359 (6%)     max: 4432 Points
Geekbench 3 - Geekbench 3 64 Bit Multi-Core
100%
1 A9 +
min: 4386     avg: 4412     median: 4422 (7%)     max: 4429 Points
Geekbench 3 - Geekbench 3 64 Bit Single-Core
100%
1 A9 +
min: 2533     avg: 2537     median: 2538 (38%)     max: 2539 Points
Geekbench 3 - Geekbench 3 32 Bit Multi-Core
100%
1 A7 +
min: 2449     avg: 2532     median: 2495.5 (4%)     max: 2687 Points
Geekbench 3 - Geekbench 3 32 Bit Single-Core
100%
1 A7 +
min: 1368     avg: 1403     median: 1383 (18%)     max: 1479 Points
Linpack Android / IOS - Linpack Multi Thread
100%
A9 +
min: 1225     avg: 1260     median: 1260 (43%)     max: 1295 MFLOPS
78%
A7 +
min: 931     avg: 1097     median: 987.5 (33%)     max: 1480 MFLOPS
Linpack Android / IOS - Linpack Single Thread
100%
A9 +
min: 669     avg: 677     median: 677 (66%)     max: 685 MFLOPS
81%
A7 +
min: 518     avg: 625     median: 547 (54%)     max: 887 MFLOPS
Mozilla Kraken 1.1 - Kraken 1.1 Total Score *
100%
A9 +
min: 1458     avg: 1656     median: 1712 (2%)     max: 1743 ms
30%
A7 +
min: 5447     avg: 5766     median: 5790 (7%)     max: 6037 ms
Sunspider - Sunspider 1.0 Total Score *
100%
A9 +
223 ms (2%)
56%
A7 +
min: 271.8     avg: 377.6     median: 399.3 (4%)     max: 440 ms
Sunspider - Sunspider 0.9.1 Total Score *
100%
1 A7 +
min: 310.7     avg: 377.2     median: 406.6 (4%)     max: 414.4 ms
Octane V2 - Octane V2 Total Score
100%
A9 +
min: 15967     avg: 16716     median: 16375 (11%)     max: 18148 Points
32%
A7 +
min: 5113     avg: 5338     median: 5180 (3%)     max: 5722 Points
AnTuTu v5 - AnTuTu v5 Total Score
100%
A9 +
min: 58869     avg: 58977     median: 58976.5 (59%)     max: 59084 Points
64%
A7 +
37527 Points (38%)
AnTuTu v6 - AnTuTu v6 Total Score
100%
1 A9 +
min: 126969     avg: 129767     median: 128706 (44%)     max: 133626 Points
PassMark PerformanceTest Mobile V1 - PerformanceTest Mobile V1 CPU Tests
100%
A9 +
min: 46285     avg: 48479     median: 48849 (6%)     max: 49934 Points
73%
A7 +
min: 35280     avg: 36317     median: 35725.5 (5%)     max: 38536 Points

Average Benchmarks Apple A9 → 100% n=10

Average Benchmarks Apple A7 → 58% n=10

- Range of benchmark values for this graphics card
red legend - Average benchmark values for this graphics card
* Smaller numbers mean a higher performance
1 This benchmark is not used for the average calculation

Add one or more devices and compare

In the following list you can select (and also search for) devices that should be added to the comparison. You can select more than one device.

restrict list:
v1.35
log 20. 22:04:18

#0 ran 0s before starting gpusingle class +0s ... 0s

#1 checking url part for id 7085 +0s ... 0s

#2 checking url part for id 4635 +0s ... 0s

#3 redirected to Ajax server, took 1766264658s time from redirect:0 +0s ... 0s

#4 did not recreate cache, as it is less than 5 days old! Created at Fri, 19 Dec 2025 14:52:30 +0100 +0s ... 0s

#5 composed specs +0.004s ... 0.004s

#6 did output specs +0s ... 0.004s

#7 getting avg benchmarks for device 7085 +0.001s ... 0.004s

#8 got single benchmarks 7085 +0.005s ... 0.009s

#9 getting avg benchmarks for device 4635 +0.001s ... 0.01s

#10 got single benchmarks 4635 +0.005s ... 0.015s

#11 got avg benchmarks for devices +0s ... 0.015s

#12 min, max, avg, median took s +0.015s ... 0.03s

#13 return log +0s ... 0.03s

Please share our article, every link counts!
Mail Logo
Google Logo Add as a preferred
source on Google
> Expert Reviews and News on Laptops, Smartphones and Tech Innovations > Benchmarks / Tech > Processor Comparison - Head 2 Head
Redaktion, 2017-09- 8 (Update: 2023-07- 1)