Notebookcheck Logo

Apple A14 Bionic vs Apple M1 Max vs Apple M1 Pro

Apple A14 Bionic

► remove from comparison Apple A14

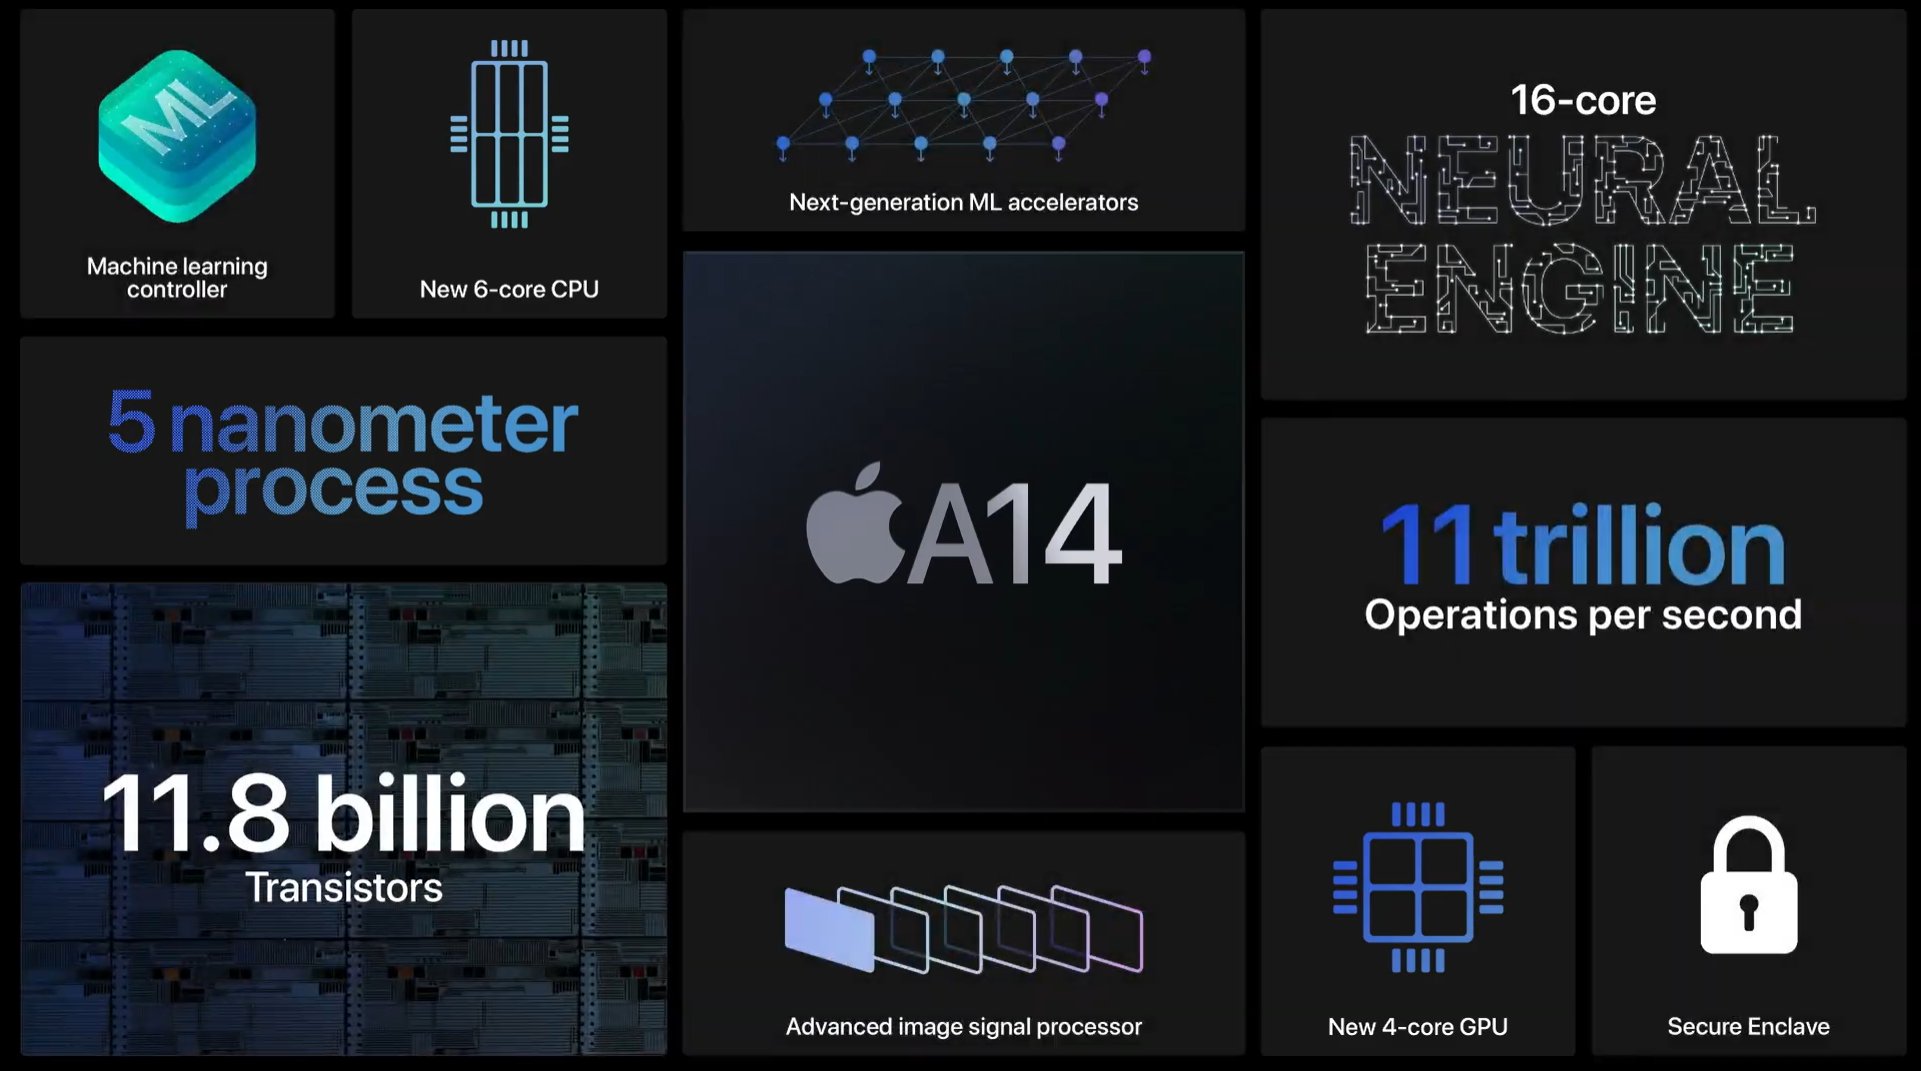
The Apple A14 Bionic is a System on a Chip (SoC) from Apple that is found in the iPhone 12 and iPad Air (2020) models. It was announced late 2020 and offers 6 cores divided in 2 performance cores (Firestorm) and four power efficiency cores (Icestorm). Apple states that the A14 offers a 40 percent higher CPU performance than the old A12 in the iPad Air 2019. That should translate to a modest gain of around 20% compared to the Apple A13. The A14 integrates a fast 4-core-GPU and a 16-core Neural Engine that is able to reach a maximum of 11 TOPS. The memory controller supports LPDDR4X and 4 or 6 GB are directly above the chip (package on package - PoP).

The chip is manufactured in 5nm and integrates 11.8 billion transistors.

Apple M1 Max

► remove from comparison Apple M1 Max

The Apple M1 Max is a System on a Chip (SoC) from Apple that is found in the late 2021 MacBook Pro 14 and 16-inch models. It offers all 10 cores available in the chip divided in eight performance cores (P-cores with 600 - 3220 MHz) and two power-efficiency cores (E-cores with 600 - 2064 MHz). There is no Turbo Boost for single cores or short burst periods. The cores are similar to the cores in the Apple M1.

The big cores (codename Firestorm) offer 192 KB instruction cache, 128 KB data cache, and 24 MB shared L2 cache (up from 12 MB in the M1). The four efficiency cores (codename Icestorm) are a lot smaller and offer only 128 KB instruction cache, 64 KB data cache, and 4 MB shared cache. CPU and GPU can both use the 48 MB SLC (System Level Cache). The efficiency cores (E cluster) clock with 600 - 2064 MHz, the performance cores (P cluster) with 600 - 3228 MHz.

The unified memory (32 or 64 GB LPDDR5-6400) next to the chip is connected by a 512 bit memory controller (200 GB/s bandwidth) and can be used by the GPU and CPU. This is the main difference to the M1 Pro and the CPU performance is quite similar.

The biggest difference to the M1 Pro is the bigger integrated GPU with 24 or 32 cores (up from 16).

Furthermore, the SoC integrates a fast 16 core neural engine, a secure enclave (e.g., for encryption), a unified memory architecture, Thunderbolt 4 controller, an ISP, and media de- and encoders (including two ProRes engines).

The M1 Pro is manufactured in 5 nm at TSMC and integrates 57 billion transistors. The peak power consumption of the chip was advertised around 30W for CPU intensive tasks. 

Apple M1 Pro

► remove from comparison Apple M1 Pro

The Apple M1 Pro is a System on a Chip (SoC) from Apple that is found in the late 2021 MacBook Pro 14 and 16-inch models. It offers  all 10 cores available in the chip divided in eight performance cores (P-cores with 600 - 3220 MHz) and two power-efficiency cores (E-cores with 600 - 2064 MHz). There is no Turbo Boost for single cores or short burst periods. The cores are similar to the cores in the Apple M1. The entry level model offers only 8 cores.

The big cores (codename Firestorm) offer 192 KB instruction cache, 128 KB data cache, and 24 MB shared L2 cache (up from 12 MB in the M1). The four efficiency cores (codename Icestorm) are a lot smaller and offer only 128 KB instruction cache, 64 KB data cache, and 4 MB shared cache. CPU and GPU can both use the 24 MB SLC (System Level Cache). The efficiency cores (E cluster) clock with 600 - 2064 MHz, the performance cores (P cluster) with 600 - 3228 MHz.

The unified memory (16 or 32 GB LPDDR5-6400) next to the chip is connected by a 256 bit memory controller (200 GB/s bandwidth) and can be used by the GPU and CPU.

The integrated graphics card in the M1 Pro offers all 16 cores.

Furthermore, the SoC integrates a fast 16 core neural engine, a secure enclave (e.g., for encryption), a unified memory architecture, Thunderbolt 4 controller, an ISP, and media de- and encoders (including ProRes).

The M1 Pro is manufactured in 5 nm at TSMC and integrates 33.7 billion transistors. The peak power consumption of the chip was advertised around 30W for CPU intensive tasks. In the Prime95 benchmark the chip uses in our tests (with a MBP16) 33.6W package power and 31W for the CPU part. In idle the SoC only reports 1W package power.

ModelApple A14 BionicApple M1 MaxApple M1 Pro
CodenameFirestorm, Icestorm
SeriesApple Apple A-SeriesApple M1Apple M1
Clock1800 - 3100 MHz2060 - 3220 MHz2064 - 3220 MHz
L2 Cache12 MB28 MB28 MB
L3 Cache16 MB48 MB24 MB
Cores / Threads6 / 610 / 1010 / 10
Transistors11800 Million57000 Million33700 Million
Technology5 nm5 nm5 nm
FeaturesARMv8 Instruction Set, Machine Learning Controller, 16-Core Neural Engine, Secure Enclave, Advanced Image Signal ProcessorARMv8 Instruction SetARMv8 Instruction Set
iGPUApple A14 Bionic GPUApple M1 Max 32-Core GPUApple M1 Pro 16-Core GPU
NPU / AI11 TOPS INT8
ArchitectureARMARMARM
Announced
Series: M1
Apple M1 Max « 2.06 - 3.22 GHz10 / 10 cores48 MB L3
Apple M1 Pro2.06 - 3.22 GHz10 / 10 cores24 MB L3
Apple M1 Pro 8-Core2.06 - 3.22 GHz8 / 8 cores16 MB L3
Apple M12.06 - 3.22 GHz8 / 8 cores8 MB L3
Apple M1 Max2.06 - 3.22 GHz10 / 10 cores48 MB L3
Apple M1 Pro « 2.06 - 3.22 GHz10 / 10 cores24 MB L3
Apple M1 Pro 8-Core2.06 - 3.22 GHz8 / 8 cores16 MB L3
Apple M12.06 - 3.22 GHz8 / 8 cores8 MB L3
L1 Cache2.9 MB2.9 MB
Chip AI11 TOPS INT811 TOPS INT8

Benchmarks

Cinebench 2024 - Cinebench 2024 CPU Single Core
100%
1 M1 Pro +
112 Points (56%)
Cinebench 2024 - Cinebench 2024 CPU Multi Core
100%
1 M1 Pro +
824 Points (15%)
Cinebench R23 - Cinebench R23 Multi Core
100%
1 M1 Max +
min: 12385     avg: 12389     median: 12386 (12%)     max: 12396 Points
100%
1 M1 Pro +
12370 Points (11%)
Cinebench R23 - Cinebench R23 Single Core
100%
1 M1 Max +
min: 1530     avg: 1533     median: 1533 (62%)     max: 1536 Points
100%
1 M1 Pro +
1534 Points (62%)
Cinebench R20 - Cinebench R20 CPU (Single Core)
100%
1 M1 Max +
min: 390     avg: 393.3     median: 395 (43%)     max: 395 Points
99%
1 M1 Pro +
393 Points (43%)
Cinebench R20 - Cinebench R20 CPU (Multi Core)
100%
1 M1 Max +
min: 2735     avg: 2746     median: 2750 (7%)     max: 2753 Points
99%
1 M1 Pro +
2721 Points (7%)
Cinebench R15 - Cinebench R15 CPU Multi 64 Bit
100%
1 M1 Max +
min: 1689     avg: 1691     median: 1691 (11%)     max: 1693 Points
100%
1 M1 Pro +
1690 Points (11%)
Cinebench R15 - Cinebench R15 CPU Single 64 Bit
100%
1 M1 Max +
min: 197     avg: 202.3     median: 200 (55%)     max: 210 Points
105%
1 M1 Pro +
209 Points (58%)
Blender - Blender 2.79 BMW27 CPU *
100%
1 M1 Max +
min: 187     avg: 188.7     median: 189 (1%)     max: 190 Seconds
103%
1 M1 Pro +
183.3 Seconds (1%)
3DMark - 3DMark Ice Storm Unlimited Physics
100%
1 A14 +
min: 38650     avg: 39042     median: 39161.5 (31%)     max: 39194 Points
3DMark - 3DMark Sling Shot Extreme (ES 3.1) Unlimited Physics
100%
1 A14 +
min: 2631     avg: 2892     median: 2890 (27%)     max: 3187 Points
3DMark - 3DMark Sling Shot (ES 3.0) Unlimited Physics
100%
1 A14 +
min: 2622     avg: 2953     median: 3053 (35%)     max: 3084 Points
Geekbench 6.5 - Geekbench 6.5 Single-Core
100%
A14 +
2171 Points (50%)
2442 Points (56%)
2409 Points (56%)
Geekbench 6.5 - Geekbench 6.5 Multi-Core
100%
A14 +
5064 Points (20%)
12994 Points (50%)
12440 Points (48%)
Geekbench 6.0 - Geekbench 6.0 Single-Core
100%
1 M1 Max +
2319 Points (74%)
104%
1 M1 Pro +
2405 Points (76%)
Geekbench 6.0 - Geekbench 6.0 Multi-Core
100%
1 M1 Max +
12456 Points (51%)
99%
1 M1 Pro +
12277 Points (50%)
Geekbench 5.5 - Geekbench 5.1 - 5.5 64 Bit Single-Core
100%
A14 +
min: 1326     avg: 1549     median: 1588.5 (53%)     max: 1604 Points
min: 1764     avg: 1785     median: 1788.5 (60%)     max: 1798 Points
1768 Points (59%)
Geekbench 5.5 - Geekbench 5.1 - 5.5 64 Bit Multi-Core
100%
A14 +
min: 3476     avg: 4019     median: 4093.5 (7%)     max: 4334 Points
min: 12563     avg: 12697     median: 12702.5 (23%)     max: 12818 Points
12499 Points (22%)
Mozilla Kraken 1.1 - Kraken 1.1 Total Score *
100%
A14 +
min: 459.6     avg: 476.6     median: 462.8 (1%)     max: 547 ms
min: 404.3     avg: 459.2     median: 482.3 (1%)     max: 491.1 ms
405.4 ms (0%)
Sunspider - Sunspider 1.0 Total Score *
100%
1 A14 +
min: 85.6     avg: 85.9     median: 85.9 (1%)     max: 86.1 ms
114%
1 M1 Pro +
75.6 ms (1%)
Octane V2 - Octane V2 Total Score
100%
A14 +
min: 55710     avg: 58132     median: 58528 (39%)     max: 59963 Points
min: 66938     avg: 68647     median: 68029 (45%)     max: 70973 Points
66203 Points (44%)
WebXPRT 4 - WebXPRT 4 Score
100%
1 A14 +
147 Points (38%)
WebXPRT 3 - WebXPRT 3 Score
100%
A14 +
min: 191     avg: 196.3     median: 193.5 (35%)     max: 214 Points
min: 350     avg: 358.7     median: 360 (65%)     max: 366 Points
342 Points (61%)
AnTuTu v8 - AnTuTu v8 UX
100%
1 A14 +
min: 64361     avg: 86794     median: 91444 (76%)     max: 96435 Points
AnTuTu v8 - AnTuTu v8 MEM
100%
1 A14 +
min: 83561     avg: 98724     median: 98475 (79%)     max: 113467 Points
AnTuTu v8 - AnTuTu v8 GPU
100%
1 A14 +
min: 211292     avg: 242531     median: 240861 (44%)     max: 264957 Points
AnTuTu v8 - AnTuTu v8 CPU
100%
1 A14 +
min: 123814     avg: 152893     median: 149088 (54%)     max: 179419 Points
AnTuTu v8 - AnTuTu v8 Total Score
100%
1 A14 +
min: 510245     avg: 580942     median: 569468 (55%)     max: 647374 Points
Antutu v9 - AnTuTu v9 Total Score
100%
1 A14 +
min: 691084     avg: 725392     median: 708280 (34%)     max: 776812 Points
Antutu v9 - AnTuTu v9 CPU
100%
1 A14 +
min: 189239     avg: 198226     median: 194080 (48%)     max: 211360 Points
PassMark PerformanceTest Mobile V1 - PerformanceTest Mobile V1 CPU Tests
100%
1 A14 +
44785 Points (6%)
CrossMark - CrossMark Overall
100%
A14 +
min: 987     avg: 1002     median: 1000 (37%)     max: 1022 Points
min: 1586     avg: 1607     median: 1615 (60%)     max: 1621 Points
1556 Points (58%)
Power Consumption - Prime95 Power Consumption - external Monitor *
100%
1 M1 Max +
50.8 Watt (9%)
122%
1 M1 Pro +
41.5 Watt (7%)
Power Consumption - Cinebench R15 Multi Power Consumption - external Monitor *
100%
1 M1 Max +
53 Watt (10%)
110%
1 M1 Pro +
48.3 Watt (9%)
Power Consumption - Geekbench 5.5 Power Consumption 150cd *
100%
1 A14 +
7.3 Watt (3%)
37%
1 M1 Pro +
19.9 Watt (9%)
Power Consumption - Idle Power Consumption - external Monitor *
100%
1 M1 Max +
11.6 Watt (8%)
180%
1 M1 Pro +
6.4 Watt (4%)
Power Consumption - Idle Power Consumption 150cd 1min *
100%
1 A14 +
3.1 Watt (2%)
31%
1 M1 Pro +
9.9 Watt (7%)
Power Consumption - Power Efficiency - Cinebench R15 Multi external Monitor
100%
1 M1 Max +
31.9 Points per Watt (24%)
110%
1 M1 Pro +
35 Points per Watt (26%)

Average Benchmarks Apple A14 Bionic → 100% n=8

Average Benchmarks Apple M1 Max → 169% n=8

Average Benchmarks Apple M1 Pro → 167% n=8

- Range of benchmark values for this graphics card
red legend - Average benchmark values for this graphics card
* Smaller numbers mean a higher performance
1 This benchmark is not used for the average calculation

v1.34
log 02. 04:14:49

#0 ran 0s before starting gpusingle class +0s ... 0s

#1 checking url part for id 12759 +0s ... 0s

#2 checking url part for id 13843 +0s ... 0s

#3 checking url part for id 13845 +0s ... 0s

#4 redirected to Ajax server, took 1762053289s time from redirect:0 +0s ... 0s

#5 did not recreate cache, as it is less than 5 days old! Created at Sat, 01 Nov 2025 05:19:33 +0100 +0s ... 0s

#6 composed specs +0.005s ... 0.005s

#7 did output specs +0s ... 0.005s

#8 getting avg benchmarks for device 12759 +0.001s ... 0.006s

#9 got single benchmarks 12759 +0.007s ... 0.012s

#10 getting avg benchmarks for device 13843 +0.001s ... 0.013s

#11 got single benchmarks 13843 +0.005s ... 0.018s

#12 getting avg benchmarks for device 13845 +0.001s ... 0.018s

#13 got single benchmarks 13845 +0.004s ... 0.022s

#14 got avg benchmarks for devices +0s ... 0.022s

#15 min, max, avg, median took s +0.03s ... 0.052s

#16 return log +0s ... 0.052s

Please share our article, every link counts!
Mail Logo
> Expert Reviews and News on Laptops, Smartphones and Tech Innovations > Benchmarks / Tech > Processor Comparison - Head 2 Head
Redaktion, 2017-09- 8 (Update: 2023-07- 1)