Notebookcheck Logo

Apple A12X Bionic vs Apple A14 Bionic

Apple A12X Bionic

► remove from comparison Apple A12X Bionic

The Apple A12X Bionic is a System on a Chip (SoC) from Apple that is found in the iPad Pro 11 and 12.5-inch from 2018. It offers 8 cores divided in four performance cores and four power efficiency cores (up from the 6 cores in the A12 of the iPhone XS). Compared to the previous A10X in the old iPad Pro models, Apple advertises up to 95% higher performance of the CPU cores.

The chip also includes a new GPU with 7 cores, the M12 Motion co-processor and a Neural Engine with 8 cores for up to 5 trillion operations per second.

With 10 billion transistors (A12 6.9 billion), the A12X Bionic is a big chip especially compared to the Snapdragon 835 (3 Billion) or a Skylake desktop quad-core Soc (1.75 Billion).

Apple A14 Bionic

► remove from comparison Apple A14

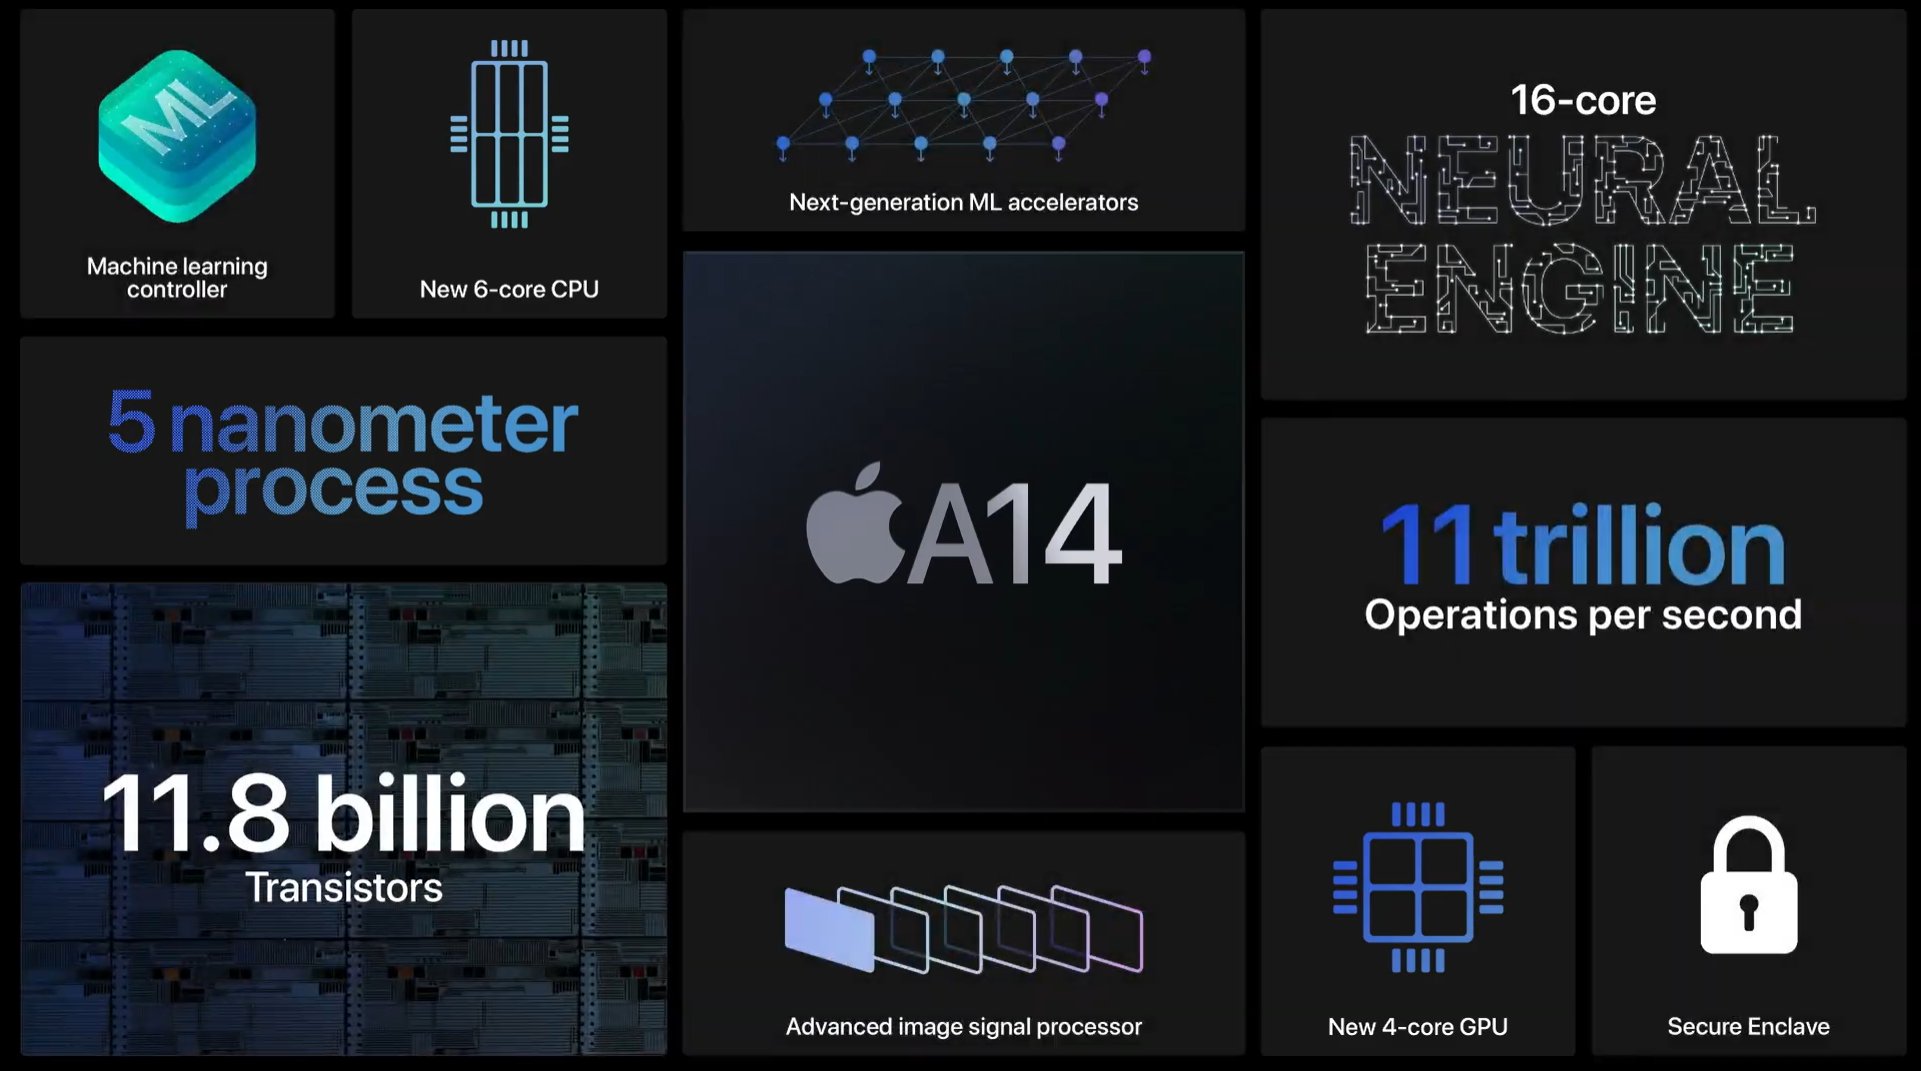
The Apple A14 Bionic is a System on a Chip (SoC) from Apple that is found in the iPhone 12 and iPad Air (2020) models. It was announced late 2020 and offers 6 cores divided in 2 performance cores (Firestorm) and four power efficiency cores (Icestorm). Apple states that the A14 offers a 40 percent higher CPU performance than the old A12 in the iPad Air 2019. That should translate to a modest gain of around 20% compared to the Apple A13. The A14 integrates a fast 4-core-GPU and a 16-core Neural Engine that is able to reach a maximum of 11 TOPS. The memory controller supports LPDDR4X and 4 or 6 GB are directly above the chip (package on package - PoP).

The chip is manufactured in 5nm and integrates 11.8 billion transistors.

ModelApple A12X BionicApple A14 Bionic
SeriesApple Apple A-SeriesApple Apple A-Series
CodenameVortex, TempestFirestorm / Icestorm
Series: Apple A-Series Vortex, Tempest
Apple A12Z Bionic compare - 2.49 GHz8 / 8 cores Vortex, Tempest
Apple A12X Bionic « - 2.49 GHz8 / 8 cores Vortex, Tempest
Clock <=2490 MHz1800 - 3100 MHz
L1 Cache2 MB
L2 Cache8 MB12 MB
Cores / Threads8 / 86 / 6
Transistors10000 Million11800 Million
Technology7 nm5 nm
FeaturesARMv8 Instruction SetARMv8 Instruction Set, Machine Learning Controller, 16-Core Neural Engine, Secure Enclave, Advanced Image Signal Processor
iGPUApple A12X Bionic GPUApple A14 Bionic GPU
ArchitectureARMARM
Announced
L3 Cache16 MB

Benchmarks

3DMark - 3DMark Ice Storm Unlimited Physics
39393 Points (33%)
99%
A14 +
min: 38650     avg: 39042     median: 39161.5 (33%)     max: 39194 Points
3DMark - 3DMark Sling Shot Extreme (ES 3.1) Unlimited Physics
100%
1 A14 +
min: 2631     avg: 2892     median: 2890 (34%)     max: 3187 Points
3DMark - 3DMark Sling Shot (ES 3.0) Unlimited Physics
4700 Points (54%)
65%
A14 +
min: 2622     avg: 2953     median: 3053 (35%)     max: 3084 Points
Geekbench 6.2 - Geekbench 6.2 Single-Core
1313 Points (40%)
Geekbench 6.2 - Geekbench 6.2 Multi-Core
4660 Points (18%)
Geekbench 5.5 - Geekbench 5.1 - 5.4 64 Bit Single-Core
1120 Points (47%)
142%
A14 +
min: 1326     avg: 1549     median: 1588.5 (67%)     max: 1604 Points
Geekbench 5.5 - Geekbench 5.1 - 5.4 64 Bit Multi-Core
4620 Points (8%)
89%
A14 +
min: 3476     avg: 4019     median: 4093.5 (7%)     max: 4334 Points
Geekbench 5.0 - Geekbench 5.0 64 Bit Single-Core
1114 Points (5%)
Geekbench 5.0 - Geekbench 5.0 64 Bit Multi-Core
4661 Points (15%)
Geekbench 4.4 - Geekbench 4.1 - 4.4 64 Bit Single-Core
min: 4984     avg: 4993     median: 4993 (50%)     max: 5002 Points
Geekbench 4.4 - Geekbench 4.1 - 4.4 64 Bit Multi-Core
min: 17691     avg: 17866     median: 17866 (20%)     max: 18041 Points
Mozilla Kraken 1.1 - Kraken 1.1 Total Score *
min: 603     avg: 609     median: 608.5 (1%)     max: 614 ms
100%
A14 +
min: 459.6     avg: 476.6     median: 462.8 (1%)     max: 547 ms
Sunspider - Sunspider 1.0 Total Score *
114 ms (1%)
100%
A14 +
min: 85.6     avg: 85.9     median: 85.9 (1%)     max: 86.1 ms
Octane V2 - Octane V2 Total Score
min: 44425     avg: 45080     median: 45079.5 (41%)     max: 45734 Points
130%
A14 +
min: 55710     avg: 58132     median: 58528 (53%)     max: 59963 Points
WebXPRT 4 - WebXPRT 4 Score
100%
1 A14 +
147 Points (42%)
WebXPRT 3 - WebXPRT 3 Score
min: 172     avg: 177     median: 177 (37%)     max: 182 Points
109%
A14 +
min: 191     avg: 196.3     median: 193.5 (40%)     max: 214 Points
AnTuTu v7 - AnTuTu v7 MEM
min: 14010     avg: 14312     median: 14311.5 (44%)     max: 14613 Points
AnTuTu v7 - AnTuTu v7 UX
min: 62524     avg: 64951     median: 64950.5 (80%)     max: 67377 Points
AnTuTu v7 - AnTuTu v7 GPU
min: 312218     avg: 317206     median: 317206 (98%)     max: 322193 Points
AnTuTu v7 - AnTuTu v7 CPU
min: 162798     avg: 163060     median: 163060 (100%)     max: 163321 Points
AnTuTu v7 - AnTuTu v7 Total Score
min: 552676     avg: 559527     median: 559527 (99%)     max: 566378 Points
AnTuTu v8 - AnTuTu v8 UX
76371 Points (64%)
120%
A14 +
min: 64361     avg: 86794     median: 91444 (76%)     max: 96435 Points
AnTuTu v8 - AnTuTu v8 MEM
63887 Points (52%)
154%
A14 +
min: 83561     avg: 98724     median: 98475 (79%)     max: 113467 Points
AnTuTu v8 - AnTuTu v8 GPU
350192 Points (64%)
69%
A14 +
min: 211292     avg: 242531     median: 240861 (44%)     max: 264957 Points
AnTuTu v8 - AnTuTu v8 CPU
187788 Points (68%)
79%
A14 +
min: 123814     avg: 152893     median: 149088 (54%)     max: 179419 Points
AnTuTu v8 - AnTuTu v8 Total Score
678238 Points (65%)
84%
A14 +
min: 510245     avg: 580942     median: 569468 (55%)     max: 647374 Points
Antutu v9 - AnTuTu v9 Total Score
100%
1 A14 +
min: 691084     avg: 725392     median: 708280 (43%)     max: 776812 Points
Antutu v9 - AnTuTu v9 CPU
100%
1 A14 +
min: 189239     avg: 198226     median: 194080 (53%)     max: 211360 Points
PassMark PerformanceTest Mobile V1 - PerformanceTest Mobile V1 CPU Tests
min: 756889     avg: 758432     median: 758432 (100%)     max: 759975 Points
44785 Points (6%)
CrossMark - CrossMark Overall
100%
1 A14 +
min: 987     avg: 1002     median: 1000 (38%)     max: 1022 Points
Power Consumption - Geekbench 5.5 Power Consumption 150cd *
8.5 Watt (4%)
101%
1 A14 +
7.3 Watt (3%)
Power Consumption - Idle Power Consumption 150cd 1min *
2.2 Watt (2%)
99%
1 A14 +
3.1 Watt (3%)

Average Benchmarks Apple A12X Bionic → 100% n=14

Average Benchmarks Apple A14 Bionic → 96% n=14

- Range of benchmark values for this graphics card
- Average benchmark values for this graphics card
* Smaller numbers mean a higher performance
1 This benchmark is not used for the average calculation

Add one or more devices and compare

In the following list you can select (and also search for) devices that should be added to the comparison. You can select more than one device.

restrict list:

show all (including archived), 2024, 2023
v1.26
log 25. 16:50:05

#0 checking url part for id 10881 +0s ... 0s

#1 checking url part for id 12759 +0s ... 0s

#2 not redirecting to Ajax server +0s ... 0s

#3 did not recreate cache, as it is less than 5 days old! Created at Thu, 25 Apr 2024 05:38:32 +0200 +0.001s ... 0.001s

#4 composed specs +0.012s ... 0.013s

#5 did output specs +0s ... 0.013s

#6 getting avg benchmarks for device 10881 +0.003s ... 0.016s

#7 got single benchmarks 10881 +0.009s ... 0.025s

#8 getting avg benchmarks for device 12759 +0.003s ... 0.028s

#9 got single benchmarks 12759 +0.015s ... 0.043s

#10 got avg benchmarks for devices +0s ... 0.043s

#11 min, max, avg, median took s +0.121s ... 0.164s

#12 return log +0.028s ... 0.192s

Please share our article, every link counts!
> Expert Reviews and News on Laptops, Smartphones and Tech Innovations > Benchmarks / Tech > Processor Comparison - Head 2 Head
Redaktion, 2017-09- 8 (Update: 2023-07- 1)