Notebookcheck Logo

Apple A10X Fusion vs Apple A14 Bionic

Apple A10X Fusion

► remove from comparison

The Apple A10X Fusion is a system on a chip (SoC) from Apple that is built into the 2017 iPad Pro models. It integrates six 64 Bit cores that are divided in two clusters. Three high performance cores are clocked at up to 2.39 GHz. The three power saving cores are used for non demanding tasks. It looks like only one of both clusters is able to run at a time (therefore the apps see only three cores). The principle is similar to the first generation of ARMs big.LITTLE concept.

The performance of the SoC is positioned in the high and and clearly faster than all previous Apple SoCs. Even compared to Android high-end SoCs like the Snapdragon 835, the A10X takes the lead (e.g. in Geekbench or Antutu).

The integrated graphics card of the SoC will most likely stem from PowerVR (again) and features 12 cores instead of 6 in the A10 SoC.

According to TechInsights, the A10X is manufactured in the brand new 10 nm FinFet process at TSMC. Altough it offers more function blocks, the A10X is with measured 96.4 mm2 significantly smaller than the previous A9X (143.9 mm2).

Apple A14 Bionic

► remove from comparison Apple A14

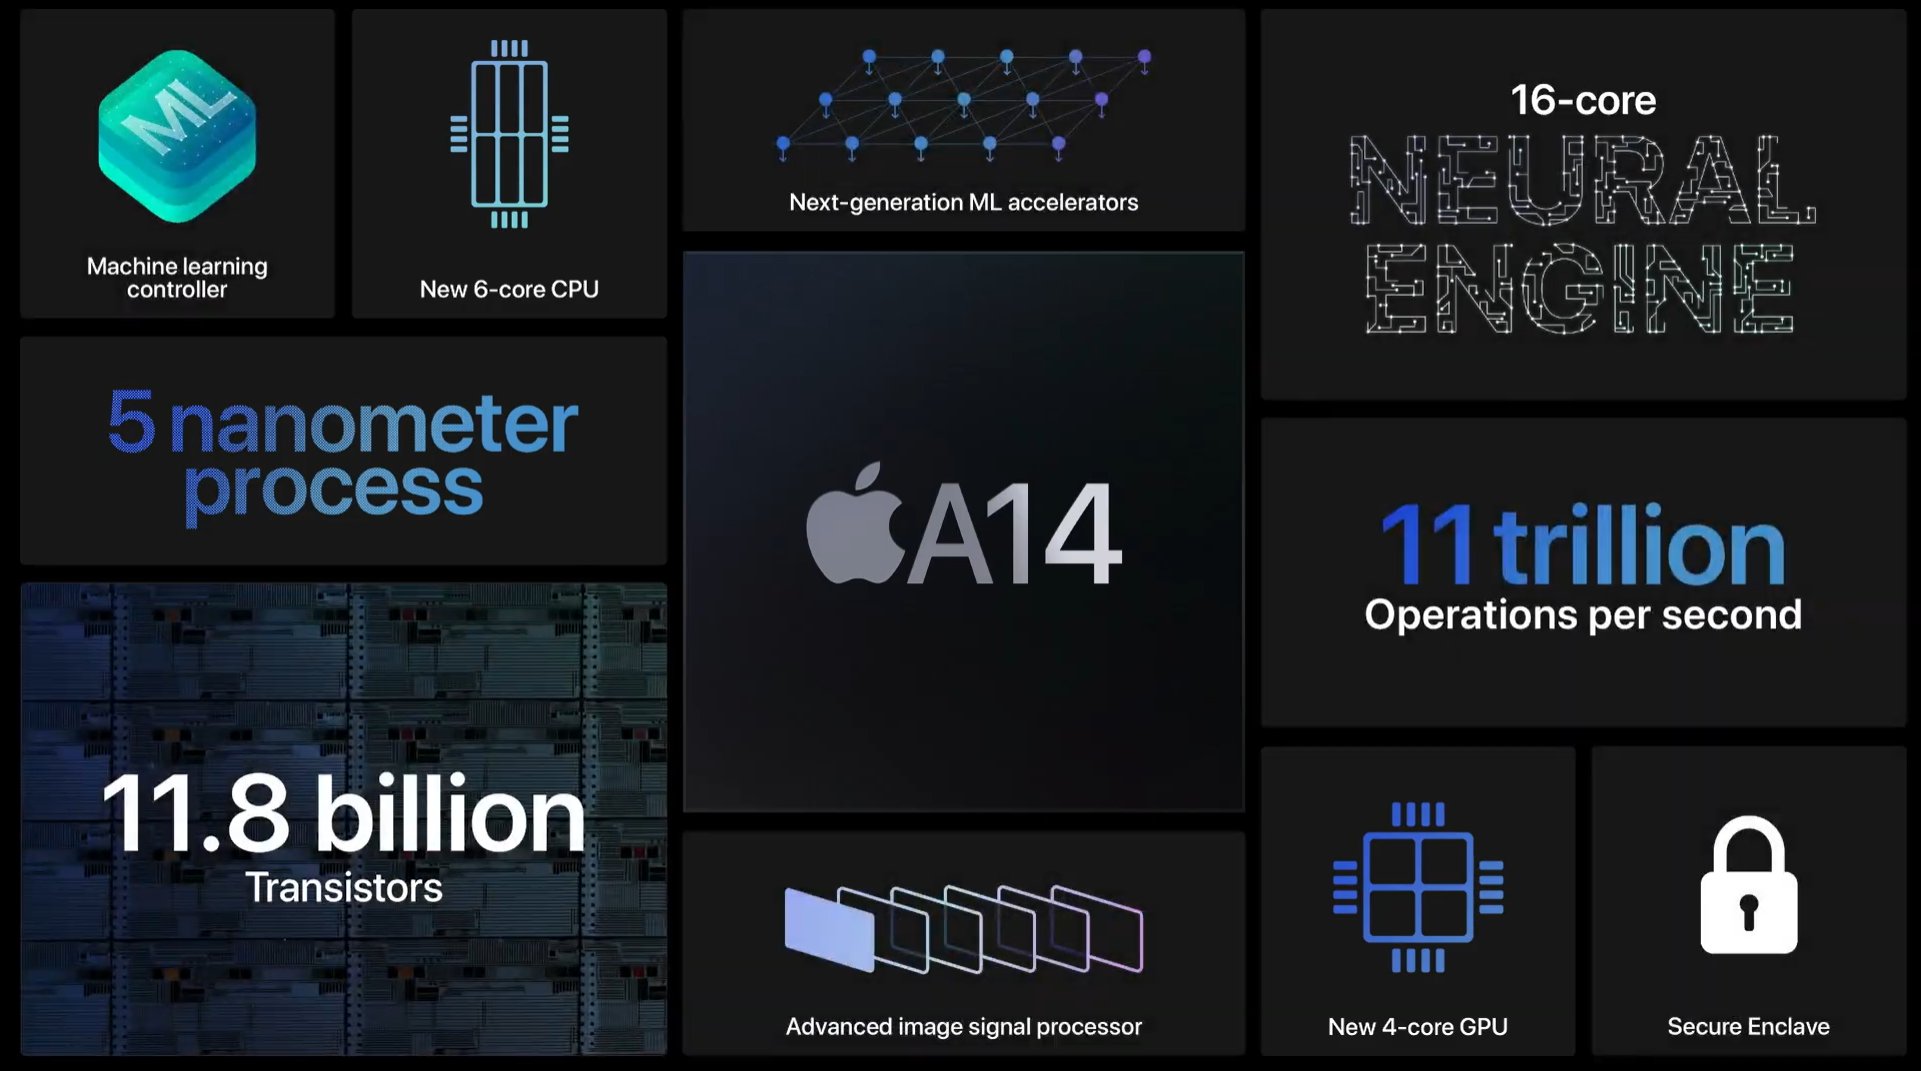
The Apple A14 Bionic is a System on a Chip (SoC) from Apple that is found in the iPhone 12 and iPad Air (2020) models. It was announced late 2020 and offers 6 cores divided in 2 performance cores (Firestorm) and four power efficiency cores (Icestorm). Apple states that the A14 offers a 40 percent higher CPU performance than the old A12 in the iPad Air 2019. That should translate to a modest gain of around 20% compared to the Apple A13. The A14 integrates a fast 4-core-GPU and a 16-core Neural Engine that is able to reach a maximum of 11 TOPS. The memory controller supports LPDDR4X and 4 or 6 GB are directly above the chip (package on package - PoP).

The chip is manufactured in 5nm and integrates 11.8 billion transistors.

ModelApple A10X FusionApple A14 Bionic
CodenameCyclone 4?Firestorm, Icestorm
SeriesApple Apple A-SeriesApple Apple A-Series
Clock2390 MHz1800 - 3100 MHz
Cores / Threads6 / 36 / 6
Transistors3300 Million11800 Million
Technology10 nm5 nm
FeaturesARMv8 Instruction SetARMv8 Instruction Set, Machine Learning Controller, 16-Core Neural Engine, Secure Enclave, Advanced Image Signal Processor
iGPUApple A10X Fusion GPU / PowerVRApple A14 Bionic GPU
ArchitectureARMARM
Announced
L2 Cache12 MB
L3 Cache16 MB
NPU / AI11 TOPS INT8

Benchmarks

3DMark - 3DMark Ice Storm Unlimited Physics
min: 19534     avg: 19551     median: 19550.5 (16%)     max: 19567 Points
200%
A14 +
min: 38650     avg: 39042     median: 39161.5 (31%)     max: 39194 Points
3DMark - 3DMark Sling Shot Extreme (ES 3.1) Unlimited Physics
min: 2036     avg: 2323     median: 2323 (22%)     max: 2610 Points
124%
A14 +
min: 2631     avg: 2892     median: 2890 (27%)     max: 3187 Points
3DMark - 3DMark Sling Shot (ES 3.0) Unlimited Physics
min: 2145     avg: 2370     median: 2369.5 (27%)     max: 2594 Points
129%
A14 +
min: 2622     avg: 2953     median: 3053 (35%)     max: 3084 Points
Geekbench 6.5 - Geekbench 6.5 Single-Core
965 Points (22%)
225%
A14 +
2171 Points (50%)
Geekbench 6.5 - Geekbench 6.5 Multi-Core
2375 Points (9%)
213%
A14 +
5064 Points (20%)
Geekbench 5.5 - Geekbench 5.1 - 5.5 64 Bit Single-Core
850 Points (29%)
187%
A14 +
min: 1326     avg: 1549     median: 1588.5 (53%)     max: 1604 Points
Geekbench 5.5 - Geekbench 5.1 - 5.5 64 Bit Multi-Core
2324 Points (4%)
176%
A14 +
min: 3476     avg: 4019     median: 4093.5 (7%)     max: 4334 Points
Geekbench 4.4 - Geekbench 4.1 - 4.4 64 Bit Single-Core
min: 3924     avg: 3929     median: 3928.5 (39%)     max: 3933 Points
Geekbench 4.4 - Geekbench 4.1 - 4.4 64 Bit Multi-Core
min: 9293     avg: 9326     median: 9325.5 (9%)     max: 9358 Points
Mozilla Kraken 1.1 - Kraken 1.1 Total Score *
min: 969     avg: 971     median: 971 (1%)     max: 973 ms
210%
A14 +
min: 459.6     avg: 476.6     median: 462.8 (1%)     max: 547 ms
Sunspider - Sunspider 1.0 Total Score *
100%
1 A14 +
min: 85.6     avg: 85.9     median: 85.9 (1%)     max: 86.1 ms
Octane V2 - Octane V2 Total Score
min: 30333     avg: 30761     median: 30760.5 (20%)     max: 31188 Points
190%
A14 +
min: 55710     avg: 58132     median: 58528 (39%)     max: 59963 Points
WebXPRT 4 - WebXPRT 4 Score
100%
1 A14 +
147 Points (38%)
WebXPRT 3 - WebXPRT 3 Score
100%
1 A14 +
min: 191     avg: 196.3     median: 193.5 (35%)     max: 214 Points
AnTuTu v6 - AnTuTu v6 Total Score
min: 217439     avg: 222713     median: 222713 (76%)     max: 227987 Points
AnTuTu v8 - AnTuTu v8 UX
100%
1 A14 +
min: 64361     avg: 86794     median: 91444 (76%)     max: 96435 Points
AnTuTu v8 - AnTuTu v8 MEM
100%
1 A14 +
min: 83561     avg: 98724     median: 98475 (79%)     max: 113467 Points
AnTuTu v8 - AnTuTu v8 GPU
100%
1 A14 +
min: 211292     avg: 242531     median: 240861 (44%)     max: 264957 Points
AnTuTu v8 - AnTuTu v8 CPU
100%
1 A14 +
min: 123814     avg: 152893     median: 149088 (54%)     max: 179419 Points
AnTuTu v8 - AnTuTu v8 Total Score
100%
1 A14 +
min: 510245     avg: 580942     median: 569468 (55%)     max: 647374 Points
Antutu v9 - AnTuTu v9 Total Score
100%
1 A14 +
min: 691084     avg: 725392     median: 708280 (34%)     max: 776812 Points
Antutu v9 - AnTuTu v9 CPU
100%
1 A14 +
min: 189239     avg: 198226     median: 194080 (48%)     max: 211360 Points
PassMark PerformanceTest Mobile V1 - PerformanceTest Mobile V1 CPU Tests
min: 82816     avg: 82838     median: 82837.5 (11%)     max: 82859 Points
54%
A14 +
44785 Points (6%)
CrossMark - CrossMark Overall
100%
1 A14 +
min: 987     avg: 1002     median: 1000 (37%)     max: 1022 Points
Power Consumption - Geekbench 5.5 Power Consumption 150cd *
100%
1 A14 +
7.3 Watt (3%)
Power Consumption - Idle Power Consumption 150cd 1min *
100%
1 A14 +
3.1 Watt (2%)

Average Benchmarks Apple A10X Fusion → 100% n=10

Average Benchmarks Apple A14 Bionic → 171% n=10

- Range of benchmark values for this graphics card
red legend - Average benchmark values for this graphics card
* Smaller numbers mean a higher performance
1 This benchmark is not used for the average calculation

Add one or more devices and compare

In the following list you can select (and also search for) devices that should be added to the comparison. You can select more than one device.

restrict list:
v1.35
log 12. 16:15:26

#0 ran 0s before starting gpusingle class +0s ... 0s

#1 checking url part for id 9162 +0s ... 0s

#2 checking url part for id 12759 +0s ... 0s

#3 redirected to Ajax server, took 1765552526s time from redirect:0 +0s ... 0s

#4 did not recreate cache, as it is less than 5 days old! Created at Wed, 10 Dec 2025 05:18:44 +0100 +0s ... 0s

#5 composed specs +0.003s ... 0.003s

#6 did output specs +0s ... 0.003s

#7 getting avg benchmarks for device 9162 +0.001s ... 0.004s

#8 got single benchmarks 9162 +0.005s ... 0.008s

#9 getting avg benchmarks for device 12759 +0.001s ... 0.009s

#10 got single benchmarks 12759 +0.006s ... 0.015s

#11 got avg benchmarks for devices +0s ... 0.015s

#12 min, max, avg, median took s +0.015s ... 0.029s

#13 return log +0s ... 0.03s

Please share our article, every link counts!
Mail Logo
> Expert Reviews and News on Laptops, Smartphones and Tech Innovations > Benchmarks / Tech > Processor Comparison - Head 2 Head
Redaktion, 2017-09- 8 (Update: 2023-07- 1)