 Deutsch
 English
 Español
 Français
 Italiano
 Nederlands
 Polski
 Português
 Русский
 Türkçe
 Svenska
 Chinese
 Magyar
Laptop, Smartphone, and Tablet Comparison
On this page you are able to compare test data and specifications from our reviews. Select a model using our search, the search box below or the compare link in our reviews (below the specs).
Asus GL702VM-GC102DAsus GL702VM-GC102D Notebook Review by Sascha Mölck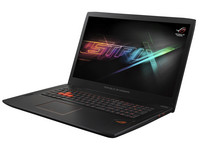 | Asus Strix GL753VD-GC045TAsus ROG Strix GL753VD Notebook Review by J. Simon Leitner | Asus GL702VM-GC017Tno links found | ||||||||||||||||||||||||||||||||||||||||||||||||||||
#436 Intel Core i7-6700HQ 8192 MB 1000 GB HDD 17.30-inch 1920x1080 2700 g 415 x 280 x 24 76 Wh 1399 Euro | #395 Intel Core i7-7700HQ » 91% #271 NVIDIA GeForce GTX 1050 Mobile » 146% 16384 MB » 200% 256 GB » 26% SSD 17.30-inch » 100% 1920x1080 » 100% 2940 g » 109% 416 x 274 x 32 » 131% 48 Wh » 63% Euro » 0% | #436 Intel Core i7-6700HQ » 100% #186 NVIDIA GeForce GTX 1060 Mobile » 100% 16384 MB » 200% GB » 0% unknown 17.30-inch » 100% 1920x1080 » 100% 2700 g » 100% 425 x 280 x 24 » 102% 76 Wh » 100% 1800 Euro » 129% | ||||||||||||||||||||||||||||||||||||||||||||||||||||
SpecificationsAsus GL702VM-GC102D (GL702 Series) Processor Intel Core i7-6700HQ 4 x 2.6 - 3.5 GHz (Intel Core i7) Graphics adapter NVIDIA GeForce GTX 1060 Mobile - 6 GB VRAM, Core: 1886 MHz, Memory: 2002 MHz, GDDR5, 192-bit connection, ForceWare 375.95 Memory 8 GB , DDR4-2132, Single-Channel, two RAM slots (one occupied) Display 17.30 inch 16:9, 1920 x 1080 pixel 127 PPI, LG Philips LP173WF4-SPF3, IPS, Nvidia G-Sync, glossy: no Mainboard Intel HM170 (Skylake PCH-H) Storage HGST Travelstar 7K1000 HTS721010A9E630, 1000 GB , 7200 rpm, 930 GB free Soundcard Realtek ALC255 @ Intel Sunrise Point PCH - High Definition Audio Controller Connections 3 USB 3.0 / 3.1 Gen1, 1 USB 3.1 Gen2, 1 Thunderbolt, 1 HDMI, 2 DisplayPort, 1 Kensington Lock, Audio Connections: Combo audio jack, Card Reader: SD, TPM 2.0 Networking Realtek RTL8168/8111 Gigabit-LAN (10/100/1000MBit/s), Intel Wireless-AC 7265 (a/b/g/n = Wi-Fi 4/ac = Wi-Fi 5/), Bluetooth 4.0 Size height x width x depth (in mm): 24 x 415 x 280 ( = 0.94 x 16.34 x 11.02 in) Battery 76 Wh Lithium-Ion Operating System FreeDos Camera Webcam: HD Additional features Speakers: Stereo, Keyboard: Chiclet, Keyboard Light: yes, Driver DVD, USB mouse, 24 Months Warranty Weight 2.7 kg ( = 95.24 oz / 5.95 pounds), Power Supply: 688 g ( = 24.27 oz / 1.52 pounds) Price 1399 Euro
| SpecificationsAsus Strix GL753VD-GC045T (Strix GL753 Series) Processor Intel Core i7-7700HQ 4 x 2.8 - 3.8 GHz, Kaby Lake Graphics adapter NVIDIA GeForce GTX 1050 Mobile - 4 GB VRAM, Core: 1354 MHz, Memory: 1752 MHz, GDDR5, 376.19, Optimus Memory 16 GB , DDR4 SDRAM Dual-Channel Display 17.30 inch 16:9, 1920 x 1080 pixel 127 PPI, LP173WF4-SPF3, LED IPS, glossy: no Mainboard Intel HM175 Storage Micron SSD 1100 (MTFDDAV256TBN), 256 GB , + Toshiba MQ01ABD100 1 TB HDD (2.5 inch) Soundcard HD Audio Connections 1 USB 2.0, 4 USB 3.0 / 3.1 Gen1, 1 HDMI, 1 DisplayPort, 1 Kensington Lock, Audio Connections: 3.5 mm Headset Combo, Card Reader: SD-card reader Networking Realtek RTL8168/8111 Gigabit-LAN (10/100/1000MBit/s), Intel Wireless-AC 7265 (a/b/g/n = Wi-Fi 4/ac = Wi-Fi 5/), Bluetooth 4.0 Optical drive HL-DT-ST DVDRAM GUE1N Size height x width x depth (in mm): 32 x 416 x 274 ( = 1.26 x 16.38 x 10.79 in) Battery 48 Wh Lithium-Ion Operating System Microsoft Windows 10 Home 64 Bit Camera Webcam: HD Webcam Additional features Speakers: Stereo, Keyboard: Chiclet, Keyboard Light: yes, 24 Months Warranty Weight 2.94 kg ( = 103.71 oz / 6.48 pounds) ( = 0 oz / 0 pounds)
| SpecificationsAsus GL702VM-GC017T (GL702 Series) Processor Intel Core i7-6700HQ 4 x 2.6 - 3.5 GHz (Intel Core i7) Graphics adapter Memory 16 GB , DDR4 Display 17.30 inch 16:9, 1920 x 1080 pixel 127 PPI, IPS, glossy: no Mainboard Intel HM170 (Skylake PCH-H) Storage HDD: 1TB + SSD: 512GB M.2 SATA/AHCI (2280/M-Key Slot, NVMe-Support) Connections 3 USB 3.0 / 3.1 Gen1, 1 USB 3.1 Gen2, 1 Thunderbolt, 1 HDMI, 1 DisplayPort, Audio Connections: 3.5mm combo, Card Reader: SD/SDHC/SDXC/MMC Networking 10/100/1000 LAN Card (10/100/1000MBit/s), 802.11 a/b/g/n/ac (a/b/g/n = Wi-Fi 4/ac = Wi-Fi 5/), Bluetooth 4.1 Size height x width x depth (in mm): 24 x 425 x 280 ( = 0.94 x 16.73 x 11.02 in) Battery 76 Wh Lithium-Polymer Operating System Microsoft Windows 10 Home 64 Bit Camera Webcam: HD Additional features Speakers: Stereo, Keyboard: Chiclet, Keyboard Light: yes, 12 Months Warranty Weight 2.7 kg ( = 95.24 oz / 5.95 pounds) ( = 0 oz / 0 pounds) Price 1800 Euro
| ||||||||||||||||||||||||||||||||||||||||||||||||||||
LG Philips LP173WF4-SPF3 tested with X-Rite i1Pro 2 Maximum: 326 cd/m² (Nits) Average: 311.9 cd/m² Minimum: 36 cd/m²Brightness Distribution: 91 % Center on Battery: 326 cd/m² Contrast: 652:1 (Black: 0.5 cd/m²) ΔE Color 6.3 | 0.5-29.43 Ø5 ΔE Greyscale 7.37 | 0.57-98 Ø5.3 83% sRGB (Argyll 1.6.3 3D) 55% AdobeRGB 1998 (Argyll 1.6.3 3D) 61.1% AdobeRGB 1998 (Argyll 2.2.0 3D) 83.5% sRGB (Argyll 2.2.0 3D) 65.1% Display P3 (Argyll 2.2.0 3D) Gamma: 2.37 |
LP173WF4-SPF3 tested with X-Rite i1Pro 2 Maximum: 349 cd/m² (Nits) Average: 337.2 cd/m² Minimum: 19.9 cd/m²Brightness Distribution: 91 % Center on Battery: 349 cd/m² Contrast: 602:1 (Black: 0.58 cd/m²) ΔE Color 4.5 | 0.5-29.43 Ø5 ΔE Greyscale 3.3 | 0.57-98 Ø5.3 75.7% sRGB (Argyll 1.6.3 3D) 55.7% AdobeRGB 1998 (Argyll 1.6.3 3D) 62% AdobeRGB 1998 (Argyll 2.2.0 3D) 84.8% sRGB (Argyll 2.2.0 3D) 67.1% Display P3 (Argyll 2.2.0 3D) Gamma: 2.15 |
No Illumination data found for specs ID 36655 or illumination item with ID
| ||||||||||||||||||||||||||||||||||||||||||||||||||||
ERROR no Specs ID specified in element or header and also no heat ID found in element
|
ERROR no Specs ID specified in element or header and also no heat ID found in element
|
ERROR no Specs ID specified in element or header and also no heat ID found in element
| ||||||||||||||||||||||||||||||||||||||||||||||||||||
Noise Level
| Noise Level
|
No Loudness Data found for specs ID 36655
| ||||||||||||||||||||||||||||||||||||||||||||||||||||
Power Consumption
| Power Consumption
|
Warning: No power consumption data found
| ||||||||||||||||||||||||||||||||||||||||||||||||||||
Asus GL702VM-GC102D
-
12/05/2016 v5.1(old)
Gaming - Weighted Average
|
Asus Strix GL753VD-GC045T
-
12/29/2016 v6(old)
Gaming - Weighted Average
| No, or more than one (0) Rating for the given SpecsID 36655 found | ||||||||||||||||||||||||||||||||||||||||||||||||||||
|
| No Pro / Contra Data found for specs ID 36655 | ||||||||||||||||||||||||||||||||||||||||||||||||||||
CrystalDiskMark 3.0 Write 4k QD32: 1.186 MB/s | CrystalDiskMark 3.0 Write 4k QD32: 234.9 MB/s » 19806% | |||||||||||||||||||||||||||||||||||||||||||||||||||||
CrystalDiskMark 3.0 Read 4k QD32: 1.106 MB/s | CrystalDiskMark 3.0 Read 4k QD32: 247.6 MB/s » 22387% | |||||||||||||||||||||||||||||||||||||||||||||||||||||
CrystalDiskMark 3.0 Write 4k: 1.146 MB/s | CrystalDiskMark 3.0 Write 4k: 76.8 MB/s » 6702% | |||||||||||||||||||||||||||||||||||||||||||||||||||||
CrystalDiskMark 3.0 Read 4k: 0.602 MB/s | CrystalDiskMark 3.0 Read 4k: 24.7 MB/s » 4103% | |||||||||||||||||||||||||||||||||||||||||||||||||||||
CrystalDiskMark 3.0 Write 512: 63.3 MB/s | CrystalDiskMark 3.0 Write 512: 346.6 MB/s » 548% | |||||||||||||||||||||||||||||||||||||||||||||||||||||
CrystalDiskMark 3.0 Read 512: 44.85 MB/s | CrystalDiskMark 3.0 Read 512: 336.1 MB/s » 749% | |||||||||||||||||||||||||||||||||||||||||||||||||||||
CrystalDiskMark 3.0 Write Seq: 130.6 MB/s | CrystalDiskMark 3.0 Write Seq: 419.1 MB/s » 321% | |||||||||||||||||||||||||||||||||||||||||||||||||||||
CrystalDiskMark 3.0 Read Seq: 134.6 MB/s | CrystalDiskMark 3.0 Read Seq: 475.7 MB/s » 353% | |||||||||||||||||||||||||||||||||||||||||||||||||||||
HD Tune Transfer Rate Minimum Transfer Rate Minimum: 52.7 MB/s | ||||||||||||||||||||||||||||||||||||||||||||||||||||||
HD Tune Transfer Rate Maximum Transfer Rate Maximum: 137.9 MB/s | ||||||||||||||||||||||||||||||||||||||||||||||||||||||
HD Tune Transfer Rate Average Transfer Rate Average: 104.7 MB/s | ||||||||||||||||||||||||||||||||||||||||||||||||||||||
HD Tune Access Time Access Time: 17.4 ms* | ||||||||||||||||||||||||||||||||||||||||||||||||||||||
HD Tune Burst Rate Burst Rate: 92.8 MB/s | ||||||||||||||||||||||||||||||||||||||||||||||||||||||
HD Tune CPU Utilization CPU Usage: 2.6 %* | ||||||||||||||||||||||||||||||||||||||||||||||||||||||
3DMark 06 Standard Score: 19244 Points | 3DMark 06 Standard Score: 27411 Points » 142% | |||||||||||||||||||||||||||||||||||||||||||||||||||||
3DMark 06 - CPU CPU Score: 7094 Points | ||||||||||||||||||||||||||||||||||||||||||||||||||||||
Cinebench R10 Shading 32Bit: 8238 | ||||||||||||||||||||||||||||||||||||||||||||||||||||||
Cinebench R10 Rendering Multiple CPUs 32Bit: 20111 | ||||||||||||||||||||||||||||||||||||||||||||||||||||||
Cinebench R10 Rendering Single 32Bit: 5126 | ||||||||||||||||||||||||||||||||||||||||||||||||||||||
Cinebench R10 Shading 64Bit: 4762 Points | ||||||||||||||||||||||||||||||||||||||||||||||||||||||
Cinebench R10 Rendering Multiple CPUs 64Bit: 28714 Points | ||||||||||||||||||||||||||||||||||||||||||||||||||||||
Cinebench R10 Rendering Single CPUs 64Bit: 7445 Points | ||||||||||||||||||||||||||||||||||||||||||||||||||||||
Peacekeeper : 3126 Points | ||||||||||||||||||||||||||||||||||||||||||||||||||||||
Cinebench R15 CPU Single 64Bit: 134 Points | Cinebench R15 CPU Single 64Bit: 151 Points » 113% | |||||||||||||||||||||||||||||||||||||||||||||||||||||
Cinebench R15 CPU Multi 64Bit: 678 Points | Cinebench R15 CPU Multi 64Bit: 741 Points » 109% | |||||||||||||||||||||||||||||||||||||||||||||||||||||
Cinebench R15 OpenGL 64Bit: 74 fps | Cinebench R15 OpenGL 64Bit: 113.9 fps » 154% | |||||||||||||||||||||||||||||||||||||||||||||||||||||
Cinebench R15 Ref. Match 64Bit: 99.6 % | ||||||||||||||||||||||||||||||||||||||||||||||||||||||
Cinebench R11.5 CPU Single 64Bit: 1.5 Points | Cinebench R11.5 CPU Single 64Bit: 1.72 Points » 115% | |||||||||||||||||||||||||||||||||||||||||||||||||||||
Cinebench R11.5 CPU Multi 64Bit: 7.47 Points | Cinebench R11.5 CPU Multi 64Bit: 8.14 Points » 109% | |||||||||||||||||||||||||||||||||||||||||||||||||||||
Cinebench R11.5 OpenGL 64Bit: 61 fps | Cinebench R11.5 OpenGL 64Bit: 66.1 fps » 108% | |||||||||||||||||||||||||||||||||||||||||||||||||||||
3DMark 11 Performance Combined: 6525 Points | 3DMark 11 Performance Combined: 7059 Points » 108% | |||||||||||||||||||||||||||||||||||||||||||||||||||||
3DMark 11 Performance Physics: 6850 Points | 3DMark 11 Performance Physics: 8910 Points » 130% | |||||||||||||||||||||||||||||||||||||||||||||||||||||
3DMark 11 Performance GPU: 14317 Points | 3DMark 11 Performance GPU: 7360 Points » 51% | |||||||||||||||||||||||||||||||||||||||||||||||||||||
3DMark 11 Performance: 11159 Points | 3DMark 11 Performance: 7524 Points » 67% | |||||||||||||||||||||||||||||||||||||||||||||||||||||
PCMark 7 System Storage: 1906 Points | ||||||||||||||||||||||||||||||||||||||||||||||||||||||
PCMark 7 Computation: 21318 Points | ||||||||||||||||||||||||||||||||||||||||||||||||||||||
PCMark 7 Creativity: 7629 Points | ||||||||||||||||||||||||||||||||||||||||||||||||||||||
PCMark 7 Entertainment: 5382 Points | ||||||||||||||||||||||||||||||||||||||||||||||||||||||
PCMark 7 Productivity: 1995 Points | ||||||||||||||||||||||||||||||||||||||||||||||||||||||
PCMark 7 Lightweight: 2524 Points | ||||||||||||||||||||||||||||||||||||||||||||||||||||||
PCMark 7 Score: 4114 Points | ||||||||||||||||||||||||||||||||||||||||||||||||||||||
3DMark Time Spy CPU: 3375 Points | 3DMark Time Spy CPU: 4044 Points » 120% 3DMark Time Spy CPU: 3602 Points » 107% | |||||||||||||||||||||||||||||||||||||||||||||||||||||
3DMark Time Spy Graphics: 3567 Points | 3DMark Time Spy Graphics: 1556 Points » 44% 3DMark Time Spy Graphics: 1521 Points » 43% | |||||||||||||||||||||||||||||||||||||||||||||||||||||
3DMark Time Spy Score: 3536 Points | 3DMark Time Spy Score: 1714 Points » 48% 3DMark Time Spy Score: 1665 Points » 47% | |||||||||||||||||||||||||||||||||||||||||||||||||||||
3DMark Fire Strike Ultra Combined: 1361 Points | 3DMark Fire Strike Ultra Combined: 633 Points » 47% | |||||||||||||||||||||||||||||||||||||||||||||||||||||
3DMark Fire Strike Ultra Physics: 9454 Points | 3DMark Fire Strike Ultra Physics: 9164 Points » 97% | |||||||||||||||||||||||||||||||||||||||||||||||||||||
3DMark Fire Strike Ultra Graphics: 2593 Points | 3DMark Fire Strike Ultra Graphics: 1061 Points » 41% | |||||||||||||||||||||||||||||||||||||||||||||||||||||
3DMark Fire Strike Ultra Score: 2641 Points | 3DMark Fire Strike Ultra Score: 1134 Points » 43% | |||||||||||||||||||||||||||||||||||||||||||||||||||||
3DMark Fire Strike Extreme Combined: 2349 Points | 3DMark Fire Strike Extreme Combined: 1192 Points » 51% 3DMark Fire Strike Extreme Combined: 1135 Points » 48% | |||||||||||||||||||||||||||||||||||||||||||||||||||||
3DMark Fire Strike Extreme Physics: 9332 Points | 3DMark Fire Strike Extreme Physics: 10806 Points » 116% 3DMark Fire Strike Extreme Physics: 9364 Points » 100% | |||||||||||||||||||||||||||||||||||||||||||||||||||||
3DMark Fire Strike Extreme Graphics: 5408 Points | 3DMark Fire Strike Extreme Graphics: 2577 Points » 48% 3DMark Fire Strike Extreme Graphics: 2459 Points » 45% | |||||||||||||||||||||||||||||||||||||||||||||||||||||
3DMark Fire Strike Extreme Score: 5067 Points | 3DMark Fire Strike Extreme Score: 2571 Points » 51% 3DMark Fire Strike Extreme Score: 2444 Points » 48% | |||||||||||||||||||||||||||||||||||||||||||||||||||||
3DMark Fire Strike Combined: 4247 Points | 3DMark Fire Strike Combined: 2209 Points » 52% 3DMark Fire Strike Combined: 2099 Points » 49% | |||||||||||||||||||||||||||||||||||||||||||||||||||||
3DMark Fire Strike Physics: 9278 Points | 3DMark Fire Strike Physics: 10747 Points » 116% 3DMark Fire Strike Physics: 9731 Points » 105% | |||||||||||||||||||||||||||||||||||||||||||||||||||||
3DMark Fire Strike Graphics: 11311 Points | 3DMark Fire Strike Graphics: 5784 Points » 51% 3DMark Fire Strike Graphics: 5421 Points » 48% | |||||||||||||||||||||||||||||||||||||||||||||||||||||
3DMark Fire Strike Score: 9432 Points | 3DMark Fire Strike Score: 5293 Points » 56% 3DMark Fire Strike Score: 4965 Points » 53% | |||||||||||||||||||||||||||||||||||||||||||||||||||||
3DMark Sky Diver Physics: 8385 Points | 3DMark Sky Diver Physics: 9927 Points » 118% | |||||||||||||||||||||||||||||||||||||||||||||||||||||
3DMark Sky Diver Graphics: 37413 Points | 3DMark Sky Diver Graphics: 18864 Points » 50% | |||||||||||||||||||||||||||||||||||||||||||||||||||||
3DMark Sky Diver Score: 22793 Points | 3DMark Sky Diver Score: 16655 Points » 73% | |||||||||||||||||||||||||||||||||||||||||||||||||||||
3DMark Cloud Gate Standard Physics: 6464 Points | 3DMark Cloud Gate Standard Physics: 7632 Points » 118% | |||||||||||||||||||||||||||||||||||||||||||||||||||||
3DMark Cloud Gate Standard Graphics: 79107 Points | 3DMark Cloud Gate Standard Graphics: 35884 Points » 45% | |||||||||||||||||||||||||||||||||||||||||||||||||||||
3DMark Cloud Gate Standard Score: 22619 Points | 3DMark Cloud Gate Standard Score: 19688 Points » 87% | |||||||||||||||||||||||||||||||||||||||||||||||||||||
3DMark Ice Storm Unlimited Physics: 44181 Points | 3DMark Ice Storm Unlimited Physics: 49232 Points » 111% | |||||||||||||||||||||||||||||||||||||||||||||||||||||
3DMark Ice Storm Unlimited Graphics Score: 263574 Points | 3DMark Ice Storm Unlimited Graphics Score: 274237 Points » 104% | |||||||||||||||||||||||||||||||||||||||||||||||||||||
3DMark Ice Storm Unlimited Score: 125302 Points | 3DMark Ice Storm Unlimited Score: 136055 Points » 109% | |||||||||||||||||||||||||||||||||||||||||||||||||||||
3DMark Ice Storm Extreme Physics: 43042 Points | ||||||||||||||||||||||||||||||||||||||||||||||||||||||
3DMark Ice Storm Extreme Graphics: 185998 Points | ||||||||||||||||||||||||||||||||||||||||||||||||||||||
3DMark Ice Storm Extreme Score: 107014 Points | ||||||||||||||||||||||||||||||||||||||||||||||||||||||
3DMark Ice Storm Standard Physics: 43151 Points | ||||||||||||||||||||||||||||||||||||||||||||||||||||||
3DMark Ice Storm Standard Graphics: 210372 Points | ||||||||||||||||||||||||||||||||||||||||||||||||||||||
3DMark Ice Storm Standard Score: 113032 Points | ||||||||||||||||||||||||||||||||||||||||||||||||||||||
3DMark Time Spy Stress Test: 97.9 % | ||||||||||||||||||||||||||||||||||||||||||||||||||||||
Mozilla Kraken 1.1 Total: 1082 ms* | ||||||||||||||||||||||||||||||||||||||||||||||||||||||
Geekbench 3 32 Bit Multi-Core Score: 11903 | ||||||||||||||||||||||||||||||||||||||||||||||||||||||
Geekbench 3 32 Bit Single-Core Score: 2926 | ||||||||||||||||||||||||||||||||||||||||||||||||||||||
Octane V2 Total Score: 34352 Points | ||||||||||||||||||||||||||||||||||||||||||||||||||||||
Geekbench 4.0 64 Bit Multi-Core Score: 11033 | ||||||||||||||||||||||||||||||||||||||||||||||||||||||
Geekbench 4.0 64 Bit Single-Core Score: 3663 | ||||||||||||||||||||||||||||||||||||||||||||||||||||||
Sunspider 1.0 Total Score: 79.5 ms* | ||||||||||||||||||||||||||||||||||||||||||||||||||||||
PCMark 8 Work Score Accelerated v2: 4809 Points | ||||||||||||||||||||||||||||||||||||||||||||||||||||||
PCMark 8 Creative Score Accelerated v2: 6361 Points | ||||||||||||||||||||||||||||||||||||||||||||||||||||||
PCMark 8 Home Score Accelerated v2: 4670 Points | PCMark 8 Home Score Accelerated v2: 4088 Points » 88% | |||||||||||||||||||||||||||||||||||||||||||||||||||||
JetStream 1.1 Total Score: 232.4 Points | ||||||||||||||||||||||||||||||||||||||||||||||||||||||
X-Plane 10.25 ultra (fps_test=4) test_flight_c4: 24.5 fps | ||||||||||||||||||||||||||||||||||||||||||||||||||||||
X-Plane 10.25 high (fps_test=3) test_flight_c4: 24.5 fps | ||||||||||||||||||||||||||||||||||||||||||||||||||||||
X-Plane 10.25 med (fps_test=2) test_flight_c4: 46.6 fps | ||||||||||||||||||||||||||||||||||||||||||||||||||||||
X-Plane 10.25 low (fps_test=1) test_flight_c4: 81.8 fps | ||||||||||||||||||||||||||||||||||||||||||||||||||||||
Middle-earth: Shadow of Mordor Ultra Preset (HD Package): 85.7 fps | ||||||||||||||||||||||||||||||||||||||||||||||||||||||
Middle-earth: Shadow of Mordor High Preset: 109 fps | ||||||||||||||||||||||||||||||||||||||||||||||||||||||
Middle-earth: Shadow of Mordor Medium Preset: 130.9 fps | ||||||||||||||||||||||||||||||||||||||||||||||||||||||
Middle-earth: Shadow of Mordor Lowest Preset: 147.5 fps | ||||||||||||||||||||||||||||||||||||||||||||||||||||||
GTA V Highest Settings possible: 48.2 fps | ||||||||||||||||||||||||||||||||||||||||||||||||||||||
GTA V High/On (Advanced Graphics Off): 90.3 fps | ||||||||||||||||||||||||||||||||||||||||||||||||||||||
GTA V Normal/Off: 117.7 fps | ||||||||||||||||||||||||||||||||||||||||||||||||||||||
GTA V Lowest Settings possible: 122.3 fps | ||||||||||||||||||||||||||||||||||||||||||||||||||||||
Ashes of the Singularity low: 51.2 fps | ||||||||||||||||||||||||||||||||||||||||||||||||||||||
Ashes of the Singularity Standard: 49.1 fps | Ashes of the Singularity Standard: 32.4 fps » 66% | |||||||||||||||||||||||||||||||||||||||||||||||||||||
Ashes of the Singularity high: 47.5 fps | Ashes of the Singularity high: 28.6 fps » 60% | |||||||||||||||||||||||||||||||||||||||||||||||||||||
Deus Ex Mankind Divided Ultra Preset: 27.3 fps | Deus Ex Mankind Divided Ultra Preset: 15.3 fps » 56% | |||||||||||||||||||||||||||||||||||||||||||||||||||||
Deus Ex Mankind Divided High Preset: 48.7 fps | Deus Ex Mankind Divided High Preset: 29.6 fps » 61% | |||||||||||||||||||||||||||||||||||||||||||||||||||||
Deus Ex Mankind Divided Medium Preset: 61.9 fps | Deus Ex Mankind Divided Medium Preset: 53.6 fps » 87% | |||||||||||||||||||||||||||||||||||||||||||||||||||||
Deus Ex Mankind Divided Low Preset: 65 fps | Deus Ex Mankind Divided Low Preset: 71.7 fps » 110% | |||||||||||||||||||||||||||||||||||||||||||||||||||||
Tomb Raider Ultra Preset: 138.4 fps | ||||||||||||||||||||||||||||||||||||||||||||||||||||||
Tomb Raider High Preset: 286.2 fps | ||||||||||||||||||||||||||||||||||||||||||||||||||||||
Tomb Raider Normal Preset: 325.4 fps | ||||||||||||||||||||||||||||||||||||||||||||||||||||||
Tomb Raider Low Preset: 344.9 fps | ||||||||||||||||||||||||||||||||||||||||||||||||||||||
BioShock Infinite Ultra Preset, DX11 (DDOF): 98.9 fps | ||||||||||||||||||||||||||||||||||||||||||||||||||||||
BioShock Infinite High Preset: 166.4 fps | ||||||||||||||||||||||||||||||||||||||||||||||||||||||
BioShock Infinite Medium Preset: 177.3 fps | ||||||||||||||||||||||||||||||||||||||||||||||||||||||
BioShock Infinite Very Low Preset: 195.1 fps | ||||||||||||||||||||||||||||||||||||||||||||||||||||||
Battlefield 4 Ultra Preset: 99.1 fps | ||||||||||||||||||||||||||||||||||||||||||||||||||||||
Battlefield 4 High Preset: 151.4 fps | ||||||||||||||||||||||||||||||||||||||||||||||||||||||
Battlefield 4 Medium Preset: 167.2 fps | ||||||||||||||||||||||||||||||||||||||||||||||||||||||
Battlefield 4 Low Preset: 180.1 fps | ||||||||||||||||||||||||||||||||||||||||||||||||||||||
FIFA 17 Ultra Preset: 197.9 fps | FIFA 17 Ultra Preset: 131 fps » 66% | |||||||||||||||||||||||||||||||||||||||||||||||||||||
FIFA 17 High Preset: 198.6 fps | FIFA 17 High Preset: 144 fps » 73% | |||||||||||||||||||||||||||||||||||||||||||||||||||||
FIFA 17 Medium Preset: 216.2 fps | FIFA 17 Medium Preset: 199 fps » 92% | |||||||||||||||||||||||||||||||||||||||||||||||||||||
FIFA 17 Low Preset: 232.7 fps | FIFA 17 Low Preset: 224 fps » 96% | |||||||||||||||||||||||||||||||||||||||||||||||||||||
Mafia 3 High Preset: 40.1 fps | Mafia 3 High Preset: 22 fps » 55% | |||||||||||||||||||||||||||||||||||||||||||||||||||||
Mafia 3 Medium Preset: 47.1 fps | Mafia 3 Medium Preset: 34.4 fps » 73% | |||||||||||||||||||||||||||||||||||||||||||||||||||||
Mafia 3 Low Preset: 51.3 fps | Mafia 3 Low Preset: 52.7 fps » 103% | |||||||||||||||||||||||||||||||||||||||||||||||||||||
Battlefield 1 Ultra Preset: 79 fps | Battlefield 1 Ultra Preset: 41.1 fps » 52% | |||||||||||||||||||||||||||||||||||||||||||||||||||||
Battlefield 1 High Preset: 87.4 fps | Battlefield 1 High Preset: 46.5 fps » 53% | |||||||||||||||||||||||||||||||||||||||||||||||||||||
Battlefield 1 Medium Preset: 104.9 fps | Battlefield 1 Medium Preset: 101.7 fps » 97% | |||||||||||||||||||||||||||||||||||||||||||||||||||||
Battlefield 1 Low Preset: 116.4 fps | Battlefield 1 Low Preset: 145.6 fps » 125% | |||||||||||||||||||||||||||||||||||||||||||||||||||||
Farming Simulator 17 Very High Preset: 153.9 fps | Farming Simulator 17 Very High Preset: 74 fps » 48% | |||||||||||||||||||||||||||||||||||||||||||||||||||||
Farming Simulator 17 High Preset: 165.1 fps | ||||||||||||||||||||||||||||||||||||||||||||||||||||||
Farming Simulator 17 Medium Preset: 179.6 fps | ||||||||||||||||||||||||||||||||||||||||||||||||||||||
Farming Simulator 17 Low Preset: 209.3 fps | ||||||||||||||||||||||||||||||||||||||||||||||||||||||
Farming Simulator 17 High Preset: 37.4 fps | ||||||||||||||||||||||||||||||||||||||||||||||||||||||
Titanfall 2 Very High (Insane Texture Quality) / Enabled: 80.2 fps | Titanfall 2 Very High (Insane Texture Quality) / Enabled: 61 fps » 76% | |||||||||||||||||||||||||||||||||||||||||||||||||||||
Titanfall 2 High / Enabled: 89.3 fps | Titanfall 2 High / Enabled: 60.7 fps » 68% | |||||||||||||||||||||||||||||||||||||||||||||||||||||
Titanfall 2 Medium / Disabled: 143 fps | Titanfall 2 Medium / Disabled: 81.5 fps » 57% | |||||||||||||||||||||||||||||||||||||||||||||||||||||
Titanfall 2 Low / Disabled: 143.4 fps | Titanfall 2 Low / Disabled: 130.6 fps » 91% | |||||||||||||||||||||||||||||||||||||||||||||||||||||
SD Card Reader JPG Copy Test (av. of 3 runs): 72.6 MB/s | SD Card Reader JPG Copy Test (av. of 3 runs): 76.3 MB/s » 105% | |||||||||||||||||||||||||||||||||||||||||||||||||||||
SD Card Reader AS SSD Seq Read Test (1GB): 84.6 MB/s | SD Card Reader AS SSD Seq Read Test (1GB): 85.8 MB/s » 101% | |||||||||||||||||||||||||||||||||||||||||||||||||||||
Battery Runtime WiFi Websurfing: 250 min | Battery Runtime WiFi Websurfing: 261 min » 104% | |||||||||||||||||||||||||||||||||||||||||||||||||||||
Response Times Response Time Grey 50% / Grey 80%: 38 ms* | Response Times Response Time Grey 50% / Grey 80%: 33.2 ms* » 87% | |||||||||||||||||||||||||||||||||||||||||||||||||||||
Response Times Response Time Black / White: 23 ms* | Response Times Response Time Black / White: 28.8 ms* » 125% | |||||||||||||||||||||||||||||||||||||||||||||||||||||
Response Times PWM Frequency: 0 Hz | Response Times PWM Frequency: 0 Hz | |||||||||||||||||||||||||||||||||||||||||||||||||||||
Emissions Fan Noise: 46.2 dB(A) | Emissions Fan Noise: 47.4 dB(A) » 103% | |||||||||||||||||||||||||||||||||||||||||||||||||||||
Loudspeakers Pink Noise: 64 dB(A) | Loudspeakers Pink Noise: 81.5 dB(A) » 127% | |||||||||||||||||||||||||||||||||||||||||||||||||||||
Networking iperf Server (receive) TCP 1 m: 665 MBit/s | ||||||||||||||||||||||||||||||||||||||||||||||||||||||
Networking iperf Client (transmit) TCP 1 m: 538 MBit/s | ||||||||||||||||||||||||||||||||||||||||||||||||||||||
Networking iperf3 receive AX12: 666 MBit/s | ||||||||||||||||||||||||||||||||||||||||||||||||||||||
Networking iperf3 transmit AX12: 543 MBit/s | ||||||||||||||||||||||||||||||||||||||||||||||||||||||
Display Display P3 Coverage: 65.1 % | Display Display P3 Coverage: 67.1 % » 103% | |||||||||||||||||||||||||||||||||||||||||||||||||||||
Display sRGB Coverage: 83.5 % | Display sRGB Coverage: 84.8 % » 102% | |||||||||||||||||||||||||||||||||||||||||||||||||||||
Display AdobeRGB 1998 Coverage: 61.1 % | Display AdobeRGB 1998 Coverage: 62 % » 101% | |||||||||||||||||||||||||||||||||||||||||||||||||||||
Super Pi mod 1.5 XS 1M 1M: 10.5 s* | ||||||||||||||||||||||||||||||||||||||||||||||||||||||
Super Pi mod 1.5 XS 2M 2M: 24.1 s* | ||||||||||||||||||||||||||||||||||||||||||||||||||||||
Super Pi Mod 1.5 XS 32M 32M: 553 s* | ||||||||||||||||||||||||||||||||||||||||||||||||||||||
AS SSD Copy Game MB/s: 278.6 MB/s | ||||||||||||||||||||||||||||||||||||||||||||||||||||||
AS SSD Copy Program MB/s: 214.6 MB/s | ||||||||||||||||||||||||||||||||||||||||||||||||||||||
AS SSD Copy ISO MB/s: 432 MB/s | ||||||||||||||||||||||||||||||||||||||||||||||||||||||
AS SSD Score Total: 858 Points | ||||||||||||||||||||||||||||||||||||||||||||||||||||||
AS SSD Score Write: 219 Points | ||||||||||||||||||||||||||||||||||||||||||||||||||||||
AS SSD Score Read: 241 Points | ||||||||||||||||||||||||||||||||||||||||||||||||||||||
AS SSD Access Time Write: 0.0163 ms* | ||||||||||||||||||||||||||||||||||||||||||||||||||||||
AS SSD Access Time Read: 0.141 ms* | ||||||||||||||||||||||||||||||||||||||||||||||||||||||
AS SSD 4K-64 Write: 115.1 MB/s | ||||||||||||||||||||||||||||||||||||||||||||||||||||||
AS SSD 4K-64 Read: 170.3 MB/s | ||||||||||||||||||||||||||||||||||||||||||||||||||||||
AS SSD 4K Write: 71 MB/s | ||||||||||||||||||||||||||||||||||||||||||||||||||||||
AS SSD 4K Read: 22.6 MB/s | ||||||||||||||||||||||||||||||||||||||||||||||||||||||
AS SSD Seq Write: 331.2 MB/s | ||||||||||||||||||||||||||||||||||||||||||||||||||||||
AS SSD Seq Read: 482.9 MB/s | ||||||||||||||||||||||||||||||||||||||||||||||||||||||
ComputeMark v2.1 Normal, QJuliaRayTrace: 1431 | ||||||||||||||||||||||||||||||||||||||||||||||||||||||
ComputeMark v2.1 Normal, Mandel Scalar: 913 | ||||||||||||||||||||||||||||||||||||||||||||||||||||||
ComputeMark v2.1 Normal, Mandel Vector: 972 | ||||||||||||||||||||||||||||||||||||||||||||||||||||||
ComputeMark v2.1 Normal, Fluid 2DTexArr: 524 | ||||||||||||||||||||||||||||||||||||||||||||||||||||||
ComputeMark v2.1 Normal, Fluid 3DTex: 517 | ||||||||||||||||||||||||||||||||||||||||||||||||||||||
ComputeMark v2.1 Normal, Score: 4356 | ||||||||||||||||||||||||||||||||||||||||||||||||||||||
LuxMark v2.0 64Bit Room GPUs-only: 954 Samples/s | ||||||||||||||||||||||||||||||||||||||||||||||||||||||
LuxMark v2.0 64Bit Sala GPUs-only: 1635 Samples/s | ||||||||||||||||||||||||||||||||||||||||||||||||||||||
Unigine Heaven 4.0 Extreme Preset OpenGL: 32.3 fps | ||||||||||||||||||||||||||||||||||||||||||||||||||||||
Unigine Heaven 4.0 Extreme Preset DX11: 34 fps | ||||||||||||||||||||||||||||||||||||||||||||||||||||||
VRMark Blue Room: 543 Points | ||||||||||||||||||||||||||||||||||||||||||||||||||||||
VRMark Orange Room: 2823 Points | ||||||||||||||||||||||||||||||||||||||||||||||||||||||
AIDA64 Memory Latency: 70 ns* | ||||||||||||||||||||||||||||||||||||||||||||||||||||||
AIDA64 Memory Copy: 29681 MB/s | ||||||||||||||||||||||||||||||||||||||||||||||||||||||
X264 HD Benchmark 4.0 Pass 2: 46.4 fps | ||||||||||||||||||||||||||||||||||||||||||||||||||||||
X264 HD Benchmark 4.0 Pass 1: 174 fps | ||||||||||||||||||||||||||||||||||||||||||||||||||||||
PCMark 10 Digital Content Creation: 3638 Points | ||||||||||||||||||||||||||||||||||||||||||||||||||||||
PCMark 10 Productivity: 6215 Points | ||||||||||||||||||||||||||||||||||||||||||||||||||||||
PCMark 10 Essentials: 6198 Points | ||||||||||||||||||||||||||||||||||||||||||||||||||||||
PCMark 10 Score: 3724 Points | ||||||||||||||||||||||||||||||||||||||||||||||||||||||
Metro: Last Light Very High (DX11): 40 fps | ||||||||||||||||||||||||||||||||||||||||||||||||||||||
Metro: Last Light High (DX11): 74 fps | ||||||||||||||||||||||||||||||||||||||||||||||||||||||
Rainbow Six Siege Ultra Preset: 58 fps | ||||||||||||||||||||||||||||||||||||||||||||||||||||||
Rainbow Six Siege High Preset: 71 fps | ||||||||||||||||||||||||||||||||||||||||||||||||||||||
Rainbow Six Siege Medium Preset: 133 fps | ||||||||||||||||||||||||||||||||||||||||||||||||||||||
Rainbow Six Siege Low Preset: 209 fps | ||||||||||||||||||||||||||||||||||||||||||||||||||||||
Far Cry Primal Ultra Preset: 30 fps | ||||||||||||||||||||||||||||||||||||||||||||||||||||||
Far Cry Primal High Preset: 41 fps | ||||||||||||||||||||||||||||||||||||||||||||||||||||||
Far Cry Primal Medium Preset: 47 fps | ||||||||||||||||||||||||||||||||||||||||||||||||||||||
Far Cry Primal Low Preset: 99 fps | ||||||||||||||||||||||||||||||||||||||||||||||||||||||
The Division Ultra Preset: 25.4 fps | ||||||||||||||||||||||||||||||||||||||||||||||||||||||
The Division High Preset: 33.2 fps | ||||||||||||||||||||||||||||||||||||||||||||||||||||||
The Division Medium Preset: 70 fps | ||||||||||||||||||||||||||||||||||||||||||||||||||||||
Civilization VI Ultra Preset: 31.7 fps | ||||||||||||||||||||||||||||||||||||||||||||||||||||||
Civilization VI High Preset: 39.4 fps | ||||||||||||||||||||||||||||||||||||||||||||||||||||||
Civilization VI Medium Preset: 60.2 fps | ||||||||||||||||||||||||||||||||||||||||||||||||||||||
Civilization VI Minimum Preset: 73 fps | ||||||||||||||||||||||||||||||||||||||||||||||||||||||
Warhammer 40.000: Dawn of War III Maximum / On (100 % Gameplay Resolution): 18.8 fps | ||||||||||||||||||||||||||||||||||||||||||||||||||||||
Warhammer 40.000: Dawn of War III High / On (100 % Gameplay Resolution): 22.2 fps | ||||||||||||||||||||||||||||||||||||||||||||||||||||||
Warhammer 40.000: Dawn of War III Medium / On (100 % Gameplay Resolution): 33.6 fps | ||||||||||||||||||||||||||||||||||||||||||||||||||||||
Warhammer 40.000: Dawn of War III Minimum / Off (100 % Gameplay Resolution): 106 fps | ||||||||||||||||||||||||||||||||||||||||||||||||||||||
F1 2017 Ultra High Preset: 33 fps | ||||||||||||||||||||||||||||||||||||||||||||||||||||||
F1 2017 High Preset: 52 fps | ||||||||||||||||||||||||||||||||||||||||||||||||||||||
F1 2017 Medium Preset: 67 fps | ||||||||||||||||||||||||||||||||||||||||||||||||||||||
F1 2017 Ultra Low Preset: 133 fps | ||||||||||||||||||||||||||||||||||||||||||||||||||||||
Sims 4 Ultra Preset: 73 fps | ||||||||||||||||||||||||||||||||||||||||||||||||||||||
The Witcher 3 Ultra Graphics & Postprocessing (HBAO+): 19.7 fps | ||||||||||||||||||||||||||||||||||||||||||||||||||||||
The Witcher 3 High Graphics & Postprocessing (Nvidia HairWorks Off): 29.1 fps | ||||||||||||||||||||||||||||||||||||||||||||||||||||||
The Witcher 3 Medium Graphics & Postprocessing: 66.9 fps | ||||||||||||||||||||||||||||||||||||||||||||||||||||||
The Witcher 3 Low Graphics & Postprocessing: 112.3 fps | ||||||||||||||||||||||||||||||||||||||||||||||||||||||
Dota 2 Reborn ultra (3/3) best looking: 117 fps | ||||||||||||||||||||||||||||||||||||||||||||||||||||||
Dota 2 Reborn high (2/3): 126 fps | ||||||||||||||||||||||||||||||||||||||||||||||||||||||
Dota 2 Reborn med (1/3): 143 fps | ||||||||||||||||||||||||||||||||||||||||||||||||||||||
Dota 2 Reborn min (0/3) fastest: 154 fps | ||||||||||||||||||||||||||||||||||||||||||||||||||||||
World of Warships Very High Preset: 79 fps | ||||||||||||||||||||||||||||||||||||||||||||||||||||||
World of Warships High Preset: 109 fps | ||||||||||||||||||||||||||||||||||||||||||||||||||||||
World of Warships Medium Preset: 131 fps | ||||||||||||||||||||||||||||||||||||||||||||||||||||||
World of Warships Low Preset: 154 fps | ||||||||||||||||||||||||||||||||||||||||||||||||||||||
Anno 2205 Ultra High Preset: 13.9 fps | ||||||||||||||||||||||||||||||||||||||||||||||||||||||
Anno 2205 High Preset: 43.7 fps | ||||||||||||||||||||||||||||||||||||||||||||||||||||||
Anno 2205 Medium Preset: 92 fps | ||||||||||||||||||||||||||||||||||||||||||||||||||||||
Anno 2205 Low Preset: 113 fps | ||||||||||||||||||||||||||||||||||||||||||||||||||||||
Fallout 4 Ultra Preset: 33.9 fps | ||||||||||||||||||||||||||||||||||||||||||||||||||||||
Fallout 4 High Preset: 41.2 fps | ||||||||||||||||||||||||||||||||||||||||||||||||||||||
Fallout 4 Medium Preset: 74.6 fps | ||||||||||||||||||||||||||||||||||||||||||||||||||||||
Fallout 4 Low Preset: 116.6 fps | ||||||||||||||||||||||||||||||||||||||||||||||||||||||
Rise of the Tomb Raider Very High Preset: 31.2 fps | ||||||||||||||||||||||||||||||||||||||||||||||||||||||
Rise of the Tomb Raider High Preset: 37.1 fps | ||||||||||||||||||||||||||||||||||||||||||||||||||||||
Rise of the Tomb Raider Medium Preset: 63.2 fps | ||||||||||||||||||||||||||||||||||||||||||||||||||||||
Rise of the Tomb Raider Lowest Preset: 110.1 fps | ||||||||||||||||||||||||||||||||||||||||||||||||||||||
XCOM 2 Maximum Preset (8xMSAA instead of FXAA): 13.6 fps | ||||||||||||||||||||||||||||||||||||||||||||||||||||||
XCOM 2 High Preset: 27.4 fps | ||||||||||||||||||||||||||||||||||||||||||||||||||||||
XCOM 2 Medium Preset: 44.6 fps | ||||||||||||||||||||||||||||||||||||||||||||||||||||||
XCOM 2 Minimal Preset: 94 fps | ||||||||||||||||||||||||||||||||||||||||||||||||||||||
Doom High Preset: 16.2 fps | ||||||||||||||||||||||||||||||||||||||||||||||||||||||
Doom Ultra Preset: 48.2 fps | ||||||||||||||||||||||||||||||||||||||||||||||||||||||
Doom High Preset: 51.7 fps | ||||||||||||||||||||||||||||||||||||||||||||||||||||||
Overwatch High (Render Scale 100 %): 27.9 fps | ||||||||||||||||||||||||||||||||||||||||||||||||||||||
Overwatch Epic (Render Scale 100 %): 53.8 fps | ||||||||||||||||||||||||||||||||||||||||||||||||||||||
Overwatch High (Render Scale 100 %): 90 fps | ||||||||||||||||||||||||||||||||||||||||||||||||||||||
Call of Duty Infinite Warfare High / On: 19.1 fps | ||||||||||||||||||||||||||||||||||||||||||||||||||||||
Call of Duty Infinite Warfare Ultra / On: 46.2 fps | ||||||||||||||||||||||||||||||||||||||||||||||||||||||
Call of Duty Infinite Warfare High / On: 51.1 fps | ||||||||||||||||||||||||||||||||||||||||||||||||||||||
Call of Duty Infinite Warfare Normal / Off: 89 fps | ||||||||||||||||||||||||||||||||||||||||||||||||||||||
Call of Duty Infinite Warfare Low / Off: 99 fps | ||||||||||||||||||||||||||||||||||||||||||||||||||||||
Dishonored 2 Ultra Preset: 32.7 fps | ||||||||||||||||||||||||||||||||||||||||||||||||||||||
Dishonored 2 High Preset: 37.4 fps | ||||||||||||||||||||||||||||||||||||||||||||||||||||||
Dishonored 2 Medium Preset: 66 fps | ||||||||||||||||||||||||||||||||||||||||||||||||||||||
Dishonored 2 Very Low Preset: 76 fps | ||||||||||||||||||||||||||||||||||||||||||||||||||||||
Watch Dogs 2 Ultra Preset: 19.8 fps | ||||||||||||||||||||||||||||||||||||||||||||||||||||||
Watch Dogs 2 High Preset: 32 fps | ||||||||||||||||||||||||||||||||||||||||||||||||||||||
Watch Dogs 2 Medium Preset: 61.2 fps | ||||||||||||||||||||||||||||||||||||||||||||||||||||||
Watch Dogs 2 Low Preset: 72 fps | ||||||||||||||||||||||||||||||||||||||||||||||||||||||
Team Fortress 2 maximum: 61.5 fps | ||||||||||||||||||||||||||||||||||||||||||||||||||||||
Team Fortress 2 maximum: 111 fps | ||||||||||||||||||||||||||||||||||||||||||||||||||||||
Team Fortress 2 high: 117 fps | ||||||||||||||||||||||||||||||||||||||||||||||||||||||
Playerunknown's Battlegrounds (PUBG) Ultra Preset: 24.2 fps | ||||||||||||||||||||||||||||||||||||||||||||||||||||||
Playerunknown's Battlegrounds (PUBG) High Preset: 34.5 fps | ||||||||||||||||||||||||||||||||||||||||||||||||||||||
Playerunknown's Battlegrounds (PUBG) Medium Preset: 39.6 fps | ||||||||||||||||||||||||||||||||||||||||||||||||||||||
Playerunknown's Battlegrounds (PUBG) Very Low Preset: 87 fps | ||||||||||||||||||||||||||||||||||||||||||||||||||||||
Power Consumption Witcher 3 ultra Efficiency (external Monitor): 0.2706 fps per Watt | ||||||||||||||||||||||||||||||||||||||||||||||||||||||
Power Consumption FurMark 1.19 GPU Stress Test (external Monitor): 101 Watt* | ||||||||||||||||||||||||||||||||||||||||||||||||||||||
Power Consumption The Witcher 3 ultra (external Monitor): 72.8 Watt* | ||||||||||||||||||||||||||||||||||||||||||||||||||||||

#0 before search +0s ... 0s
#1 after search +0s ... 0s
#2 added compareJS +0s ... 0s
#3 looking up spec 35875 +0s ... 0s
#4 looking up spec 36546 +0s ... 0s
#5 looking up spec 36655 +0s ... 0s
#6 more than one entry found +0.006s ... 0.006s
#7 GL702VM-GC102D for array +2.755s ... 2.761s
#8 Strix GL753VD-GC045T for array +4.854s ... 7.616s
#9 GL702VM-GC017T for array +0.024s ... 7.64s
#10 return log +0.001s ... 7.641s