Deutsch
 English
 Español
 Français
 Italiano
 Nederlands
 Polski
 Português
 Русский
 Türkçe
 Svenska
 Chinese
 Magyar
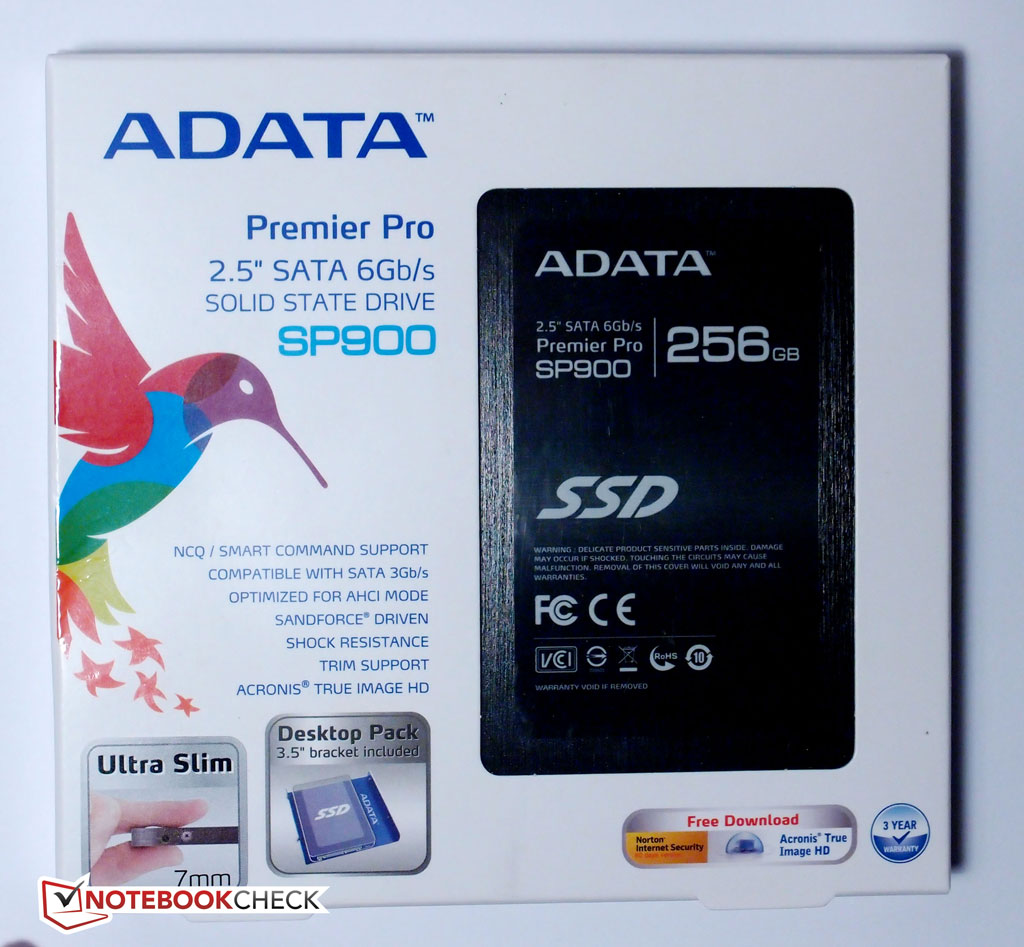
Review ADATA SP900 - 256 GB SSD
A-Data is one of the major DRAM manufacturer and has gradually included SSDs in its product lineup. Today the company offers a broad range of SSDs, with the common denominator being SandForce controllers.
As previously mentioned, the SandForce SF-2281 controller used in the Premier Pro SP900 is used in lots of SSD models from several manufacturers, among them Intel. It is therefore a well-known and extensively tested piece of circuitry. It has consistently performed well with few major problems.
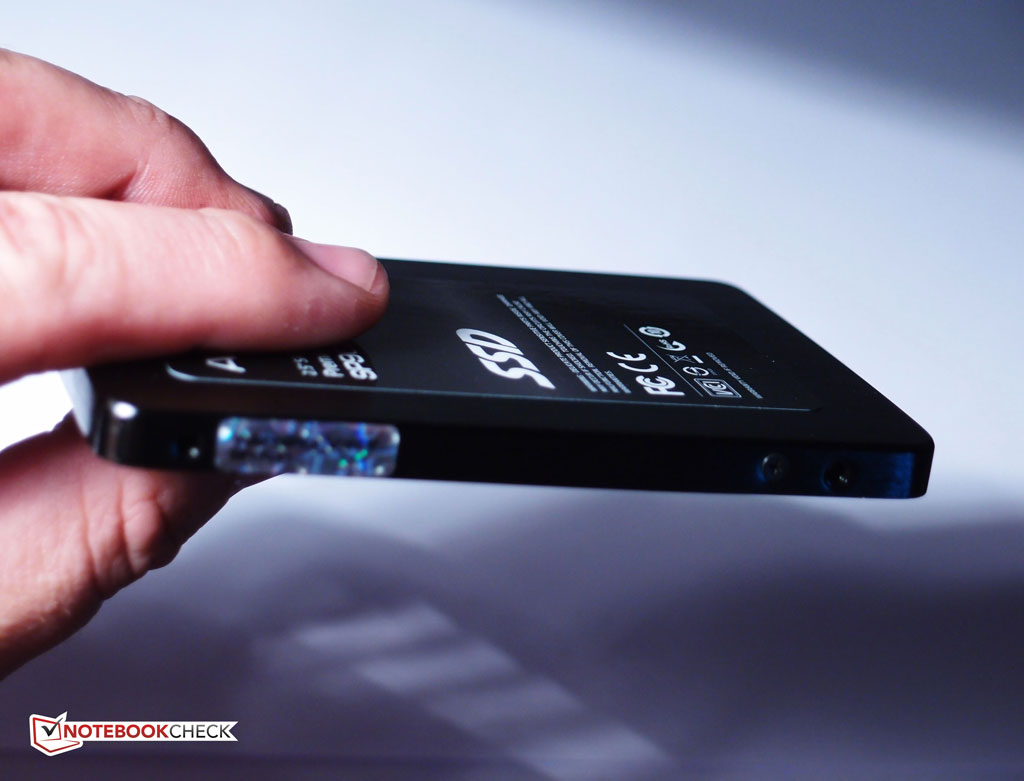
In the SP900, the SF-2281 is paired with asynchronous MLC NAND, as opposed to the more expensive A-Data SX900 which is equipped with the synchronous variant. That makes SP900 A-Data’s mid-range offering, although the difference compared to the SX900 in everyday use is unlikely to be dramatic.
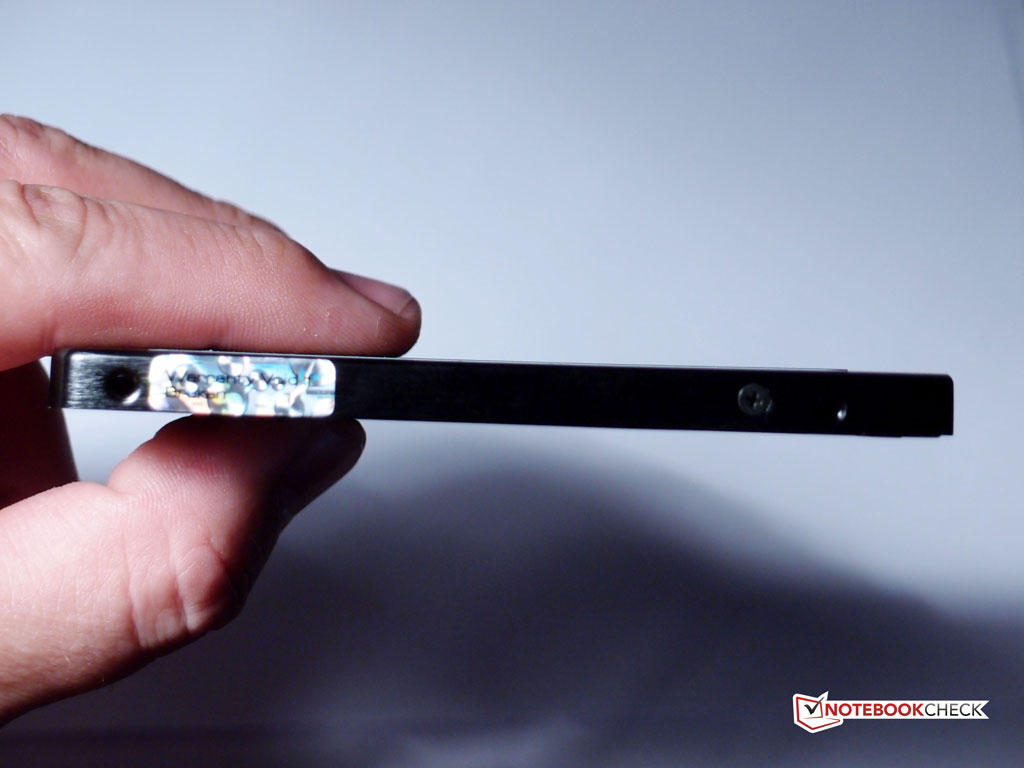
One of the main selling points for the SP900 series is that it's available in 64 GB, 128 GB and 256 GB capacities. This differs from most other SandForce-based SSD that normally come in smaller capacities (e.g. 240 GB), where the remainder of the NAND has been part of the drives' spare area (so-called overprovisioning). In other words the SP900 makes 7% more of the Flash memory available to the user. It is nevertheless a bad idea to fill any SSD completely with data, as this will interfere with wear leveling and adversely affect performance.
The A-Data Premier Pro SP900 256 GB is currently being sold for about $160 on the US Amazon site – a figure comparable to other SF-2281-based drives and a great deal less than the Samsung 840 Pro ($220) and also less than the low-end, TLC-based Samsung 840 EVO ($170). With those prices in mind, the SP900 sounds like a great deal. A-Data also offers a 3-year warranty, which is reassuring.
Test setup
As with other SSD reviews, we use a desktop PC, which in this case includes an Intel Core i7-3770K, a Gigabyte Z77-based mainboard, 16 GB of 1600 MHz RAM and an AMD Radeon 7850 graphics card. Please note that this test setup is different from our previous SSD reviews, but not in a way that should significantly impact the results. The SSD is installed in the first SATA 3.0 6Gbps port (port 0) and the operating system is Windows 8 Pro.
Test Setup and Synthetic Benchmarks

ATTO Vs. AS SSD and CrystalDiskMark
The SP900 offered up a few surprises in our synthetic benchmarks. The ATTO results indicate that the drive is right up there with the fastest SATA 6 Gbps drives on the market, with very consistent (and high) read/write speeds from 256K and up as we would expect from a drive of this caliber. It nearly matches the advertised maximum read/write speeds (555/530) at 552 MB/s and 522 MB/s in our test system. The small discrepancy should be within the margin of error.
With those results in mind, it’s a bit surprising to see the write speeds drop so much in both the AS SSD and CrystalDiskMark benchmarks. Whereas the sequential reads at around 500 MB/s in both cases are every bit as good as expected, the sequential write speeds drop all the way down to 189 MB/s in AS SSD and 237 MB/s in CrystalDiskMark – more in line with what you might see if it were attached to a SATA 2.0 port.
AS SSD in particular is known for delivering different results on subsequent runs, but the lower-than-average write speeds persist. It is well known by now that all SSDs based on SandForce circuitry are highly dependent on compression; so lower speeds with already compressed data can be expected. This is also reflected in a comparison to the (also SandForce-based) Intel 520, which is nevertheless faster in most cases thanks to its synchronous NAND chips.
The SP900 also comes in behind the TLC NAND-equipped (non-Pro) Samsung SSD 840 in terms of write speeds, although it is far ahead in the more practically oriented copy test.
4k performance benchmarks also turned out lower than expected values. Although the 45K write IOPS in AS SSD leaves many older SSDs behind in the dust, it is only half of the specified maximum of 90K IOPS for the 256 GB model. Access times for the SP900 are also somewhat high compared to other recent SSDs.
| ADATA SP900 256 GB , | Review OCZ Vertex 450 256 GB Radeon HD 7850M, 3770K | Intel SSD 520 Series 240GB Desktop GeForce GTX 470, 2600K, Intel SSD 520 Series SSDSC2CW240A | Samsung SSD 840 250 GB Desktop GeForce GTX 470, 2600K, Samsung SSD 840 250GB MZ7TD256HAFV | |
|---|---|---|---|---|
| AS SSD | 50% | 17% | 25% | |
| Copy Game MB/s | 364.9 | 392.5 8% | 214 -41% | 158 -57% |
| Copy Program MB/s | 172.7 | 224.3 30% | 143.9 -17% | 124 -28% |
| Copy ISO MB/s | 340.5 | 406 19% | 368 8% | 211 -38% |
| Score Total | 640 | 1016 59% | 802 25% | 950 48% |
| Score Write | 256 | 421 64% | 339 32% | 302 18% |
| Score Read | 260 | 390 50% | 309 19% | 432 66% |
| Access Time Write * | 0.251 | 0.044 82% | 0.212 16% | 0.054 78% |
| Access Time Read * | 0.201 | 0.107 47% | 0.126 37% | 0.063 69% |
| 4K-64 Write | 177 | 279.4 58% | 231.8 31% | 207 17% |
| 4K-64 Read | 191 | 320.1 68% | 236.2 24% | 354 85% |
| 4K Write | 57 | 92.3 62% | 72 26% | 70 23% |
| 4K Read | 18 | 19.6 9% | 24.41 36% | 26 44% |
| Seq Write | 208.4 | 492.4 136% | 288.4 38% | 254 22% |
| Seq Read | 502 | 506 1% | 496.1 -1% | 513 2% |
| CrystalDiskMark 3.0 | 41% | 20% | 24% | |
| Write 4k QD32 | 231.7 | 354.6 53% | 266.3 15% | 259 12% |
| Read 4k QD32 | 185.8 | 336.4 81% | 239.9 29% | 372 100% |
| Write 4k | 59.1 | 73.9 25% | 91.2 54% | 86.1 46% |
| Read 4k | 29.18 | 22.13 -24% | 29.74 2% | 29.7 2% |
| Write 512 | 234.2 | 484.6 107% | 299.5 28% | 258 10% |
| Read 512 | 439.5 | 381.3 -13% | 441.2 0% | 458 4% |
| Write Seq | 237 | 489.3 106% | 307.8 30% | 259 9% |
| Read Seq | 497 | 468.8 -6% | 497.7 0% | 531 7% |
| HD Tune Transfer Rate Average | ||||
| Transfer Rate Average | 298.2 | 299.8 1% | 376.2 26% | |
| Total Average (Program / Settings) | 31% /
44% | 21% /
18% | 25% /
25% |
* ... smaller is better
AS SSD in particular is known for delivering different results on subsequent runs, but the lower-than-average write speeds persist. It is well known by now that all SSDs based on SandForce circuitry are highly dependent on compression; so lower speeds with already compressed data can be expected. This is also reflected in a comparison to the (also SandForce-based) Intel 520, which is nevertheless faster in most cases thanks to its synchronous NAND chips.
4k performance benchmarks also turned out lower than expected values. Although the 45K write IOPS in AS SSD leaves many older SSDs behind in the dust, it is only half of the specified maximum of 90K IOPS for the 256 GB model. Access times for the SP900 are also somewhat high compared to other recent SSDs.
The SP900 also comes in behind the TLC NAND-equipped (non-Pro) Samsung SSD 840 in terms of write speeds, although it is far ahead in the more practically oriented copy test.
Program Performance
In this comparison, we can see that the SP900 is not as far behind the competitors as the previous numbers may indicate. Copy performance with AS SSD places it somewhere between the Samsung 840 and the 840 Pro.

As for the subjective user experience, it is really hard to tell one high-end SSD from another these days. One explanation is that the SATA 6 Gbps interface is largely saturated by most modern SSDs. Moving from an exact clone of the previously tested Vertex 450 did not result in a different subjective experience, or actual boot times. In turn, neither did moving to the Vertex from the previous Intel drive (and so on).
Standardized benchmarks have a somewhat more nuanced story to tell. As seen above, A-Data’s SP900 does a good job of copying files in AS SSD, but it also performs as well as expected in PCMark Vantage – another test that attempts, quite successfully, to mimic real-world use. Unfortunately, due to our different test setups we cannot rely too much on these figures other than the System Storage scores. On the other hand those are what’s important.
| ADATA SP900 256 GB , | Review OCZ Vertex 450 256 GB Radeon HD 7850M, 3770K | Intel SSD 520 Series 240GB Desktop GeForce GTX 470, 2600K, Intel SSD 520 Series SSDSC2CW240A | Samsung SSD 840 250 GB Desktop GeForce GTX 470, 2600K, Samsung SSD 840 250GB MZ7TD256HAFV | |
|---|---|---|---|---|
| PCMark 7 | 28% | 16% | 14% | |
| System Storage | 5341 | 5302 -1% | 5216 -2% | 5269 -1% |
| Computation | 7288 | 7403 2% | 4962 -32% | 4572 -37% |
| Creativity | 7842 | 3650 -53% | 5310 -32% | 5214 -34% |
| Entertainment | 2258 | 8064 257% | 4739 110% | 4689 108% |
| Productivity | 5009 | 3131 -37% | 4808 -4% | 4780 -5% |
| Lightweight | 5604 | 3897 -30% | 5068 -10% | 5018 -10% |
| Score | 2709 | 4222 56% | 4941 82% | 4862 79% |
| IOMeter | ||||
| Workstation, 3min, 10GB Partition | 165.7 | 61.8 | ||
| IOMix, 5min, 10GB Partition | 230.2 | 89.6 | ||
| Total Average (Program / Settings) | 28% /
28% | 16% /
16% | 14% /
14% |
There’s only a very small difference between the different SSDs, something that would change considerably if we were to add any mechanical hard drive.
Other practical aspects like starting applications, games or booting into Windows are also areas where the difference between SSDs tends to be quite microscopic. For example, different BIOS POST procedures will have a much greater effect on boot times than swapping one SSD for another. Most recent drives including the SP900 reaches the Windows 8 desktop in less than 10 seconds.
Similarly, our standardized Battlefield 3 startup routine clocks in at less than 20 seconds with the SP900, as it does with other SSDs. A more interesting comparison is to the mechanical Toshiba MK6461GSYN, a 640 GB 7200 rpm notebook hard drive that requires 72 seconds to perform the same task.
Data Compression
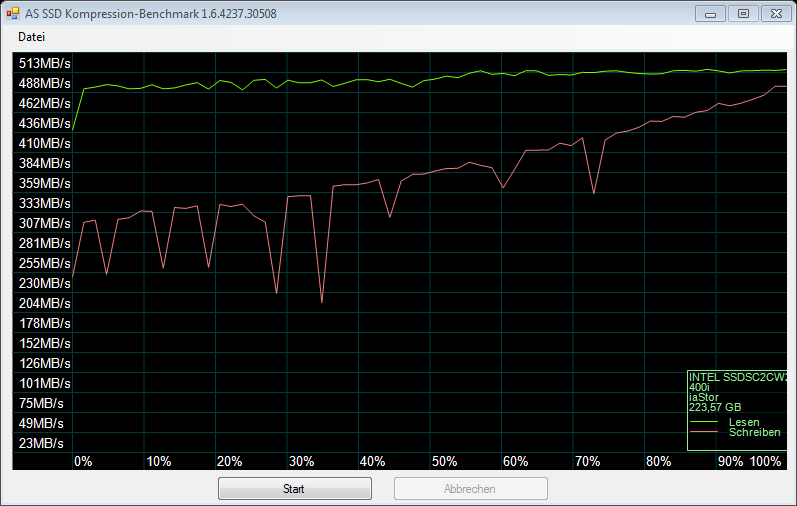
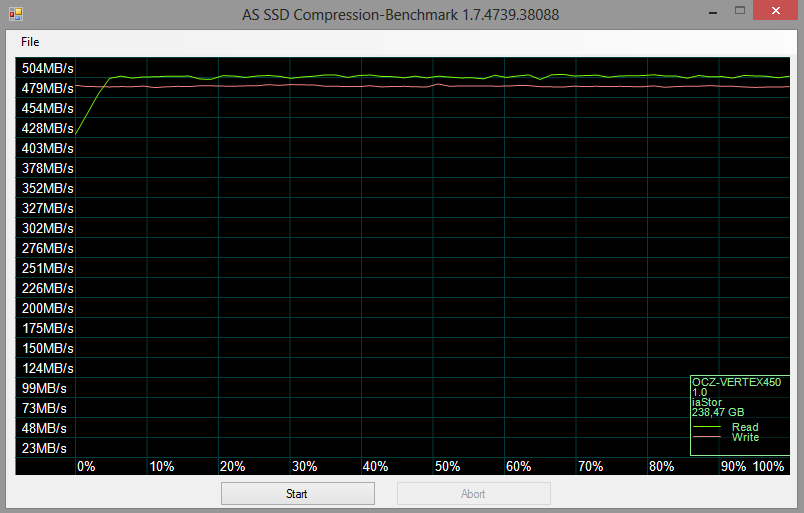
We’ve already discussed the properties of the SandForce controller and its shortcomings in dealing with data that can’t be compressed. This controller relies heavily on compression to achieve its top speeds so it is entirely unsurprising that the SP900 posts a similar result as all the other drives using the SF-2281 or other SandForce controllers.
As expected, write speeds drops along with increasing compression, whereas read speeds remain largely unaffected. The SP900 looks similar to the corresponding Intel graph, while drives such as the Vertex 450 are much more consistent.

Verdict
Not much can be said about the SandForce SF-2281 controller that hasn’t already been analyzed in great detail. It has its strengths and weaknesses, which are all present in the A-DATA SP900. On the whole, it is a tried and tested part with proven reliability and solid performance, even if there are several competitors on the market today that are faster.
The SP900 uses the SF-2281 in combination with asynchronous NAND chips and should therefore be compared with the competitors’ mid-range offerings. In the synthetic benchmarks the results are contradictory, with consistently excellent performance in ATTO, but relatively poor write speeds in AS SSD.
Practical tests such as file copying paint a more positive picture of the SP900, showing that it clearly has the capacity to outperform entry-level drives such as the TLC-based Samsung 840. When also factoring in the current price points compared to other SSDs in the same category, we can safely conclude that the SP900 offers excellent value.