Notebookcheck Logo

Google Tensor vs Apple A15 Bionic

Google Tensor

► remove from comparison Google Tensor

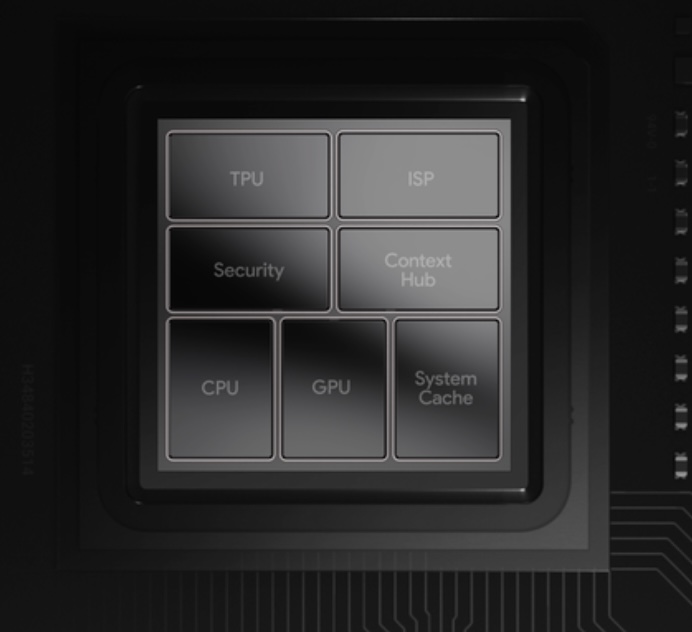
The Google Tensor SoC (G1, first generation) is the first smartphone processor from Google. It is positioned as a high end SoC and focuses on the integrated TPU for efficient AI and ML calculations. The CPU part integrates two fast and big ARM Cortex X1 cores at up to 2.8 GHz. A second cluster integrates 2 mid range Cortex-A76 cores at up to 2.25 GHz. Finally, four small ARM Cortex-A55 cores with up to 1.8 GHz are integrated for efficiency purposes. All cores can access the shared 4 MB L3 cache. 

The successors of the Tensor SoC are the Tensor G2 and G3.

The chip also integrates a Titan M2 security processor and a ARM Mali G78 MP20 GPU. The chip is manufactured in the modern 5nm process.

Apple A15 Bionic

► remove from comparison Apple A15

The Apple A15 Bionic is a System on a Chip (SoC) from Apple that is found in the iPhone 13 and iPad Mini (2021) models. It was announced late 2021 and offers 6 cores divided in 2 performance cores and four power efficiency cores. The CPU performance increases only slightly compared to the A14, but GPU (in the higher end models) offers higher gains.

The chip is manufactured in 5nm and integrates 15.8 billion transistors (compared to the 11.8 of the A14).

ModelGoogle TensorApple A15 Bionic
CodenameExynos X1 / Cortex-A76 / A55
Clock1800 - 2800 MHz2020 - 3230 MHz
L3 Cache4 MB32 MB
Cores / Threads8 / 86 / 6
Technology5 nm5 nm
FeaturesARM Mali-G78MP20 GPUARMv8 Instruction Set, Machine Learning Controller, 16-Core Neural Engine, Secure Enclave, Advanced Image Signal Processor
iGPUARM Mali-G78 MP20 ( - 848 MHz)Apple A15 GPU 5-Core
ArchitectureARMARM
Announced
Manufacturerblog.google
SeriesApple Apple A-Series
Series: Apple A-Series
Apple A18 Pro compare - 4 GHz6 / 6 cores
Apple A18 compare - 3.8 GHz6 / 6 cores
Apple A15 Bionic « 2.02 - 3.23 GHz6 / 6 cores32 MB L3
Apple A12 Bionic compare - 2.49 GHz6 / 6 cores
Apple A6x compare1.4 GHzcores
Apple A6 compare1 GHzcores
L2 Cache16 MB
Transistors15800 Million

Benchmarks

3DMark - 3DMark Sling Shot Extreme (ES 3.1) Unlimited Physics
min: 3643     avg: 3946     median: 3919 (37%)     max: 4277 Points
49%
A15 +
min: 1852     avg: 2027     median: 1913 (18%)     max: 2307 Points
3DMark - 3DMark Sling Shot (ES 3.0) Unlimited Physics
min: 3393     avg: 4014     median: 4147 (47%)     max: 4501 Points
Geekbench 6.4 - Geekbench 6.4 Single-Core
100%
1 A15 +
2332 Points (58%)
Geekbench 6.4 - Geekbench 6.4 Multi-Core
100%
1 A15 +
5661 Points (22%)
Geekbench 5.5 - Geekbench 5.1 - 5.5 64 Bit Single-Core
min: 1025     avg: 1041     median: 1041 (41%)     max: 1057 Points
167%
A15 +
min: 1590     avg: 1723     median: 1734 (68%)     max: 1755 Points
Geekbench 5.5 - Geekbench 5.1 - 5.5 64 Bit Multi-Core
min: 2805     avg: 2895     median: 2940 (5%)     max: 2941 Points
163%
A15 +
min: 4559     avg: 4755     median: 4788 (9%)     max: 4914 Points
Geekbench 4.4 - Geekbench 4.1 - 4.4 64 Bit Single-Core
100%
1 Tensor +
4815 Points (48%)
Geekbench 4.4 - Geekbench 4.1 - 4.4 64 Bit Multi-Core
100%
1 Tensor +
11589 Points (12%)
Geekbench 4.0 - Geekbench 4.0 64 Bit Single-Core
100%
1 Tensor +
4608 Points (51%)
Geekbench 4.0 - Geekbench 4.0 64 Bit Multi-Core
100%
1 Tensor +
11058 Points (16%)
Geekbench 3 - Geekbench 3 64 Bit Multi-Core
100%
1 Tensor +
9830 Points (15%)
Geekbench 3 - Geekbench 3 64 Bit Single-Core
100%
1 Tensor +
3264 Points (49%)
Mozilla Kraken 1.1 - Kraken 1.1 Total Score *
min: 915     avg: 1160     median: 1034 (1%)     max: 1531.6 ms
229%
A15 +
min: 413.6     avg: 455.6     median: 451 (1%)     max: 507.3 ms
Sunspider - Sunspider 1.0 Total Score *
100%
1 A15 +
77 ms (1%)
Octane V2 - Octane V2 Total Score
min: 33046     avg: 40152     median: 43376 (33%)     max: 44034 Points
148%
A15 +
min: 57143     avg: 63305     median: 64026.5 (48%)     max: 65969 Points
WebXPRT 4 - WebXPRT 4 Score
72 Points (20%)
261%
A15 +
min: 188     avg: 188.3     median: 188 (52%)     max: 189 Points
WebXPRT 3 - WebXPRT 3 Score
min: 77     avg: 97.3     median: 105 (19%)     max: 110 Points
238%
A15 +
min: 219     avg: 254.3     median: 250 (45%)     max: 279 Points
AnTuTu v8 - AnTuTu v8 UX
100%
1 Tensor +
80242 Points (67%)
AnTuTu v8 - AnTuTu v8 MEM
100%
1 Tensor +
91046 Points (73%)
AnTuTu v8 - AnTuTu v8 GPU
100%
1 Tensor +
266666 Points (49%)
AnTuTu v8 - AnTuTu v8 CPU
100%
1 Tensor +
173530 Points (63%)
AnTuTu v8 - AnTuTu v8 Total Score
100%
1 Tensor +
611484 Points (59%)
Antutu v9 - AnTuTu v9 Total Score
min: 702981     avg: 713075     median: 715338 (35%)     max: 720905 Points
112%
A15 +
min: 722973     avg: 788523     median: 800415 (39%)     max: 832548 Points
Antutu v9 - AnTuTu v9 CPU
min: 179373     avg: 186798     median: 189382 (47%)     max: 191638 Points
111%
A15 +
min: 192891     avg: 209810     median: 209802 (52%)     max: 227638 Points
PassMark PerformanceTest Mobile V1 - PerformanceTest Mobile V1 CPU Tests
100%
1 A15 +
min: 10349     avg: 10411     median: 10410.5 (1%)     max: 10472 Points
PCMark for Android - PCM f. Android Storage 2.0 score
100%
1 Tensor +
min: 17485     avg: 22609     median: 22608.5 (10%)     max: 27732 Points
PCMark for Android - PCM f. Android Work Score 3.0
100%
1 Tensor +
min: 9717     avg: 10577     median: 10409 (38%)     max: 11605 Points
CrossMark - CrossMark Overall
min: 849     avg: 873     median: 865 (32%)     max: 906 Points
132%
A15 +
min: 1132     avg: 1156     median: 1145 (43%)     max: 1190 Points
Power Consumption - Geekbench 5.5 Power Consumption 150cd *
100%
1 Tensor +
min: 5.28     avg: 5.4     median: 5.4 (2%)     max: 5.64 Watt
Power Consumption - Idle Power Consumption 150cd 1min *
100%
1 Tensor +
min: 0.758     avg: 0.9     median: 0.8 (1%)     max: 1.013 Watt

Average Benchmarks Google Tensor → 100% n=11

Average Benchmarks Apple A15 Bionic → 151% n=11

- Range of benchmark values for this graphics card
red legend - Average benchmark values for this graphics card
* Smaller numbers mean a higher performance
1 This benchmark is not used for the average calculation

Add one or more devices and compare

In the following list you can select (and also search for) devices that should be added to the comparison. You can select more than one device.

restrict list:
v1.33
log 20. 13:46:33

#0 ran 0s before starting gpusingle class +0s ... 0s

#1 checking url part for id 14022 +0s ... 0s

#2 checking url part for id 13825 +0s ... 0s

#3 redirected to Ajax server, took 1753011993s time from redirect:0 +0s ... 0s

#4 did not recreate cache, as it is less than 5 days old! Created at Sat, 19 Jul 2025 13:28:35 +0200 +0s ... 0s

#5 composed specs +0.003s ... 0.003s

#6 did output specs +0s ... 0.003s

#7 getting avg benchmarks for device 14022 +0.001s ... 0.004s

#8 got single benchmarks 14022 +0.005s ... 0.009s

#9 getting avg benchmarks for device 13825 +0s ... 0.01s

#10 got single benchmarks 13825 +0.001s ... 0.011s

#11 got avg benchmarks for devices +0s ... 0.011s

#12 min, max, avg, median took s +0.015s ... 0.025s

#13 return log +0s ... 0.025s

Please share our article, every link counts!
Mail Logo
> Expert Reviews and News on Laptops, Smartphones and Tech Innovations > Benchmarks / Tech > Processor Comparison - Head 2 Head
Redaktion, 2017-09- 8 (Update: 2023-07- 1)