

Apple A19 Pro 6-Core GPU vs Apple A19 Pro 5-Core GPU
Apple A19 Pro 6-Core GPU
► remove from comparison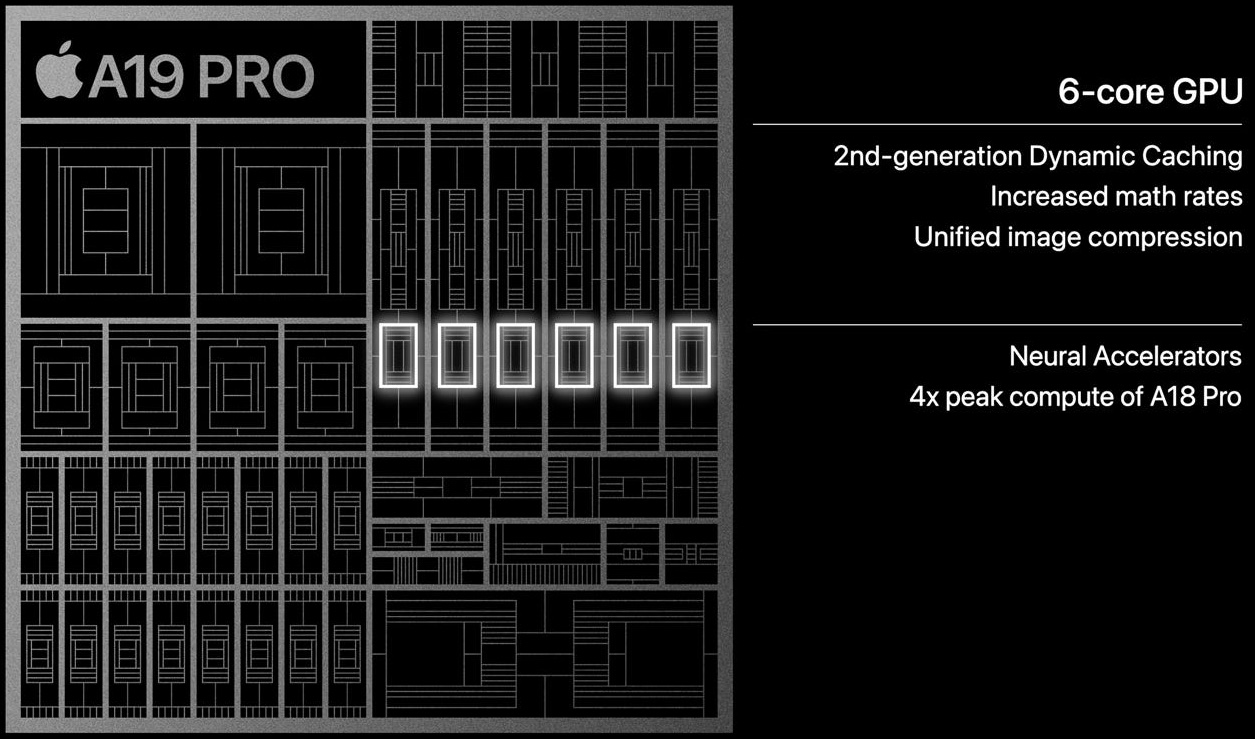
The Apple A19 Pro 6-Core GPU is a fast integrated graphics card for smartphones that can be found on the A19 Pro SoC. This iGPU has 6 cores and is capable of ray tracing. The 6 cores offer 96 EUs (Execution Units) = 768 ALUs based on the Apple10 architecture. Compared to the A19 GPU, the A19 Pro GPU offers one more core and more caches.
According to Apple, FP16 performance has been doubled compared to its predecessor and neural accelerators (tensor cores) have been integrated into the GPU cores. This means that the GPU can also help with AI acceleration.
In our benchmarks, the A19 Pro GPU has a healthy advantage over the old A18 Pro GPU (30% on average at the time of writing) but is still topped by the ARM Immortalils-G925 MC16 (Xring O1). Thanks to the improved cooling (vapor chamber in the iPhone 17 Pro), the sustained performance is clearly improved where games should profit a lot.
The A19 Pro SoC is manufactured in the modern N3P process at TSMC (3nm) and should therefore be very energy-efficient.
Apple A19 Pro 5-Core GPU
► remove from comparison
The Apple A19 Pro 5-Core GPU is a fast integrated graphics card for smartphones that can be found on the A19 Pro SoC. This iGPU has 5 of the 6 cores and is capable of ray tracing. The 5 cores offer 80 EUs (Execution Units) = 640 ALUs based on the Apple10 architecture. Compared to the A19 GPU, the A19 Pro GPU offers larger caches, the A19 Pro in the iPhone 17 Pro offers one GPU core more.
According to Apple, FP16 performance has been doubled compared to its predecessor and neural accelerators (tensor cores) have been integrated into the GPU cores. This means that the GPU can also help with AI acceleration.
Due to the thin housing, the performance in the iPhone Air is significantly dependent on temperatures and therefore susceptible to thermal throttling. Many benchmarks even produce slower results than the 5-core GPU in the Apple A19 (iPhone 17).
The A19 Pro SoC is manufactured in the modern N3P process at TSMC (3 nm) and should therefore be very energy-efficient.
| Apple A19 Pro 6-Core GPU | Apple A19 Pro 5-Core GPU | |||||||||||||||||||
| Apple A19 Series |
|
| ||||||||||||||||||
| Pipelines | 6 - unified | 5 - unified | ||||||||||||||||||
| Memory Type | LPDDR5x | LPDDR5x | ||||||||||||||||||
| Shared Memory | yes | yes | ||||||||||||||||||
| Power Consumption | 6 Watt | 6 Watt | ||||||||||||||||||
| technology | 3 nm | 3 nm | ||||||||||||||||||
| Date of Announcement | 09.09.2024 | 09.09.2025 | ||||||||||||||||||
| Predecessor | A18 Pro GPU | A18 Pro GPU |
| |||||||||
Benchmarks
GFXBench T-Rex HD Offscreen C24Z16 + Apple A19 Pro 6-Core GPU
Average Benchmarks Apple A19 Pro 6-Core GPU → 100% n=14
Average Benchmarks Apple A19 Pro 5-Core GPU → 78% n=14
* Smaller numbers mean a higher performance
1 This benchmark is not used for the average calculation
Game Benchmarks
The following benchmarks stem from our benchmarks of review laptops. The performance depends on the used graphics memory, clock rate, processor, system settings, drivers, and operating systems. So the results don't have to be representative for all laptops with this GPU. For detailed information on the benchmark results, click on the fps number.

Call of Duty Mobile
2020

PUBG Mobile
2018Average Gaming Apple A19 Pro 6-Core GPU → 100%
Average Gaming 30-70 fps → 100%
| Apple A19 Pro 6-Core GPU | Apple A19 Pro 5-Core GPU | |||||||||||||
|---|---|---|---|---|---|---|---|---|---|---|---|---|---|---|
| low | med. | high | ultra | QHD | 4K | low | med. | high | ultra | QHD | 4K | |||
| Call of Duty Mobile | 58.5 | |||||||||||||
| Genshin Impact | 116 | 86 | ||||||||||||
| PUBG Mobile | 116.6 | 57.3 | 38.4 | |||||||||||
| Apple A19 Pro 6-Core GPU | Apple A19 Pro 5-Core GPU | |||||||||||||
| low | med. | high | ultra | QHD | 4K | low | med. | high | ultra | QHD | 4K | < 30 fps < 60 fps < 120 fps ≥ 120 fps | 2 | | 1 | 2 1 | | | < 30 fps < 60 fps < 120 fps ≥ 120 fps | | | | | | |
For more games that might be playable and a list of all games and graphics cards visit our Gaming List